by Bryan Perry
September 10, 2024
Pretty impressive one would think. But the rub on the market now, that brought about the worst week when lower earnings growth prospects cause price-earnings ratios to shrink. Coming off great second quarter earnings, the stock market has suddenly become more volatile and considerably more defensive. Clearly, the sharp downward revisions in year-over-year and monthly job totals reveal a job market that is not as healthy as first reported. July non-farm payrolls fell by 25,000, while June non-farm payrolls were revised down by 61,000 jobs, from an initial 179,000 jobs to 118,000.
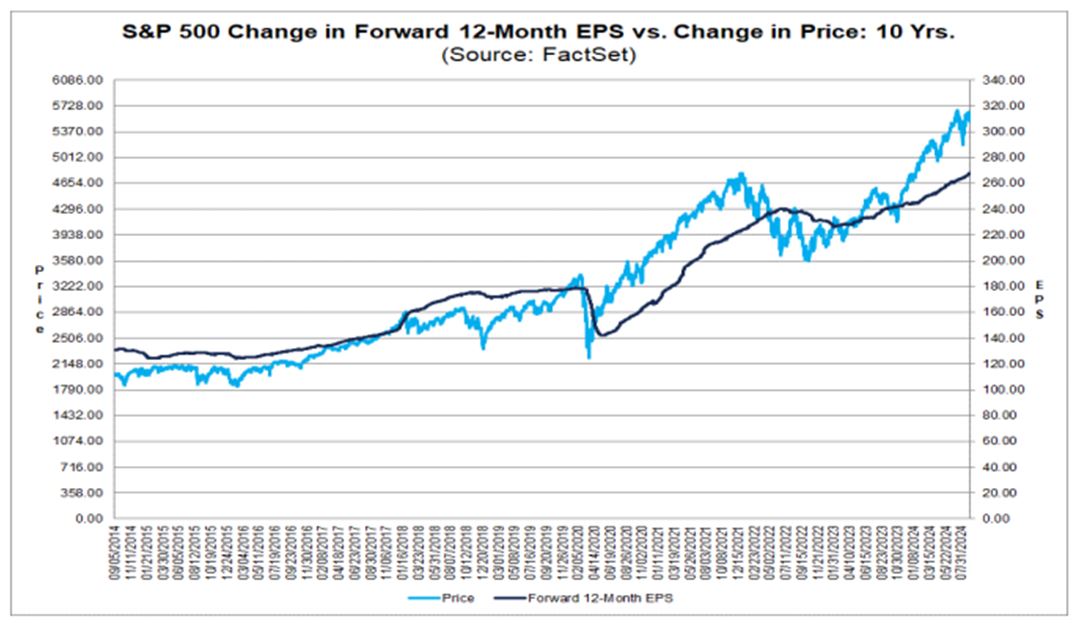
A review of the second quarter data runs counter to the latest sentiment. Consider these 2Q earnings data:
- The S&P 500 reported earnings growth of 11.3%, the highest year-over-year rate since Q4’21.
- Only 67 companies issued negative EPS guidance for Q2 – the lowest number since Q4’22.
- 80% of S&P 500 companies reported EPS above estimates – above the five-year average of 77%.
- Nine of 11 sectors reported higher earnings due to upward EPS revisions and positive EPS surprises.
–Data from FactSet
That’s a pretty impressive list, but last week delivered the worst market week for the major averages since March of 2023, causing a “multiple compression,” when lower earnings growth prospects cause price-earnings ratios to shrink. As a result, the S&P dropped 4.25% and the NASDAQ composite fell 5.77% fueled by that weak August jobs report, which raised concerns about a potential recession instead of a soft landing. The forward 12-month P/E ratio for the S&P 500 is now 20.6, vs. the five-year average of 19.4.
Concerns about a slowing economy have rapidly emerged. This has caused analysts to trim their S&P earnings estimates for the third quarter. According to FactSet, the Q3 bottom-up EPS estimate (which is an aggregation of the median EPS estimates for Q3 for all the companies in the index) decreased by 2.8% (to $61.44 from $63.20) from June 30 to August 31. This falls in line with many past downward revisions.
Graphs are for illustrative and discussion purposes only. Please read important disclosures at the end of this commentary.
Conversely, in the same report, the analyst community increased its EPS estimates for calendar year 2025 by 0.3% to $279.52 from $278.79 over this same June-August period. The rising level of market anxiety is all about whether that 2.8% reduction will increase, and whether the Fed will be slow to react more aggressively to prevent the labor market from exhibiting negative growth. It is thought that the Fed’s telegraphing of a rate cut at the September 18 FOMC meeting would provide some real-time action to address investor hand-wringing, but the new narrative is calling for the Fed to take even bolder action.
There are increasing odds now that the Fed will consider a 50-basis point cut instead of a quarter-point cut if they are truly as data dependent as they claim to be. Between now and the FOMC meeting next week, the market will digest both the CPI and PPI inflation news, University of Michigan Consumer Sentiment, Industrial Production, August Retail Sales, Housing Starts and Housing Permits. This set of reports could well pave the way for a half-point cut, something the bond market has already voted in favor of.
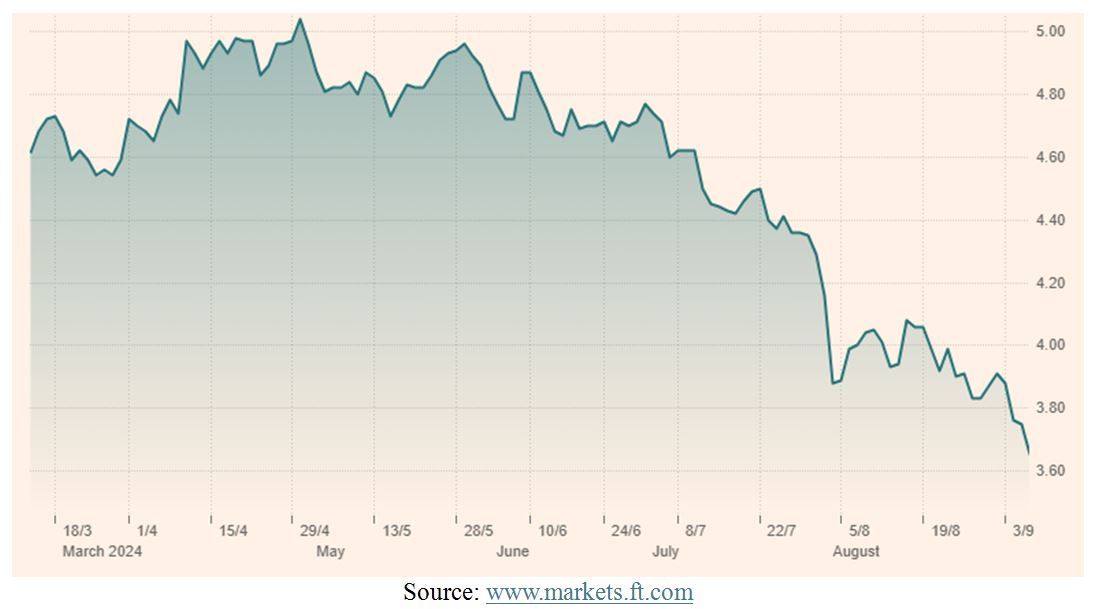
While the Fed has maintained the Fed Funds Rate at a range of 5.25%-5.50%, the yield on the 2-year Treasury has declined from 5.04% back in early May to 3.65% as of last Friday September 6. This 150-basis point move in yield to the downside is nothing short of dramatic as the Fed has stood pat and watched energy prices fall, commodity prices fall, and consumer credit spike to all-time highs.
The 2-Year Treasury Note Rate Has Declined Sharply
– From 5.04% to 3.65% in the Last Four Months
Graphs are for illustrative and discussion purposes only. Please read important disclosures at the end of this commentary.
In my opinion, the Fed should have cut rates following the July Non-Farm Payroll report released the first week of August, and even more so following the 181,000 year-over-year downward jobs revision.
It becomes frustrating if the Fed doesn’t meet the bond market where it is trading. If the Fed only cuts by a quarter-point next week and then waits until after the election to cut another quarter point on November 7, one could argue that they will miss a window of opportunity to provide insurance for a soft landing.
The suddenly weak job market data should send a strong signal to Fed officials to get in front of this weak labor market before risking another negative monthly payroll report that would rattle the market further.
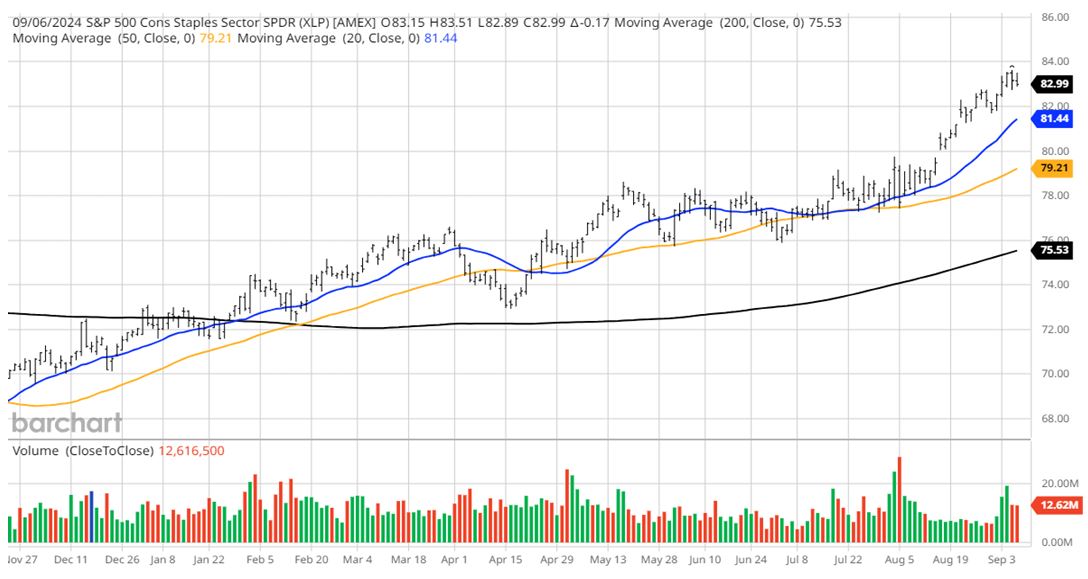
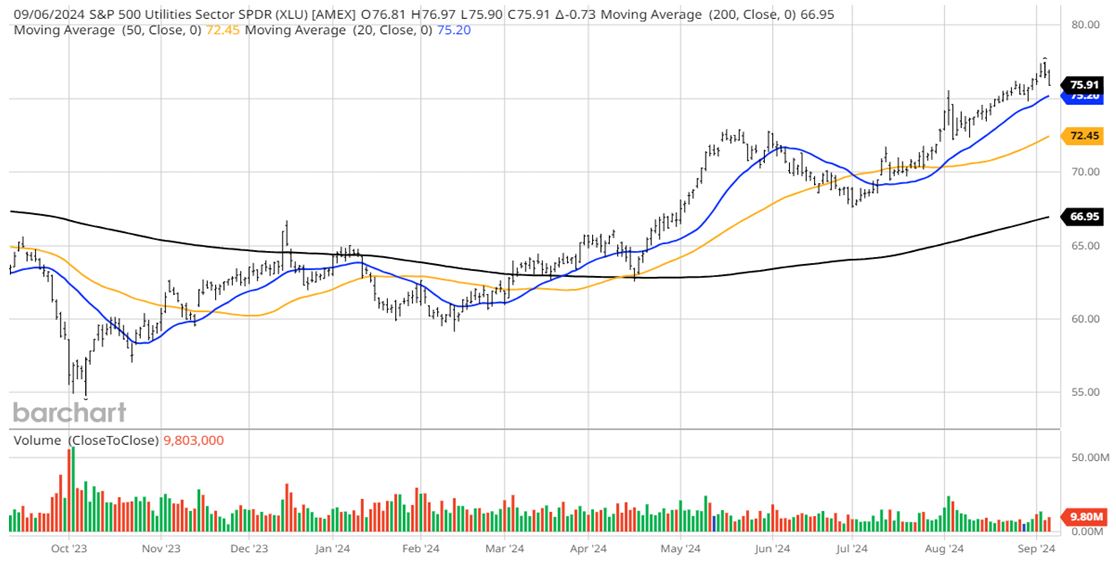
Taking into account the historically tough market months of August through October, it makes sense that investors are hunkering down somewhat in defensive areas of the market. Sector rotation has been swift, with technology, consumer discretion, energy, industrials, transportation, travel/leisure, and materials all experiencing selling pressure, as consumer staples, utilities, healthcare, and real estate enjoy strong fund flows. Amid the volatility and multiple-hundred-point swings in the Dow and 2%-3% daily moves in the S&P 500 and NASDAQ, there are some very bullish charts at work – namely the four sectors noted above:
Recent Buying in Consumer Staples… Utilities …. Health Care … and Real Estate (below)
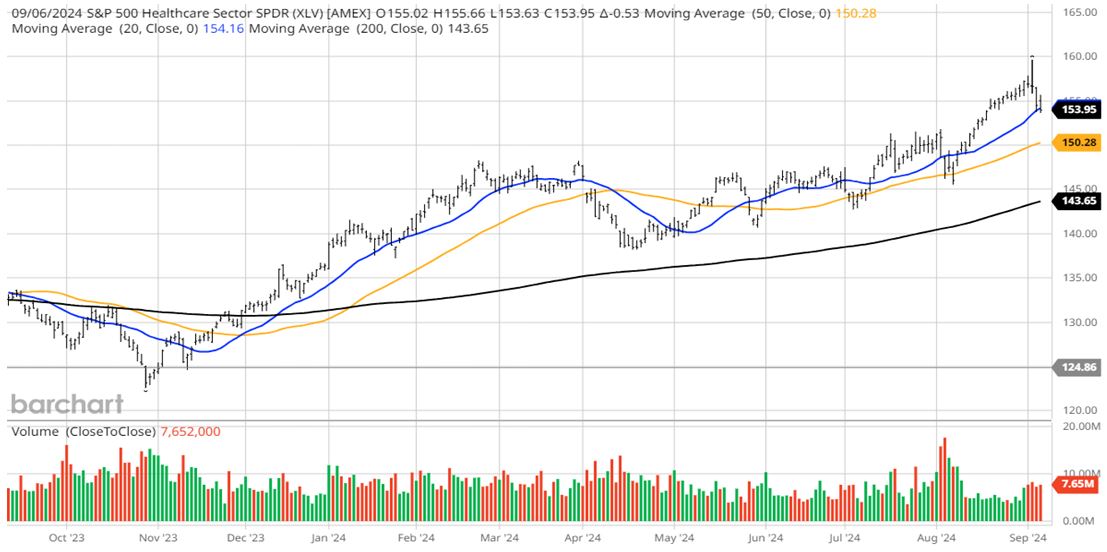
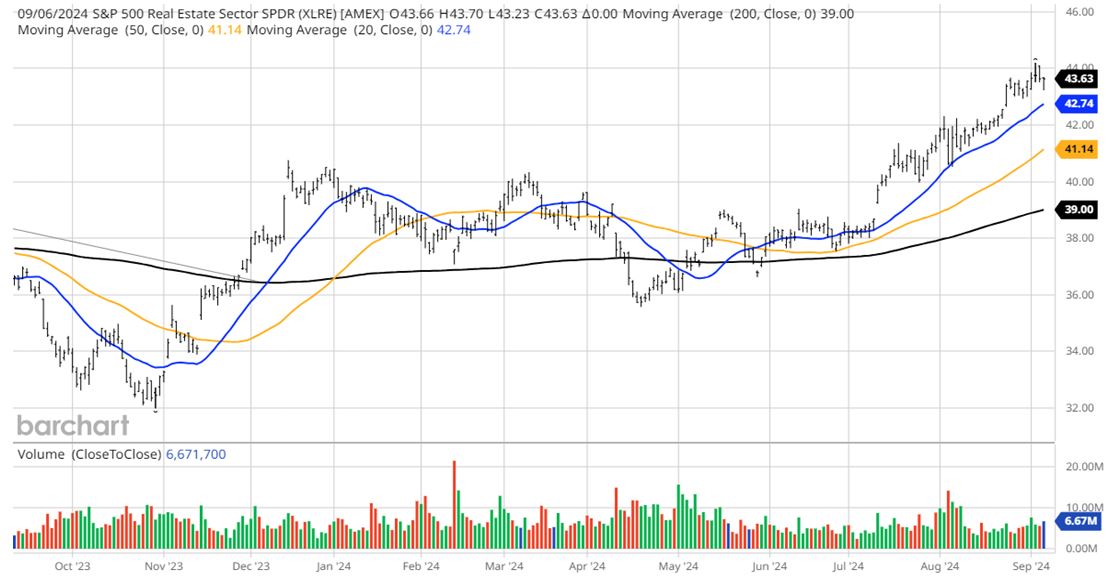
Graphs are for illustrative and discussion purposes only. Please read important disclosures at the end of this commentary.
At this juncture, the bond futures market is forecasting a full point of cuts by year-end from the three scheduled FOMC meetings (September 18, November 7, and December 18). Oddly enough, the CME Fed Watch Tool shows the half-point cut coming at the final (December) meeting. Why not pull the half-point cut forward to next week and shore employer confidence? The Fed has a dual mandate – low inflation and full employment. The Fed already botched inflation and had to spend 18 months getting back control over soaring prices. Now is not the time to lose control of their other mandate – seeking full employment.
All content above represents the opinion of Bryan Perry of Navellier & Associates, Inc.
Also In This Issue
A Look Ahead by Louis Navellier
Another Downbeat Jobs Report – Plus More Downward Revisions
Income Mail by Bryan Perry
A “Compression Cycle” Hits the Market on Weaker Labor Data
Growth Mail by Gary Alexander
“SEPTOBER” in Market History – Especially in Election Years
Global Mail by Ivan Martchev
This is Just Normal Seasonal Jitters
Sector Spotlight by Jason Bodner
If Given a Choice, Would You Cancel August – or September?
View Full Archive
Read Past Issues Here

Bryan Perry
SENIOR DIRECTOR
Bryan Perry is a Senior Director with Navellier Private Client Group, advising and facilitating high net worth investors in the pursuit of their financial goals.
Bryan’s financial services career spanning the past three decades includes over 20-years of wealth management experience with Wall Street firms that include Bear Stearns, Lehman Brothers and Paine Webber, working with both retail and institutional clients. Bryan earned a B.A. in Political Science from Virginia Polytechnic Institute & State University and currently holds a Series 65 license. All content of “Income Mail” represents the opinion of Bryan Perry
Important Disclosures:
Although information in these reports has been obtained from and is based upon sources that Navellier believes to be reliable, Navellier does not guarantee its accuracy and it may be incomplete or condensed. All opinions and estimates constitute Navellier’s judgment as of the date the report was created and are subject to change without notice. These reports are for informational purposes only and are not a solicitation for the purchase or sale of a security. Any decision to purchase securities mentioned in these reports must take into account existing public information on such securities or any registered prospectus.To the extent permitted by law, neither Navellier & Associates, Inc., nor any of its affiliates, agents, or service providers assumes any liability or responsibility nor owes any duty of care for any consequences of any person acting or refraining to act in reliance on the information contained in this communication or for any decision based on it.
Past performance is no indication of future results. Investment in securities involves significant risk and has the potential for partial or complete loss of funds invested. It should not be assumed that any securities recommendations made by Navellier. in the future will be profitable or equal the performance of securities made in this report. Dividend payments are not guaranteed. The amount of a dividend payment, if any, can vary over time and issuers may reduce dividends paid on securities in the event of a recession or adverse event affecting a specific industry or issuer.
None of the stock information, data, and company information presented herein constitutes a recommendation by Navellier or a solicitation to buy or sell any securities. Any specific securities identified and described do not represent all of the securities purchased, sold, or recommended for advisory clients. The holdings identified do not represent all of the securities purchased, sold, or recommended for advisory clients and the reader should not assume that investments in the securities identified and discussed were or will be profitable.
Information presented is general information that does not take into account your individual circumstances, financial situation, or needs, nor does it present a personalized recommendation to you. Individual stocks presented may not be suitable for every investor. Investment in securities involves significant risk and has the potential for partial or complete loss of funds invested. Investment in fixed income securities has the potential for the investment return and principal value of an investment to fluctuate so that an investor’s holdings, when redeemed, may be worth less than their original cost.
One cannot invest directly in an index. Index is unmanaged and index performance does not reflect deduction of fees, expenses, or taxes. Presentation of Index data does not reflect a belief by Navellier that any stock index constitutes an investment alternative to any Navellier equity strategy or is necessarily comparable to such strategies. Among the most important differences between the Indices and Navellier strategies are that the Navellier equity strategies may (1) incur material management fees, (2) concentrate its investments in relatively few stocks, industries, or sectors, (3) have significantly greater trading activity and related costs, and (4) be significantly more or less volatile than the Indices.
ETF Risk: We may invest in exchange traded funds (“ETFs”) and some of our investment strategies are generally fully invested in ETFs. Like traditional mutual funds, ETFs charge asset-based fees, but they generally do not charge initial sales charges or redemption fees and investors typically pay only customary brokerage fees to buy and sell ETF shares. The fees and costs charged by ETFs held in client accounts will not be deducted from the compensation the client pays Navellier. ETF prices can fluctuate up or down, and a client account could lose money investing in an ETF if the prices of the securities owned by the ETF go down. ETFs are subject to additional risks:
- ETF shares may trade above or below their net asset value;
- An active trading market for an ETF’s shares may not develop or be maintained;
- The value of an ETF may be more volatile than the underlying portfolio of securities the ETF is designed to track;
- The cost of owning shares of the ETF may exceed those a client would incur by directly investing in the underlying securities; and
- Trading of an ETF’s shares may be halted if the listing exchange’s officials deem it appropriate, the shares are delisted from the exchange, or the activation of market-wide “circuit breakers” (which are tied to large decreases in stock prices) halts stock trading generally.
Grader Disclosures: Investment in equity strategies involves substantial risk and has the potential for partial or complete loss of funds invested. The sample portfolio and any accompanying charts are for informational purposes only and are not to be construed as a solicitation to buy or sell any financial instrument and should not be relied upon as the sole factor in an investment making decision. As a matter of normal and important disclosures to you, as a potential investor, please consider the following: The performance presented is not based on any actual securities trading, portfolio, or accounts, and the reported performance of the A, B, C, D, and F portfolios (collectively the “model portfolios”) should be considered mere “paper” or pro forma performance results based on Navellier’s research.
Investors evaluating any of Navellier & Associates, Inc.’s, (or its affiliates’) Investment Products must not use any information presented here, including the performance figures of the model portfolios, in their evaluation of any Navellier Investment Products. Navellier Investment Products include the firm’s mutual funds and managed accounts. The model portfolios, charts, and other information presented do not represent actual funded trades and are not actual funded portfolios. There are material differences between Navellier Investment Products’ portfolios and the model portfolios, research, and performance figures presented here. The model portfolios and the research results (1) may contain stocks or ETFs that are illiquid and difficult to trade; (2) may contain stock or ETF holdings materially different from actual funded Navellier Investment Product portfolios; (3) include the reinvestment of all dividends and other earnings, estimated trading costs, commissions, or management fees; and, (4) may not reflect prices obtained in an actual funded Navellier Investment Product portfolio. For these and other reasons, the reported performances of model portfolios do not reflect the performance results of Navellier’s actually funded and traded Investment Products. In most cases, Navellier’s Investment Products have materially lower performance results than the performances of the model portfolios presented.
This report contains statements that are, or may be considered to be, forward-looking statements. All statements that are not historical facts, including statements about our beliefs or expectations, are “forward-looking statements” within the meaning of The U.S. Private Securities Litigation Reform Act of 1995. These statements may be identified by such forward-looking terminology as “expect,” “estimate,” “plan,” “intend,” “believe,” “anticipate,” “may,” “will,” “should,” “could,” “continue,” “project,” or similar statements or variations of such terms. Our forward-looking statements are based on a series of expectations, assumptions, and projections, are not guarantees of future results or performance, and involve substantial risks and uncertainty as described in Form ADV Part 2A of our filing with the Securities and Exchange Commission (SEC), which is available at www.adviserinfo.sec.gov or by requesting a copy by emailing info@navellier.com. All of our forward-looking statements are as of the date of this report only. We can give no assurance that such expectations or forward-looking statements will prove to be correct. Actual results may differ materially. You are urged to carefully consider all such factors.
FEDERAL TAX ADVICE DISCLAIMER: As required by U.S. Treasury Regulations, you are informed that, to the extent this presentation includes any federal tax advice, the presentation is not written by Navellier to be used, and cannot be used, for the purpose of avoiding federal tax penalties. Navellier does not advise on any income tax requirements or issues. Use of any information presented by Navellier is for general information only and does not represent tax advice either express or implied. You are encouraged to seek professional tax advice for income tax questions and assistance.
IMPORTANT NEWSLETTER DISCLOSURE:The hypothetical performance results for investment newsletters that are authored or edited by Louis Navellier, including Louis Navellier’s Growth Investor, Louis Navellier’s Breakthrough Stocks, Louis Navellier’s Accelerated Profits, and Louis Navellier’s Platinum Club, are not based on any actual securities trading, portfolio, or accounts, and the newsletters’ reported hypothetical performances should be considered mere “paper” or proforma hypothetical performance results and are not actual performance of real world trades. Navellier & Associates, Inc. does not have any relation to or affiliation with the owner of these newsletters. There are material differences between Navellier Investment Products’ portfolios and the InvestorPlace Media, LLC newsletter portfolios authored by Louis Navellier. The InvestorPlace Media, LLC newsletters contain hypothetical performance that do not include transaction costs, advisory fees, or other fees a client might incur if actual investments and trades were being made by an investor. As a result, newsletter performance should not be used to evaluate Navellier Investment services which are separate and different from the newsletters. The owner of the newsletters is InvestorPlace Media, LLC and any questions concerning the newsletters, including any newsletter advertising or hypothetical Newsletter performance claims, (which are calculated solely by Investor Place Media and not Navellier) should be referred to InvestorPlace Media, LLC at (800) 718-8289.
Please note that Navellier & Associates and the Navellier Private Client Group are managed completely independent of the newsletters owned and published by InvestorPlace Media, LLC and written and edited by Louis Navellier, and investment performance of the newsletters should in no way be considered indicative of potential future investment performance for any Navellier & Associates separately managed account portfolio. Potential investors should consult with their financial advisor before investing in any Navellier Investment Product.
Navellier claims compliance with Global Investment Performance Standards (GIPS). To receive a complete list and descriptions of Navellier’s composites and/or a presentation that adheres to the GIPS standards, please contact Navellier or click here. It should not be assumed that any securities recommendations made by Navellier & Associates, Inc. in the future will be profitable or equal the performance of securities made in this report.
FactSet Disclosure: Navellier does not independently calculate the statistical information included in the attached report. The calculation and the information are provided by FactSet, a company not related to Navellier. Although information contained in the report has been obtained from FactSet and is based on sources Navellier believes to be reliable, Navellier does not guarantee its accuracy, and it may be incomplete or condensed. The report and the related FactSet sourced information are provided on an “as is” basis. The user assumes the entire risk of any use made of this information. Investors should consider the report as only a single factor in making their investment decision. The report is for informational purposes only and is not intended as an offer or solicitation for the purchase or sale of a security. FactSet sourced information is the exclusive property of FactSet. Without prior written permission of FactSet, this information may not be reproduced, disseminated or used to create any financial products. All indices are unmanaged and performance of the indices include reinvestment of dividends and interest income, unless otherwise noted, are not illustrative of any particular investment and an investment cannot be made in any index. Past performance is no guarantee of future results.