by Bryan Perry
August 6, 2024
Volatility spiked last week following a string of disappointing second-quarter results, the assassination of a Hamas leader in Tehran, dismal manufacturing data, and a jobs report that showed growth in the U.S. labor market slowing more than expected. The CBOE Volatility Index, also known also as “the fear index,” leaped to 29.70 during Friday’s session before backing off to close at 23.39. Such a parabolic move typically marks a selling climax, but it is by no means a guarantee of the end of selling.
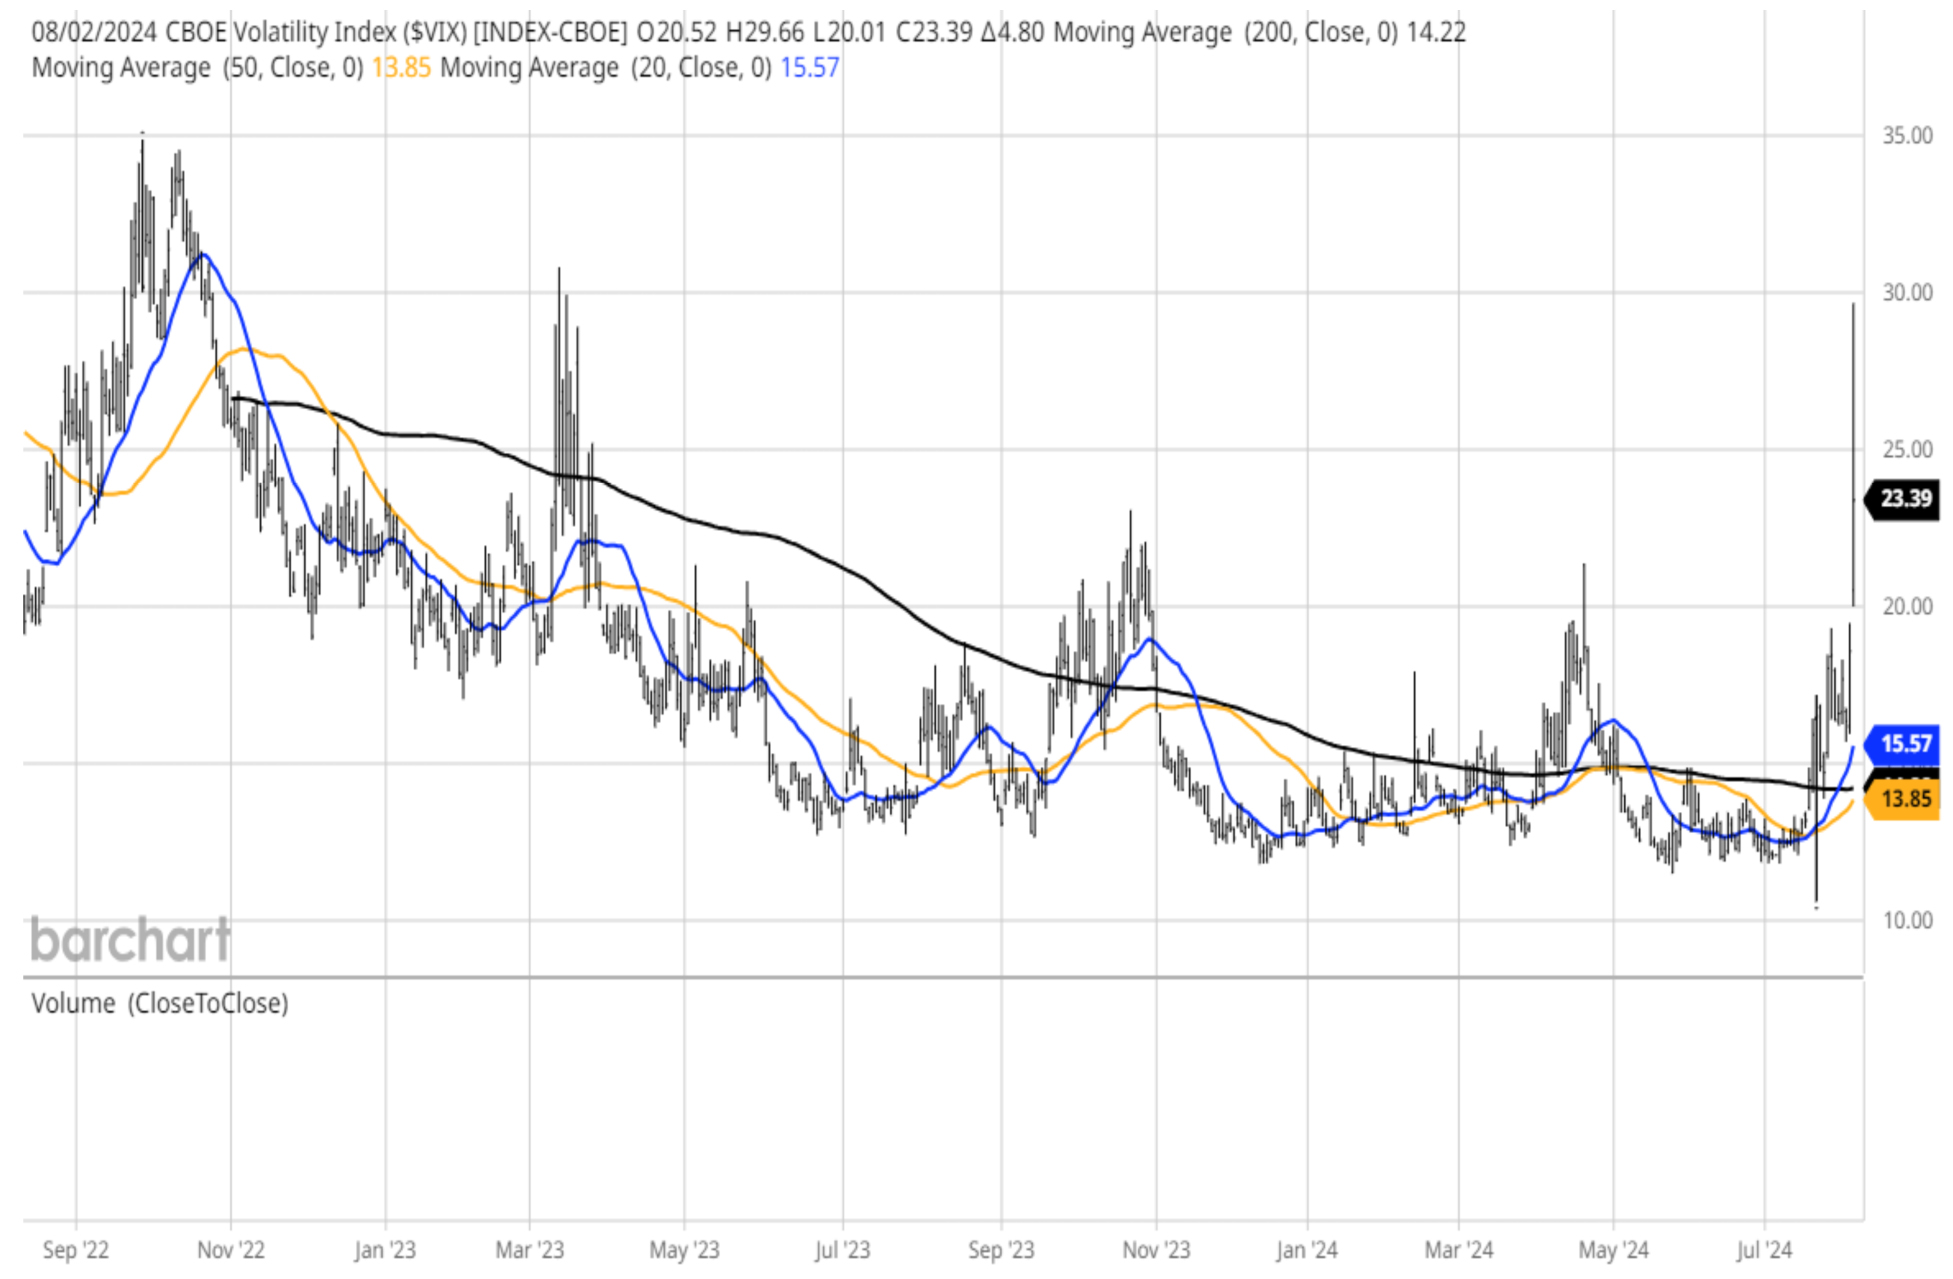
Graphs are for illustrative and discussion purposes only. Please read important disclosures at the end of this commentary.
Despite some not-so-magnificent Q2 results from the Mag-7 leaders, FactSet reports that 78% of S&P 500 companies have reported positive EPS surprises (with 75% of S&P 500 companies reporting actual results), and 59% of S&P 500 companies have reported a positive revenue surprise. For Q2 2024, the blended (year-over-year) earnings growth rate for the S&P 500 is 11.5%. If 11.5% is the ending growth rate for the quarter, it will mark the highest year-over-year earnings growth rate reported by the index since Q4 2021 (at 31.4%). As of the end of Q2 on June 30, the estimated (year-over-year) earnings growth rate for the S&P 500 for Q2 was only 8.9%. Nine of 11 sectors are reporting higher Q2 earnings (compared to Q1 June 30) due to upward revisions to EPS estimates and positive EPS earnings guidance.
Looking forward to Q3 2024, 39 S&P 500 companies have issued negative EPS guidance while only 35 S&P companies have issued positive EPS guidance. The key takeaway from this set of quarterly stats is that the negative reaction to big-cap technology, with the bar set so high, and the big miss on the jobs report, are over-shadowing what is otherwise a pretty impressive performance by the broader S&P 500.
The S&P Equal Weight ETF (RSP) shows a much more constrictive pattern than the SPDR S&P 500 ETF (SPY), where eight of the top 10 holdings are mega-technology and account for roughly 36% of total assets:
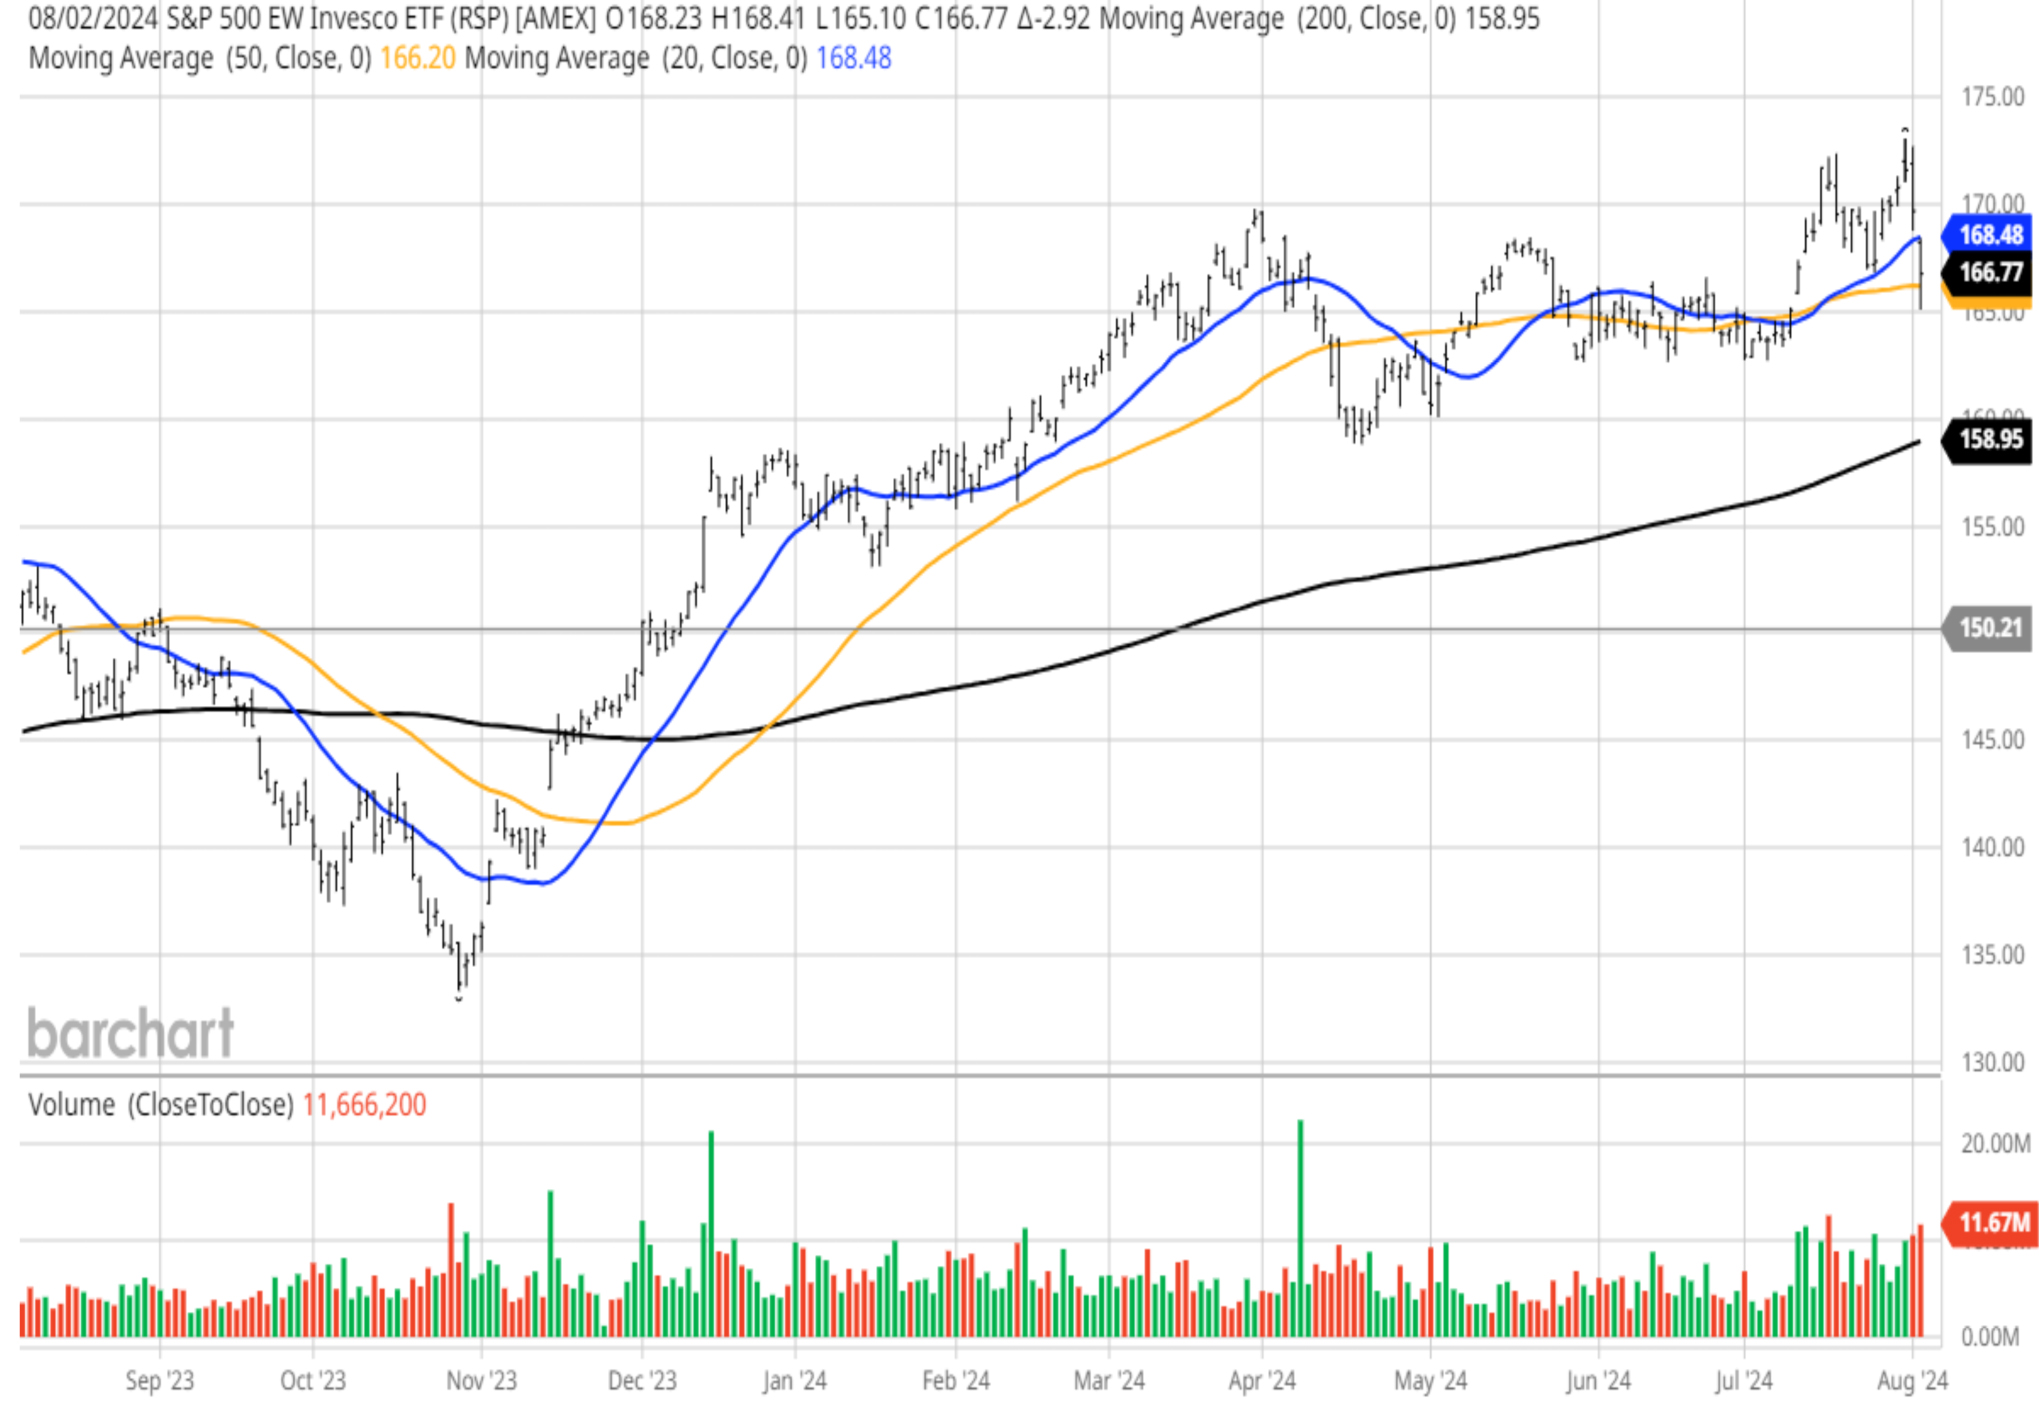
Graphs are for illustrative and discussion purposes only. Please read important disclosures at the end of this commentary.
Commodity prices were a big part of the rise in inflation, but they have made a material move lower in the past two months. The CRB Index, which tracks the overall movement of commodities, is in a steep decline. It consists of 19 different commodities, grouped into energy (39%), base/industrial metals (13%), agricultural products (41%) and precious metals (7%), boosted only by recent record highs in gold.
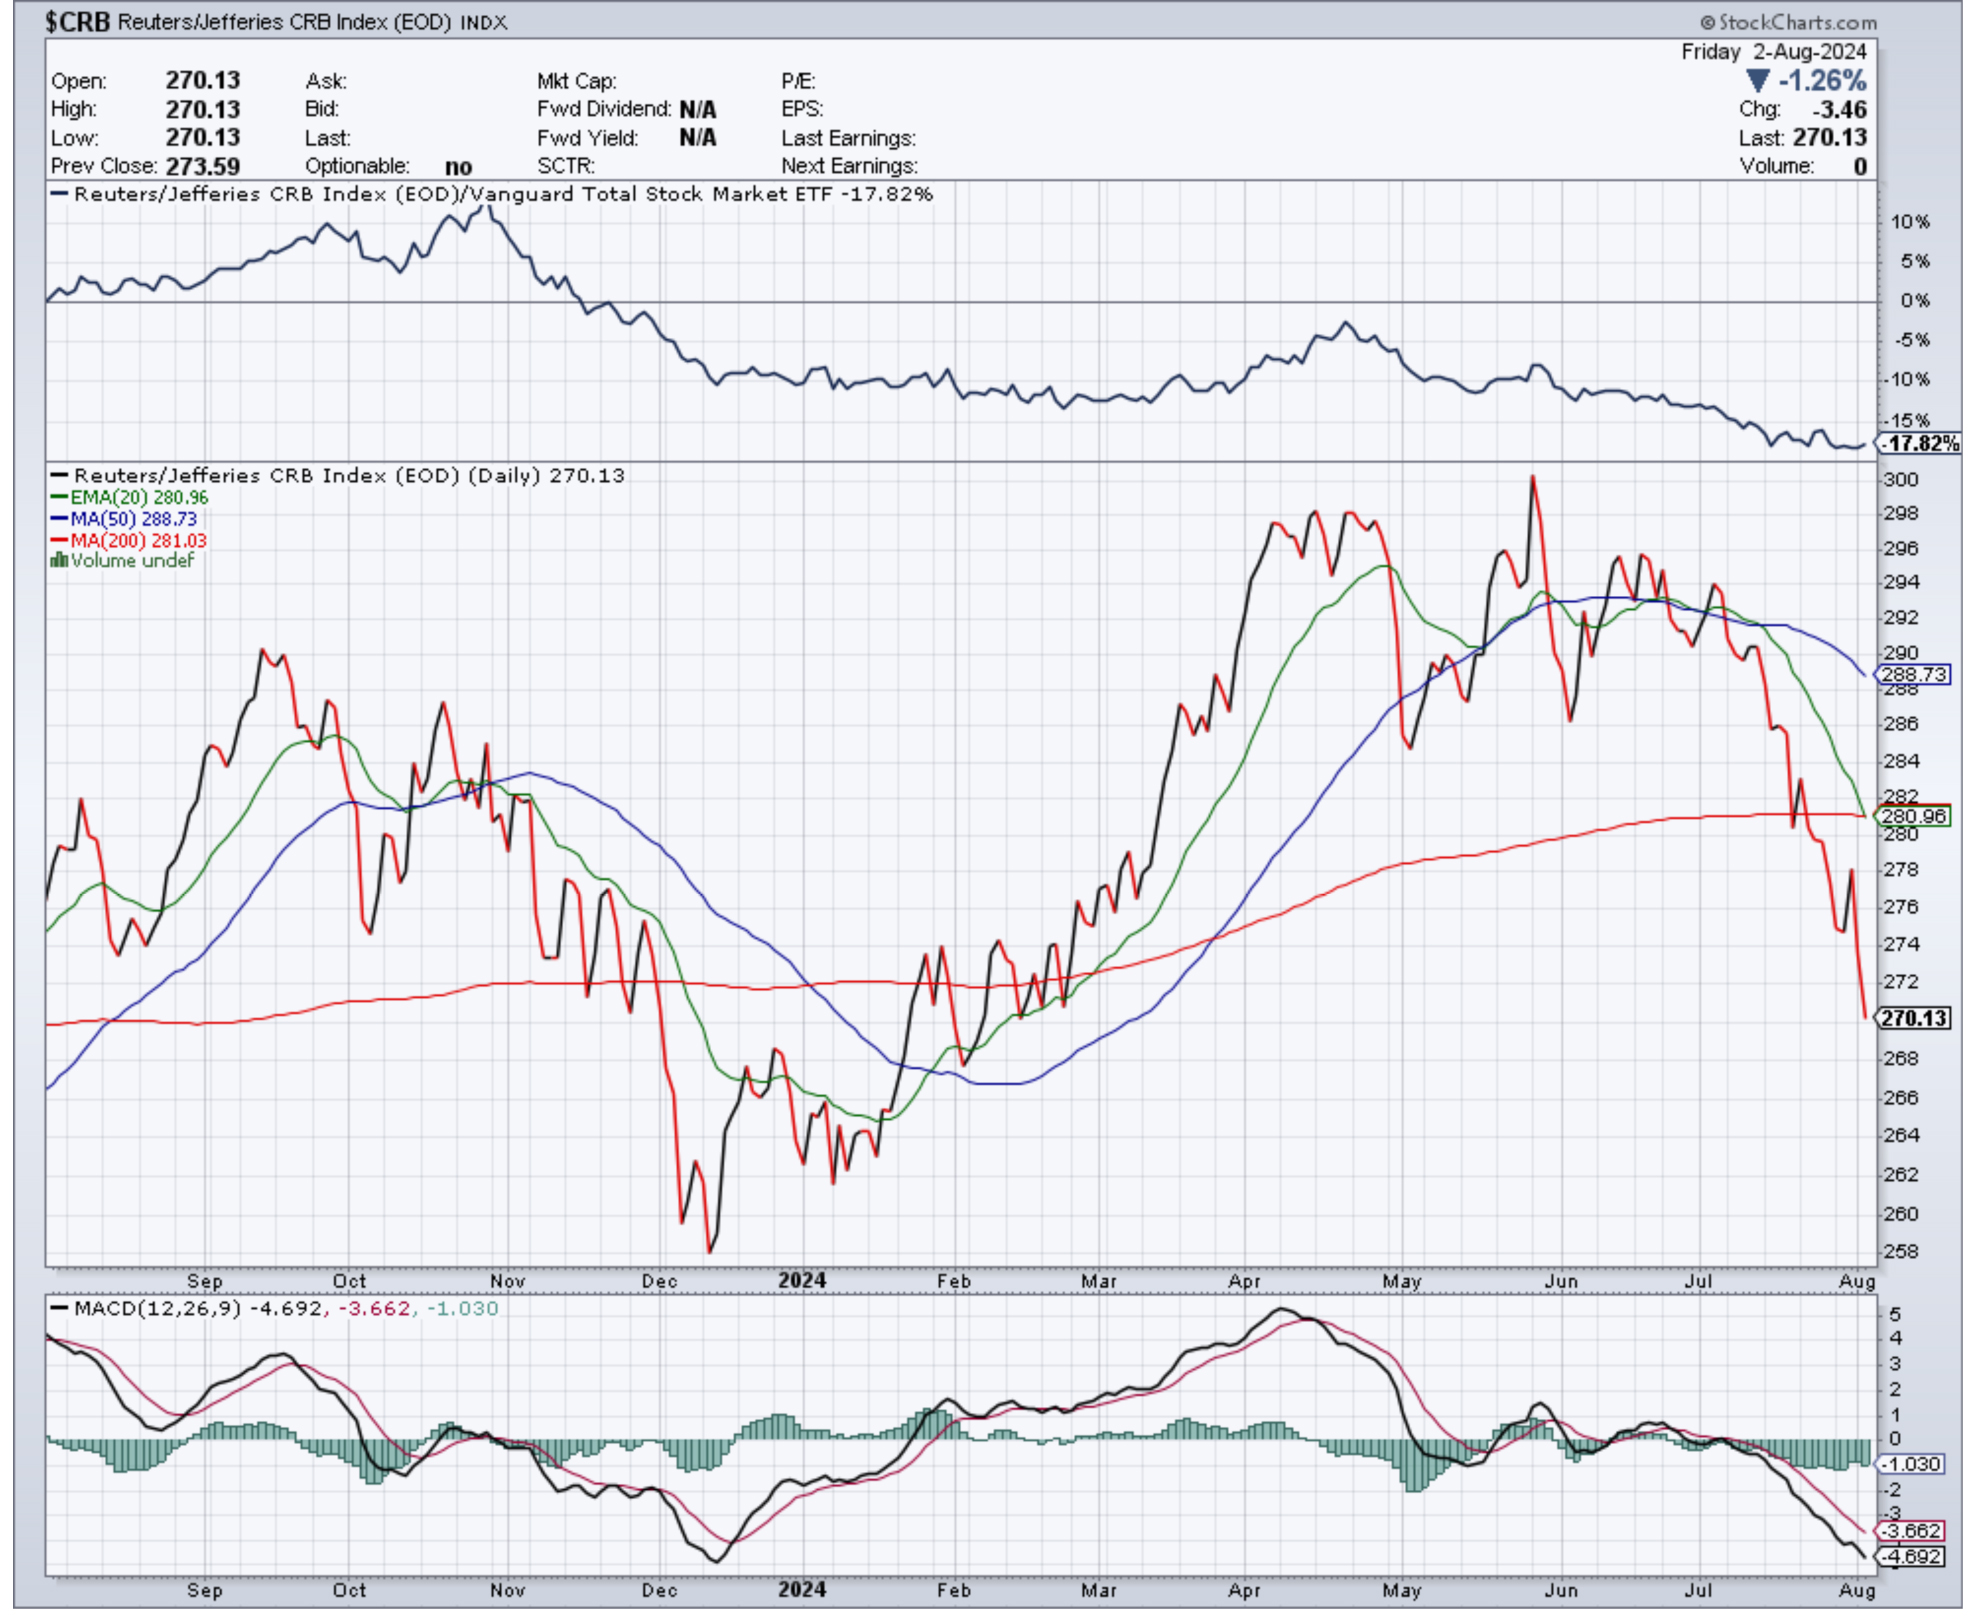
Graphs are for illustrative and discussion purposes only. Please read important disclosures at the end of this commentary.
Rates on 10-year government bonds have declined sharply in the past month, sending a clear signal to global fixed income markets that when the U.S., which accounts for 26% of the global economy, sees a cooling of its labor markets, it is incumbent upon the Federal Reserve – the world’s top central bank – to respond swiftly. Markets are roiled because of a growing concern the Fed is once again behind the curve.
Here is the downward trend of benchmark 10-year-yields in most developed economies, worldwide:
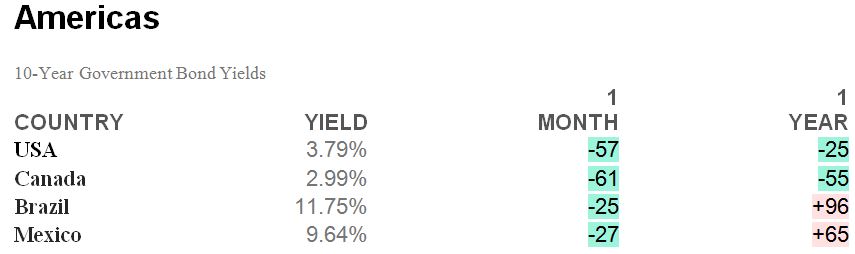
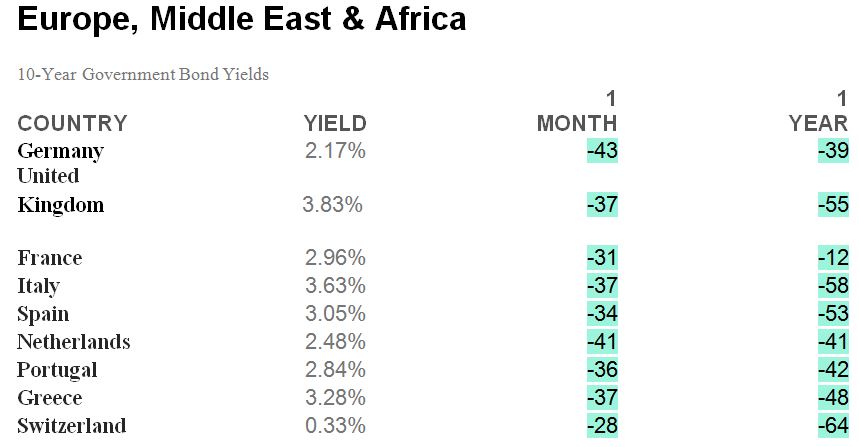
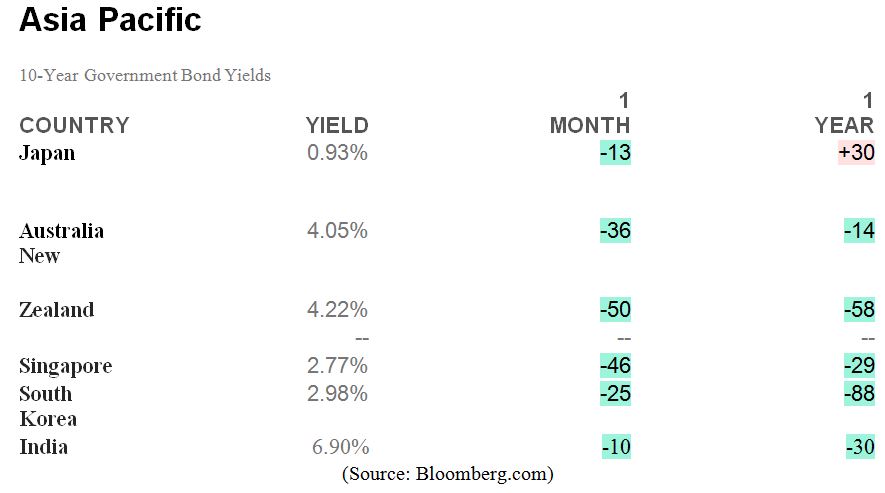
Graphs are for illustrative and discussion purposes only. Please read important disclosures at the end of this commentary.
The Fed failed to manage inflation in a timely manner, so the U.S. economy and consumers are suffering from their delayed reaction, and the decision to hold the Fed funds rate at 5.25%-5.50% last week – by a unanimous decision – was clearly wrong in the eyes of the fixed income market, as well as the equity markets. The latest read from the bond futures market is clearly a call for a 50-basis point cut in September, a 50-basis point cut in November and a 25-basis point cut in December. This past weekend, JPMorgan Chase & Co. also predicted half-point rate cuts in both September and November.
The markets are reacting not just to one soft jobs report, manufacturing in the U.S. has been on a steady decline for almost two years. The July ISM Manufacturing Index checked in at 46.8 versus 48.5 in June. The dividing line between expansion and contraction is 50, so the July reading suggests that there was a faster pace of contraction in the manufacturing sector last month. This was the fourth straight month (and 20th out of the last 21 months) that economic activity in the manufacturing sector contracted. This conveys clear weakness in the manufacturing sector that is a byproduct of subdued demand.
Fed Chair Jerome Powell noted in his post FOMC presser that incoming data would set the stage for upcoming rate cuts. Between now and the next Fed gathering on September 18, markets will digest a litany of data that may or may not corroborate the weaker employment data. Based on the falling prices of energy and commodities, the risk of sticking a soft landing is questionable if the Fed waits too long.
A JPMorgan economist said that there is even an argument to be made for an unscheduled cut, saying, “With the benefit of hindsight, it’s easy to say the Fed should have cut this week.” Michael Feroli, Chief U.S. economist at JPMorgan, in a note last Friday, continued: “It’s also easy to say they will cut soon. How soon and how much are harder questions.” Even if the weakness in the job market levels off later, the Fed would still appear to be “offsides,” he said, by 100 basis points or more, adding, “From a risk management perspective, we think there’s a strong case to act before September 18th” Feroli concluded.
There is clearly disinflation at work and the Fed should respond sooner rather than later. It would not be the first time the Fed has cut rates between meetings, and the market would find it prudent if they did call for an immediate response to the newfound data that points to some potential contraction in the labor market. (The Fed’s dual mandate is to control inflation and maintain stable and healthy labor markets).
The fight on inflation is being won, and the pace of hiring is slowing, so why wait? The bond market is calling loudly for action, not in late September, but now. I’m sure Fed Chair Jerome Powell and his 11 other voting members that make up the FOMC committee are taking serious notice of the bond market’s reaction, and hopefully they are on a Zoom call with the intention of getting in front of a potential economic slowdown, so that the path to a soft landing remains intact.
There is no loss of pride for doing the right thing after nothing was done at last week’s Fed gathering. The markets would cheer loudly, and the Fed would earn a gold medal.
All content above represents the opinion of Bryan Perry of Navellier & Associates, Inc.
Also In This Issue
A Look Ahead by Louis Navellier
The Jobs Data is Weaker Than Expected
Income Mail by Bryan Perry
The Market Fears the Fed is Behind the Curve Again
Growth Mail by Gary Alexander
The Current Medal Count Between the Big 3 Economies
Global Mail by Ivan Martchev
The Bond Market is Already Cutting Rates for the Fed
Sector Spotlight by Jason Bodner
What Kind of Volatility to Expect, Especially in Election Years
View Full Archive
Read Past Issues Here

Bryan Perry
SENIOR DIRECTOR
Bryan Perry is a Senior Director with Navellier Private Client Group, advising and facilitating high net worth investors in the pursuit of their financial goals.
Bryan’s financial services career spanning the past three decades includes over 20 years of wealth management experience with Wall Street firms that include Bear Stearns, Lehman Brothers and Paine Webber, working with both retail and institutional clients. Bryan earned a B.A. in Political Science from Virginia Polytechnic Institute & State University and currently holds a Series 65 license. All content of “Income Mail” represents the opinion of Bryan Perry
Important Disclosures:
Although information in these reports has been obtained from and is based upon sources that Navellier believes to be reliable, Navellier does not guarantee its accuracy and it may be incomplete or condensed. All opinions and estimates constitute Navellier’s judgment as of the date the report was created and are subject to change without notice. These reports are for informational purposes only and are not a solicitation for the purchase or sale of a security. Any decision to purchase securities mentioned in these reports must take into account existing public information on such securities or any registered prospectus.To the extent permitted by law, neither Navellier & Associates, Inc., nor any of its affiliates, agents, or service providers assumes any liability or responsibility nor owes any duty of care for any consequences of any person acting or refraining to act in reliance on the information contained in this communication or for any decision based on it.
Past performance is no indication of future results. Investment in securities involves significant risk and has the potential for partial or complete loss of funds invested. It should not be assumed that any securities recommendations made by Navellier. in the future will be profitable or equal the performance of securities made in this report. Dividend payments are not guaranteed. The amount of a dividend payment, if any, can vary over time and issuers may reduce dividends paid on securities in the event of a recession or adverse event affecting a specific industry or issuer.
None of the stock information, data, and company information presented herein constitutes a recommendation by Navellier or a solicitation to buy or sell any securities. Any specific securities identified and described do not represent all of the securities purchased, sold, or recommended for advisory clients. The holdings identified do not represent all of the securities purchased, sold, or recommended for advisory clients and the reader should not assume that investments in the securities identified and discussed were or will be profitable.
Information presented is general information that does not take into account your individual circumstances, financial situation, or needs, nor does it present a personalized recommendation to you. Individual stocks presented may not be suitable for every investor. Investment in securities involves significant risk and has the potential for partial or complete loss of funds invested. Investment in fixed income securities has the potential for the investment return and principal value of an investment to fluctuate so that an investor’s holdings, when redeemed, may be worth less than their original cost.
One cannot invest directly in an index. Index is unmanaged and index performance does not reflect deduction of fees, expenses, or taxes. Presentation of Index data does not reflect a belief by Navellier that any stock index constitutes an investment alternative to any Navellier equity strategy or is necessarily comparable to such strategies. Among the most important differences between the Indices and Navellier strategies are that the Navellier equity strategies may (1) incur material management fees, (2) concentrate its investments in relatively few stocks, industries, or sectors, (3) have significantly greater trading activity and related costs, and (4) be significantly more or less volatile than the Indices.
ETF Risk: We may invest in exchange traded funds (“ETFs”) and some of our investment strategies are generally fully invested in ETFs. Like traditional mutual funds, ETFs charge asset-based fees, but they generally do not charge initial sales charges or redemption fees and investors typically pay only customary brokerage fees to buy and sell ETF shares. The fees and costs charged by ETFs held in client accounts will not be deducted from the compensation the client pays Navellier. ETF prices can fluctuate up or down, and a client account could lose money investing in an ETF if the prices of the securities owned by the ETF go down. ETFs are subject to additional risks:
- ETF shares may trade above or below their net asset value;
- An active trading market for an ETF’s shares may not develop or be maintained;
- The value of an ETF may be more volatile than the underlying portfolio of securities the ETF is designed to track;
- The cost of owning shares of the ETF may exceed those a client would incur by directly investing in the underlying securities; and
- Trading of an ETF’s shares may be halted if the listing exchange’s officials deem it appropriate, the shares are delisted from the exchange, or the activation of market-wide “circuit breakers” (which are tied to large decreases in stock prices) halts stock trading generally.
Grader Disclosures: Investment in equity strategies involves substantial risk and has the potential for partial or complete loss of funds invested. The sample portfolio and any accompanying charts are for informational purposes only and are not to be construed as a solicitation to buy or sell any financial instrument and should not be relied upon as the sole factor in an investment making decision. As a matter of normal and important disclosures to you, as a potential investor, please consider the following: The performance presented is not based on any actual securities trading, portfolio, or accounts, and the reported performance of the A, B, C, D, and F portfolios (collectively the “model portfolios”) should be considered mere “paper” or pro forma performance results based on Navellier’s research.
Investors evaluating any of Navellier & Associates, Inc.’s, (or its affiliates’) Investment Products must not use any information presented here, including the performance figures of the model portfolios, in their evaluation of any Navellier Investment Products. Navellier Investment Products include the firm’s mutual funds and managed accounts. The model portfolios, charts, and other information presented do not represent actual funded trades and are not actual funded portfolios. There are material differences between Navellier Investment Products’ portfolios and the model portfolios, research, and performance figures presented here. The model portfolios and the research results (1) may contain stocks or ETFs that are illiquid and difficult to trade; (2) may contain stock or ETF holdings materially different from actual funded Navellier Investment Product portfolios; (3) include the reinvestment of all dividends and other earnings, estimated trading costs, commissions, or management fees; and, (4) may not reflect prices obtained in an actual funded Navellier Investment Product portfolio. For these and other reasons, the reported performances of model portfolios do not reflect the performance results of Navellier’s actually funded and traded Investment Products. In most cases, Navellier’s Investment Products have materially lower performance results than the performances of the model portfolios presented.
This report contains statements that are, or may be considered to be, forward-looking statements. All statements that are not historical facts, including statements about our beliefs or expectations, are “forward-looking statements” within the meaning of The U.S. Private Securities Litigation Reform Act of 1995. These statements may be identified by such forward-looking terminology as “expect,” “estimate,” “plan,” “intend,” “believe,” “anticipate,” “may,” “will,” “should,” “could,” “continue,” “project,” or similar statements or variations of such terms. Our forward-looking statements are based on a series of expectations, assumptions, and projections, are not guarantees of future results or performance, and involve substantial risks and uncertainty as described in Form ADV Part 2A of our filing with the Securities and Exchange Commission (SEC), which is available at www.adviserinfo.sec.gov or by requesting a copy by emailing info@navellier.com. All of our forward-looking statements are as of the date of this report only. We can give no assurance that such expectations or forward-looking statements will prove to be correct. Actual results may differ materially. You are urged to carefully consider all such factors.
FEDERAL TAX ADVICE DISCLAIMER: As required by U.S. Treasury Regulations, you are informed that, to the extent this presentation includes any federal tax advice, the presentation is not written by Navellier to be used, and cannot be used, for the purpose of avoiding federal tax penalties. Navellier does not advise on any income tax requirements or issues. Use of any information presented by Navellier is for general information only and does not represent tax advice either express or implied. You are encouraged to seek professional tax advice for income tax questions and assistance.
IMPORTANT NEWSLETTER DISCLOSURE:The hypothetical performance results for investment newsletters that are authored or edited by Louis Navellier, including Louis Navellier’s Growth Investor, Louis Navellier’s Breakthrough Stocks, Louis Navellier’s Accelerated Profits, and Louis Navellier’s Platinum Club, are not based on any actual securities trading, portfolio, or accounts, and the newsletters’ reported hypothetical performances should be considered mere “paper” or proforma hypothetical performance results and are not actual performance of real world trades. Navellier & Associates, Inc. does not have any relation to or affiliation with the owner of these newsletters. There are material differences between Navellier Investment Products’ portfolios and the InvestorPlace Media, LLC newsletter portfolios authored by Louis Navellier. The InvestorPlace Media, LLC newsletters contain hypothetical performance that do not include transaction costs, advisory fees, or other fees a client might incur if actual investments and trades were being made by an investor. As a result, newsletter performance should not be used to evaluate Navellier Investment services which are separate and different from the newsletters. The owner of the newsletters is InvestorPlace Media, LLC and any questions concerning the newsletters, including any newsletter advertising or hypothetical Newsletter performance claims, (which are calculated solely by Investor Place Media and not Navellier) should be referred to InvestorPlace Media, LLC at (800) 718-8289.
Please note that Navellier & Associates and the Navellier Private Client Group are managed completely independent of the newsletters owned and published by InvestorPlace Media, LLC and written and edited by Louis Navellier, and investment performance of the newsletters should in no way be considered indicative of potential future investment performance for any Navellier & Associates separately managed account portfolio. Potential investors should consult with their financial advisor before investing in any Navellier Investment Product.
Navellier claims compliance with Global Investment Performance Standards (GIPS). To receive a complete list and descriptions of Navellier’s composites and/or a presentation that adheres to the GIPS standards, please contact Navellier or click here. It should not be assumed that any securities recommendations made by Navellier & Associates, Inc. in the future will be profitable or equal the performance of securities made in this report.
FactSet Disclosure: Navellier does not independently calculate the statistical information included in the attached report. The calculation and the information are provided by FactSet, a company not related to Navellier. Although information contained in the report has been obtained from FactSet and is based on sources Navellier believes to be reliable, Navellier does not guarantee its accuracy, and it may be incomplete or condensed. The report and the related FactSet sourced information are provided on an “as is” basis. The user assumes the entire risk of any use made of this information. Investors should consider the report as only a single factor in making their investment decision. The report is for informational purposes only and is not intended as an offer or solicitation for the purchase or sale of a security. FactSet sourced information is the exclusive property of FactSet. Without prior written permission of FactSet, this information may not be reproduced, disseminated or used to create any financial products. All indices are unmanaged and performance of the indices include reinvestment of dividends and interest income, unless otherwise noted, are not illustrative of any particular investment and an investment cannot be made in any index. Past performance is no guarantee of future results.