by Gary Alexander
August 5, 2025
Last week, I wrote about the reasons why August went from being the best market month for nearly a century (1896 to 1986, in Dow terms) but then became the worst month over the last 40-years or so.
In this issue, I’d like to review four of the worst Augusts since 1990 to indicate what we MIGHT have to endure this month. Since this is the start of Hurricane Season, I’d like to name these August storms:
Four Sharp August Declines … And the Massive Bull Market Recoveries that Followed
| August | Market Hurricanes | Dow Jones | S&P 500 | NASDAQ | A Year Later (3 Indexes)* |
| 1990 | #1-Hurricane Saddam | -10.0% | -9.4% | -13.0% | +16.4%, +22.6%, +37.9% |
| 1998 | #2-Hurricane Ruble | -15.1% | -14.6% | -19.9% | +43.7%, +37.9%, +82.7% |
| 2011 | #3-Hurricane Debbie | -6.4% | -6.4% | -10.9% | +12.7%, +15.4%, +18.9% |
| 2015 | #4-Hurricane Flashdance | -6.6% | -6.3% | -6.9% | +11.7%, +10.1%, +9.1% |
| Data source: Almanac Investor, Yahoo Finance: | |||||
| * “Gains a Year Later” are measured from August 31 to the next August 31 in each of the three major indexes. | |||||
Don’t get me wrong. I wouldn’t sell stocks out of fear of a late-summer swoon (“Sell in July – and Wonder Why”), since about 59% of all Augusts rise, and markets tend to recover fast from any disaster by setting new highs in the fourth quarter in many years. Market timing seldom works, as the market seems to do whatever it takes to shake out the “weak hands” and reward those who realize the main market bias is UP.
Here are the four-worst Augusts since 1990 – and what happened next:
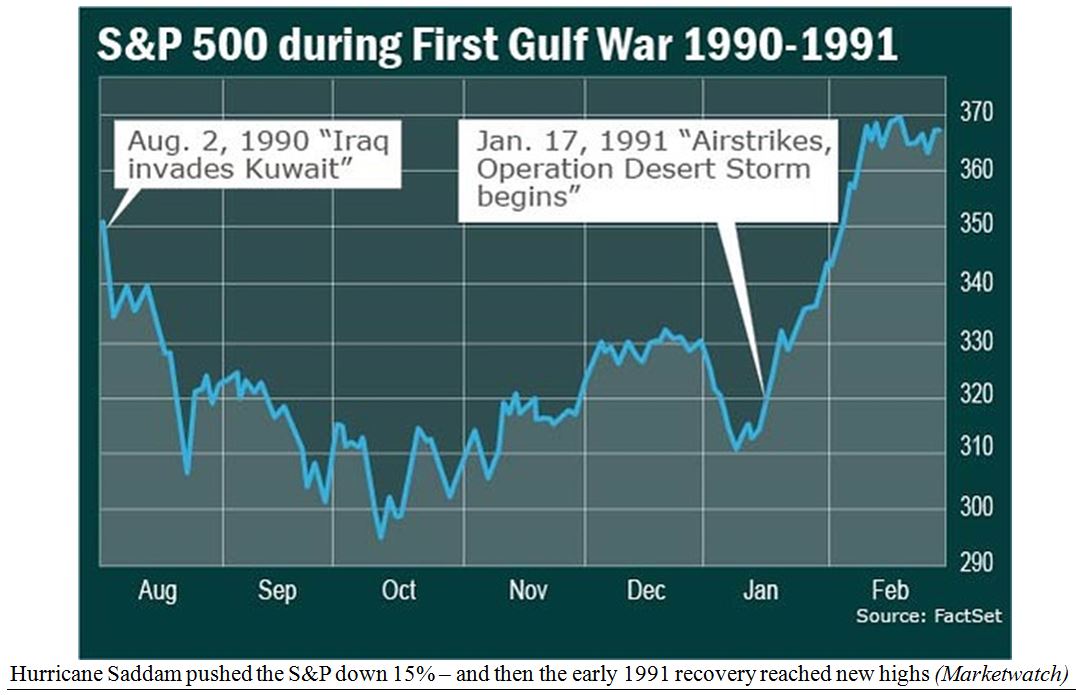
#1: Hurricane Saddam (August 1990) resulted from Saddam Hussein’s sudden surprise attack on Kuwait on Thursday, August 2, 1990. The Dow lost 35-points that day, then 55-points on Friday, and 93-points on Monday, August 6. In the first five-trading days of August 1990, the Dow fell 195-points (-6.7%).
Three-weeks after the attack (on August 23), the Dow was off almost 15% and the price of oil had doubled. from $20 to $40. (In others news on August 23, East and West Germany announced that they would unite).
The basic point to remember in all these stories is that markets recover. The pundits predicted that once the Western allies invaded Kuwait and Iraq, stocks would tank and gold would soar, and then the war might last up to a decade – like the recent 9-year Russian occupation of Afghanistan, or the 8-year Iraq-Iran war.
The opposite happened. The main Kuwait liberation of January 1991 lasted all of four-days, with another five-weeks for clean-up and decimation of Iraq’s defenses. After the battle began in mid-January 1991, the Dow shot up 16%, from 2500 to 2900, in just one-month, and by the first anniversary of Saddam’s invasion of Kuwait (on August 2, 1991), the Dow topped 3,000 for the first time in its then 95-year history.
Graphs are for illustrative and discussion purposes only. Please read important disclosures at the end of this commentary.
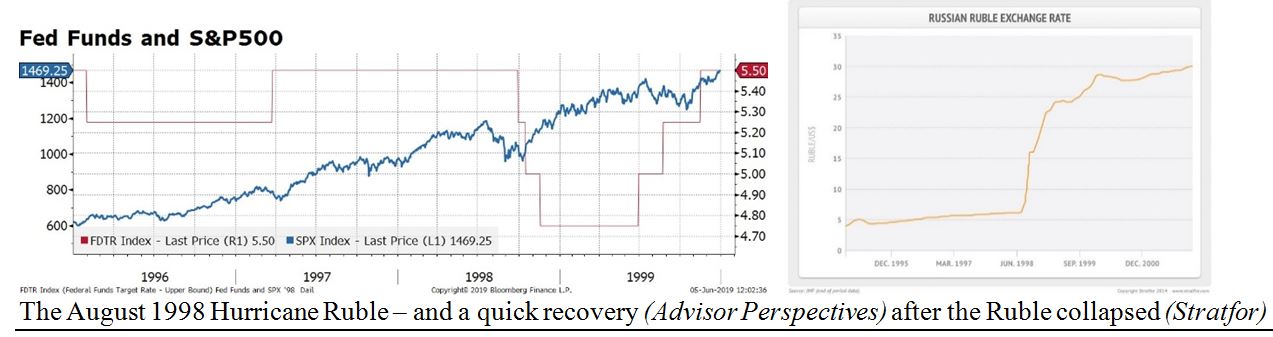
#2: Hurricane Ruble (August 1998): After a scary August 1997, at the start of the Asian Currency Crisis, the mother of all currency crises came in August 1998. Despite several currency crises in the 1990 (like the collapse of the British Pound in 1992, the Mexican Peso collapse in 1994 and the Asian currency crisis in 1997), some Nobel-Prize-winning market risk analysts at Long-Term Capital Management (LTCM) were totally surprised by the rapid fall of the Russian ruble. Since they used high leverage to trade “normal historical spreads,” they did not anticipate the wider-than-normal ruble collapse. In fact, they were so highly leveraged that they were about to collapse and bring Wall Street down with them, if not bailed out.
The crisis began on Tuesday, August 4, 1998, when the Dow fell nearly 300-points (299.43, to be exact) in the first of several scary days that August. By August 25, the Dow recovered to an interim peak of 8603, only to fall by over 1,000-points in the next four-trading sessions, down to 7,539 (down 12.4% in less than a week). For all of August 1998, the Dow fell by a then-record 1,344-points (-15.1%) from 8,883 to 7,539, the largest monthly point-drop in history, to that date, but exactly a year later (on August 31, 1999), the Dow was up 43.7%, the S&P 500 gained 38%, and the red-hot NASDAQ had risen 82.7% in 12-months.
Graphs are for illustrative and discussion purposes only. Please read important disclosures at the end of this commentary.
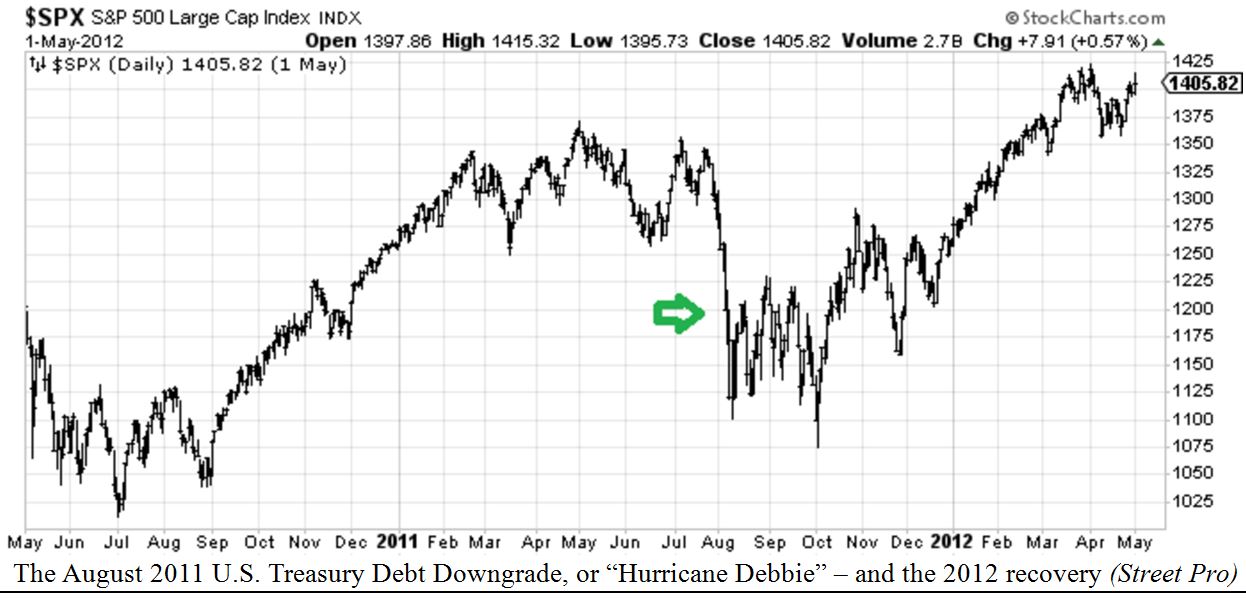
#3: Hurricane Debbie (August 2011) – my shorthand for the Debt Bomb Hurricane: In August 2011, the Dow and S&P 500 fell “only” 6.4%, but that number masks a horrid beginning – down 13% August 1-8 in the S&P 500, including a 6.7% drop on Monday August 8th and a 4.8% crash the previous Thursday.
In fact, August 8 (8-8) defied all the good omens for the number “8” (in China, at least) by becoming the new Black Monday on Wall Street, making investors forget that first Black Monday on October 19, 1987.
The cause of the decline was a massacre in U.S. bonds, due to a credit downgrade issued by Standard and Poor’s, which demoted U.S. sovereign debt from “AAA” (top-rated, or risk-free) to the next lower notch, AA+. This was the first time in U.S. history that U.S. Treasury debt was downgraded – it didn’t happen after the 1929 market crash or Great Depression, but over a kerfuffle in Congress regarding a debt ceiling!
On Black Monday, the Dow fell 5.55% and the S&P 500 fell an ominous 6.66%, while NASDAQ fell 6.9%, but a year later – measuring from the end of August – the Dow was up 12.7%, the S&P 500 rose 15.4%, and NASDAQ had risen 18.9%. In an opposite but nearly equal market move, gold rose 26% from $1,512 on July 5th to $1,912 September 5th. A year later, on September 5, 2012, gold had fallen to $1,691.
Graphs are for illustrative and discussion purposes only. Please read important disclosures at the end of this commentary.
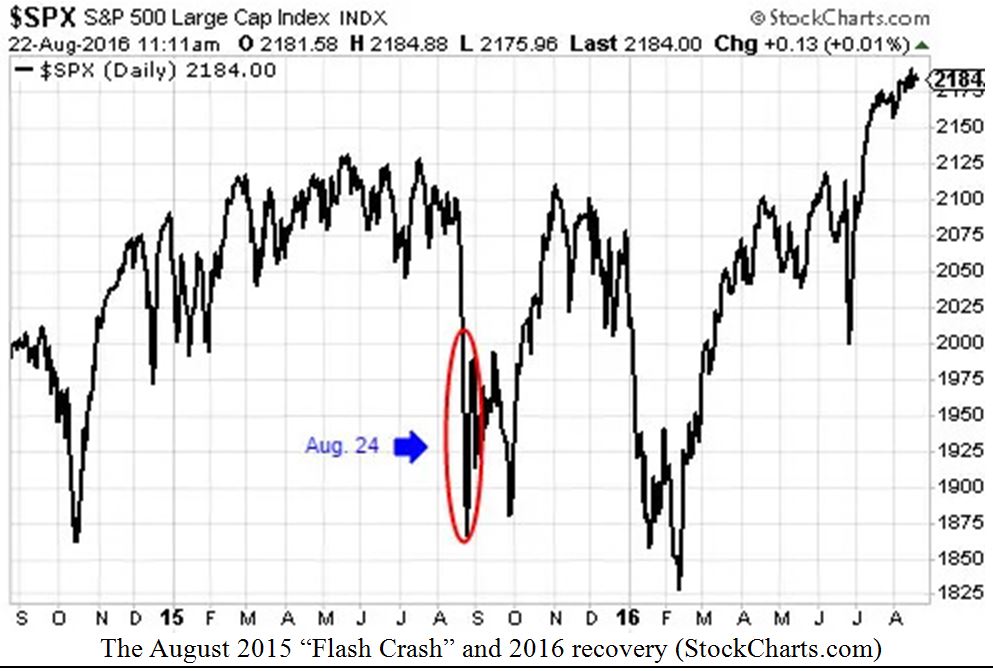
#4-Hurricane Flashdance (August 2015) was an even shorter crash than the one-week (August 2011) drop. The market was down 6% to 7% in the major indexes, but 2015 was a perfect example of what can happen when too many high-level market movers are taking their annual vacations, and the “B” team takes over the trading desks. August markets have generally lower volumes, so unscrupulous traders can stage a bear raid on some popular stock positions, scaring many traders and investors into selling prematurely.
The Flash Crash happened on Monday, August 24, when the Dow lost over 1,000-points (-6.6%) within minutes, spawning Internet headlines (click-bait) telling us that this single move “wiped-out” all the market gains made in 2015, to date. The headlines also screamed that this plunge had “wiped-out” an estimated ten-trillion dollars since early June. (Funny how headlines seldom say markets create profits, only losses).
Crude oil also fell to a multi-year low. But then, a funny thing happened. The Dow gained back those 1,000-points – and more – with a 1,300-point gain in three-days. In the S&P 500, as this chart shows, the index lost over 10%, from about 2,100 to 1,867, but the index had risen to 2,184 the following August.
Graphs are for illustrative and discussion purposes only. Please read important disclosures at the end of this commentary.
Investors who panicked during this Flash Crash – or who had “stop-losses” set – lost a ton of money, as there was no bid on the way down on some stocks or ETFs. Intra-day, some exchange-traded funds (ETFs) fell by up to 35%, including some great dividend stocks in iShares Select Dividend (DXY) or Vanguard Dividend Appreciation (VIG). Shares dropped over 30% intra-day – even though their underlying holdings hadn’t fallen anywhere near that much. The result was total chaos. Stop-loss orders were triggered at horrid prices. Circuit breakers kicked in and regular investors got crushed by pricing errors didn’t see coming.
- DVY opened August 24th at $69.40, hit a high of $73.79 and a low of $48 (31% off the open).
- VIG opened August 24th at $71.74, hit a high of $75.47 and a low of $47.70 (-33.5% off the open).
These two ETFs rebounded to their pre-crash levels by the next day, but that didn’t help investors who sold, or who had their “stop-loss orders” executed at the lows. (I’ve never instituted a stop-loss for that reason. If I’m worried about a stock, I’ll sell maybe 50% but a “stop-loss” (to me) means I will be taken out unwillingly at a price that may be well below my intended stop-loss due to few bids). Imagine setting a stop-loss on Nvidia at $100 this year – which it hit last April. We’d miss out on all the gains since then.
The most important lesson is that Market Hurricanes come and go but we often see MUCH higher prices one-year later, so I would just endure these temporary seasonal shenanigans without selling into a panic.
Navellier & Associates; own Nvidia Corp (NVDA), in managed accounts. Gary Alexander owns Nvidia Corp (NVDA), in a personal account.
All content above represents the opinion of Gary Alexander of Navellier & Associates, Inc.
Also In This Issue
A Look Ahead by Louis Navellier
Why Can’t the BLS Economists Count Jobs Accurately?
Income Mail by Bryan Perry
Time to Buy U.S.-Based Dividend Stocks and Fixed Income Investments?
Growth Mail by Gary Alexander
What to Do if Another Market Hurricane Strikes This August
Global Mail by Ivan Martchev
A Sudden “Four Standard Deviation Move” In the S&P 500
Sector Spotlight by Jason Bodner
August Should Be for Vacations, Not Volatility
View Full Archive
Read Past Issues Here
About The Author

Gary Alexander
SENIOR EDITOR
Gary Alexander has been Senior Writer at Navellier since 2009. He edits Navellier’s weekly Marketmail and writes a weekly Growth Mail column, in which he uses market history to support the case for growth stocks. For the previous 20-years before joining Navellier, he was Senior Executive Editor at InvestorPlace Media (formerly Phillips Publishing), where he worked with several leading investment analysts, including Louis Navellier (since 1997), helping launch Louis Navellier’s Blue Chip Growth and Global Growth newsletters.
Prior to that, Gary edited Wealth Magazine and Gold Newsletter and wrote various investment research reports for Jefferson Financial in New Orleans in the 1980s. He began his financial newsletter career with KCI Communications in 1980, where he served as consulting editor for Personal Finance newsletter while serving as general manager of KCI’s Alexandria House book division. Before that, he covered the economics beat for news magazines. All content of “Growth Mail” represents the opinion of Gary Alexander
Important Disclosures:
Although information in these reports has been obtained from and is based upon sources that Navellier believes to be reliable, Navellier does not guarantee its accuracy and it may be incomplete or condensed. All opinions and estimates constitute Navellier’s judgment as of the date the report was created and are subject to change without notice. These reports are for informational purposes only and are not a solicitation for the purchase or sale of a security. Any decision to purchase securities mentioned in these reports must take into account existing public information on such securities or any registered prospectus.To the extent permitted by law, neither Navellier & Associates, Inc., nor any of its affiliates, agents, or service providers assumes any liability or responsibility nor owes any duty of care for any consequences of any person acting or refraining to act in reliance on the information contained in this communication or for any decision based on it.
Past performance is no indication of future results. Investment in securities involves significant risk and has the potential for partial or complete loss of funds invested. It should not be assumed that any securities recommendations made by Navellier. in the future will be profitable or equal the performance of securities made in this report. Dividend payments are not guaranteed. The amount of a dividend payment, if any, can vary over time and issuers may reduce dividends paid on securities in the event of a recession or adverse event affecting a specific industry or issuer.
None of the stock information, data, and company information presented herein constitutes a recommendation by Navellier or a solicitation to buy or sell any securities. Any specific securities identified and described do not represent all of the securities purchased, sold, or recommended for advisory clients. The holdings identified do not represent all of the securities purchased, sold, or recommended for advisory clients and the reader should not assume that investments in the securities identified and discussed were or will be profitable.
Information presented is general information that does not take into account your individual circumstances, financial situation, or needs, nor does it present a personalized recommendation to you. Individual stocks presented may not be suitable for every investor. Investment in securities involves significant risk and has the potential for partial or complete loss of funds invested. Investment in fixed income securities has the potential for the investment return and principal value of an investment to fluctuate so that an investor’s holdings, when redeemed, may be worth less than their original cost.
One cannot invest directly in an index. Index is unmanaged and index performance does not reflect deduction of fees, expenses, or taxes. Presentation of Index data does not reflect a belief by Navellier that any stock index constitutes an investment alternative to any Navellier equity strategy or is necessarily comparable to such strategies. Among the most important differences between the Indices and Navellier strategies are that the Navellier equity strategies may (1) incur material management fees, (2) concentrate its investments in relatively few stocks, industries, or sectors, (3) have significantly greater trading activity and related costs, and (4) be significantly more or less volatile than the Indices.
ETF Risk: We may invest in exchange traded funds (“ETFs”) and some of our investment strategies are generally fully invested in ETFs. Like traditional mutual funds, ETFs charge asset-based fees, but they generally do not charge initial sales charges or redemption fees and investors typically pay only customary brokerage fees to buy and sell ETF shares. The fees and costs charged by ETFs held in client accounts will not be deducted from the compensation the client pays Navellier. ETF prices can fluctuate up or down, and a client account could lose money investing in an ETF if the prices of the securities owned by the ETF go down. ETFs are subject to additional risks:
- ETF shares may trade above or below their net asset value;
- An active trading market for an ETF’s shares may not develop or be maintained;
- The value of an ETF may be more volatile than the underlying portfolio of securities the ETF is designed to track;
- The cost of owning shares of the ETF may exceed those a client would incur by directly investing in the underlying securities; and
- Trading of an ETF’s shares may be halted if the listing exchange’s officials deem it appropriate, the shares are delisted from the exchange, or the activation of market-wide “circuit breakers” (which are tied to large decreases in stock prices) halts stock trading generally.
Grader Disclosures: Investment in equity strategies involves substantial risk and has the potential for partial or complete loss of funds invested. The sample portfolio and any accompanying charts are for informational purposes only and are not to be construed as a solicitation to buy or sell any financial instrument and should not be relied upon as the sole factor in an investment making decision. As a matter of normal and important disclosures to you, as a potential investor, please consider the following: The performance presented is not based on any actual securities trading, portfolio, or accounts, and the reported performance of the A, B, C, D, and F portfolios (collectively the “model portfolios”) should be considered mere “paper” or pro forma performance results based on Navellier’s research.
Investors evaluating any of Navellier & Associates, Inc.’s, (or its affiliates’) Investment Products must not use any information presented here, including the performance figures of the model portfolios, in their evaluation of any Navellier Investment Products. Navellier Investment Products include the firm’s mutual funds and managed accounts. The model portfolios, charts, and other information presented do not represent actual funded trades and are not actual funded portfolios. There are material differences between Navellier Investment Products’ portfolios and the model portfolios, research, and performance figures presented here. The model portfolios and the research results (1) may contain stocks or ETFs that are illiquid and difficult to trade; (2) may contain stock or ETF holdings materially different from actual funded Navellier Investment Product portfolios; (3) include the reinvestment of all dividends and other earnings, estimated trading costs, commissions, or management fees; and, (4) may not reflect prices obtained in an actual funded Navellier Investment Product portfolio. For these and other reasons, the reported performances of model portfolios do not reflect the performance results of Navellier’s actually funded and traded Investment Products. In most cases, Navellier’s Investment Products have materially lower performance results than the performances of the model portfolios presented.
This report contains statements that are, or may be considered to be, forward-looking statements. All statements that are not historical facts, including statements about our beliefs or expectations, are “forward-looking statements” within the meaning of The U.S. Private Securities Litigation Reform Act of 1995. These statements may be identified by such forward-looking terminology as “expect,” “estimate,” “plan,” “intend,” “believe,” “anticipate,” “may,” “will,” “should,” “could,” “continue,” “project,” or similar statements or variations of such terms. Our forward-looking statements are based on a series of expectations, assumptions, and projections, are not guarantees of future results or performance, and involve substantial risks and uncertainty as described in Form ADV Part 2A of our filing with the Securities and Exchange Commission (SEC), which is available at www.adviserinfo.sec.gov or by requesting a copy by emailing info@navellier.com. All of our forward-looking statements are as of the date of this report only. We can give no assurance that such expectations or forward-looking statements will prove to be correct. Actual results may differ materially. You are urged to carefully consider all such factors.
FEDERAL TAX ADVICE DISCLAIMER: As required by U.S. Treasury Regulations, you are informed that, to the extent this presentation includes any federal tax advice, the presentation is not written by Navellier to be used, and cannot be used, for the purpose of avoiding federal tax penalties. Navellier does not advise on any income tax requirements or issues. Use of any information presented by Navellier is for general information only and does not represent tax advice either express or implied. You are encouraged to seek professional tax advice for income tax questions and assistance.
IMPORTANT NEWSLETTER DISCLOSURE:The hypothetical performance results for investment newsletters that are authored or edited by Louis Navellier, including Louis Navellier’s Growth Investor, Louis Navellier’s Breakthrough Stocks, Louis Navellier’s Accelerated Profits, and Louis Navellier’s Platinum Club, are not based on any actual securities trading, portfolio, or accounts, and the newsletters’ reported hypothetical performances should be considered mere “paper” or proforma hypothetical performance results and are not actual performance of real world trades. Navellier & Associates, Inc. does not have any relation to or affiliation with the owner of these newsletters. There are material differences between Navellier Investment Products’ portfolios and the InvestorPlace Media, LLC newsletter portfolios authored by Louis Navellier. The InvestorPlace Media, LLC newsletters contain hypothetical performance that do not include transaction costs, advisory fees, or other fees a client might incur if actual investments and trades were being made by an investor. As a result, newsletter performance should not be used to evaluate Navellier Investment services which are separate and different from the newsletters. The owner of the newsletters is InvestorPlace Media, LLC and any questions concerning the newsletters, including any newsletter advertising or hypothetical Newsletter performance claims, (which are calculated solely by Investor Place Media and not Navellier) should be referred to InvestorPlace Media, LLC at (800) 718-8289.
Please note that Navellier & Associates and the Navellier Private Client Group are managed completely independent of the newsletters owned and published by InvestorPlace Media, LLC and written and edited by Louis Navellier, and investment performance of the newsletters should in no way be considered indicative of potential future investment performance for any Navellier & Associates separately managed account portfolio. Potential investors should consult with their financial advisor before investing in any Navellier Investment Product.
Navellier claims compliance with Global Investment Performance Standards (GIPS). To receive a complete list and descriptions of Navellier’s composites and/or a presentation that adheres to the GIPS standards, please contact Navellier or click here. It should not be assumed that any securities recommendations made by Navellier & Associates, Inc. in the future will be profitable or equal the performance of securities made in this report.
FactSet Disclosure: Navellier does not independently calculate the statistical information included in the attached report. The calculation and the information are provided by FactSet, a company not related to Navellier. Although information contained in the report has been obtained from FactSet and is based on sources Navellier believes to be reliable, Navellier does not guarantee its accuracy, and it may be incomplete or condensed. The report and the related FactSet sourced information are provided on an “as is” basis. The user assumes the entire risk of any use made of this information. Investors should consider the report as only a single factor in making their investment decision. The report is for informational purposes only and is not intended as an offer or solicitation for the purchase or sale of a security. FactSet sourced information is the exclusive property of FactSet. Without prior written permission of FactSet, this information may not be reproduced, disseminated or used to create any financial products. All indices are unmanaged and performance of the indices include reinvestment of dividends and interest income, unless otherwise noted, are not illustrative of any particular investment and an investment cannot be made in any index. Past performance is no guarantee of future results.