by Bryan Perry
August 26, 2025
From looking at a long-term chart of the U.S. Dollar Index (DXY), going back to the Great Recession of 2007-2008, one can see that it is well above 2008 levels but has dropped since 2022 and sharply in 2025.
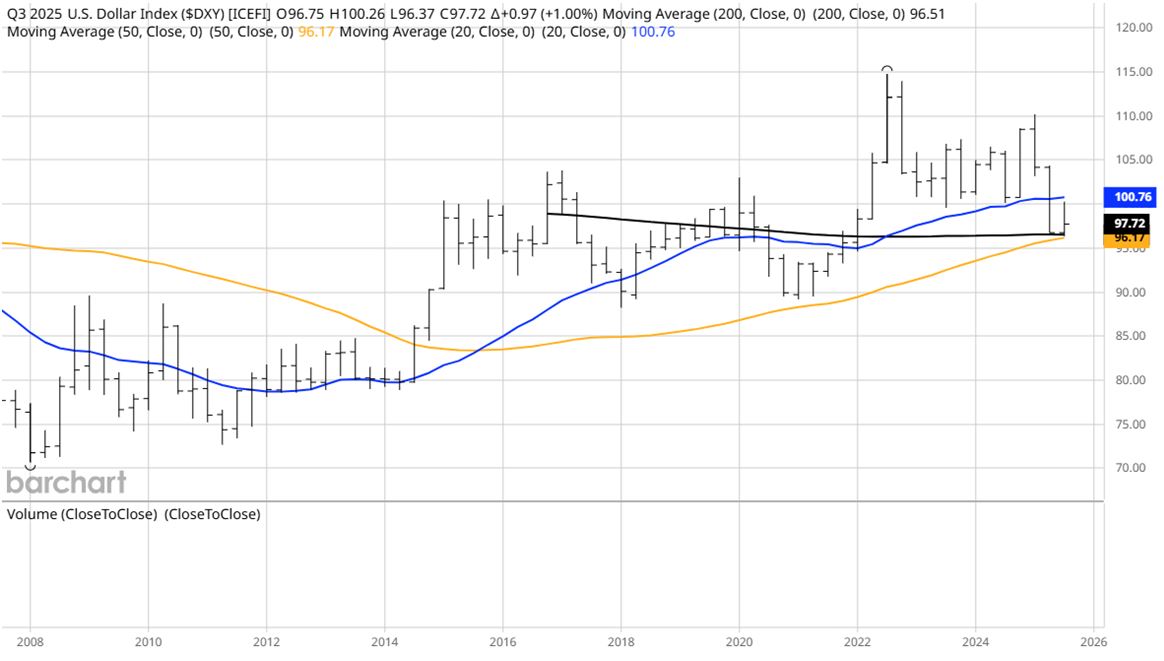
Graphs are for illustrative and discussion purposes only. Please read important disclosures at the end of this commentary.
However, from a much longer timeline perspective – 50 years – the dollar looks to be in relatively decent shape. The dollar’s dramatic rally between 1982 and 1985 wasn’t just a market fluke, it was the result of a perfect storm of monetary policy, macroeconomic shifts, and global capital flows. But as one can see from this chart, the dollar has appreciated since 2008, despite record deficit spending during that span.
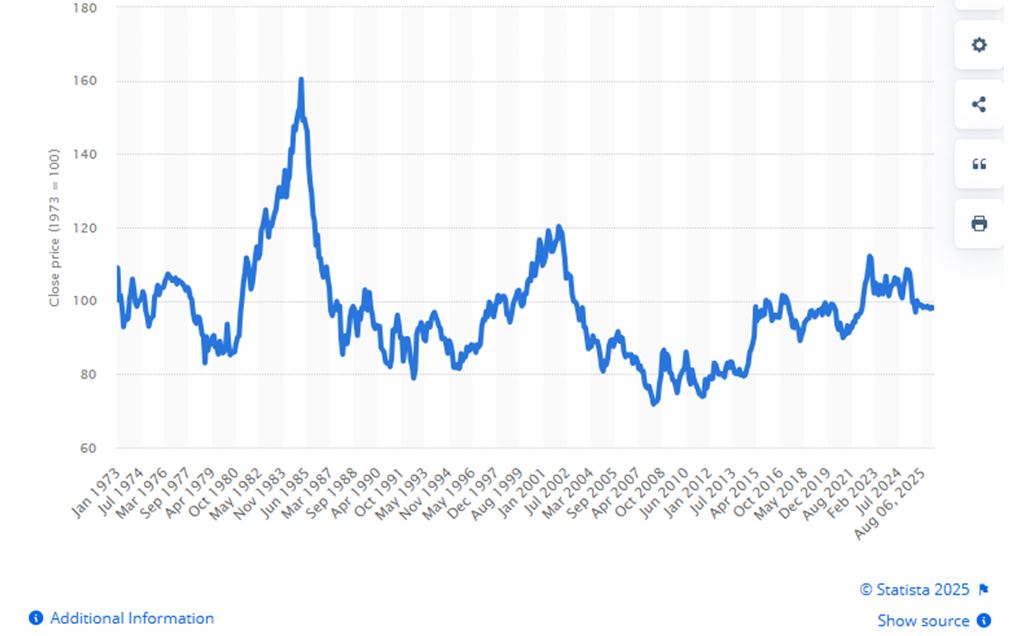
Graphs are for illustrative and discussion purposes only. Please read important disclosures at the end of this commentary.
Paul Volcker’s Fed aggressively raised interest rates, starting in 1979, to crush double-digit inflation, pushing the federal funds rate above 20% by 1981. In similar fashion, but not nearly as dramatic, Jerome Powell’s Fed raised the Fed Funds rate 11-times from March 2022 to July 2023 to beat back 9% inflation.
Though rates began easing in mid-1982 as inflation fell below 4%, the U.S. still offered relatively high yields compared to other economies, attracting foreign capital. Sound familiar? This is similar to today’s situation, when comparing 10-year sovereign yields from other developed nations. Only the UK, Australia and New Zealand offer 10-year yields fractionally higher than that of the U.S., but with far less liquidity.
So, what’s up with the current rally in gold if the dollar isn’t truly breaking down? Gold’s surge to record highs approaching $3,500 isn’t just about inflation or dollar weakness anymore. What’s remarkable is that this rally is happening despite the dollar holding firm within a long-term range and long-date Treasury yields having risen for the better part of 2025.
Demand for gold as a safe haven against soaring government debt is incredible. Central banks have purchased over 1,000-metric tons of gold each year for three straight years (2023–2025), diversifying away from dollars and Treasuries. China’s gold purchases rose 34% in early 2025 compared to 2023.
Gold demand is strategic, driven by geopolitical hedging and sanction resilience, especially among emerging markets and has elevated gold’s appeal as a politically neutral reserve asset. Gold’s rally isn’t defying logic so much as it is responding to a new gravitational center – geopolitical hedging, fiscal anxiety, and strategic reserve rebalancing. The dollar may be stable, but the world around it isn’t. Following a sharp run up earlier this year, gold prices have traded laterally for nearly six-months now.
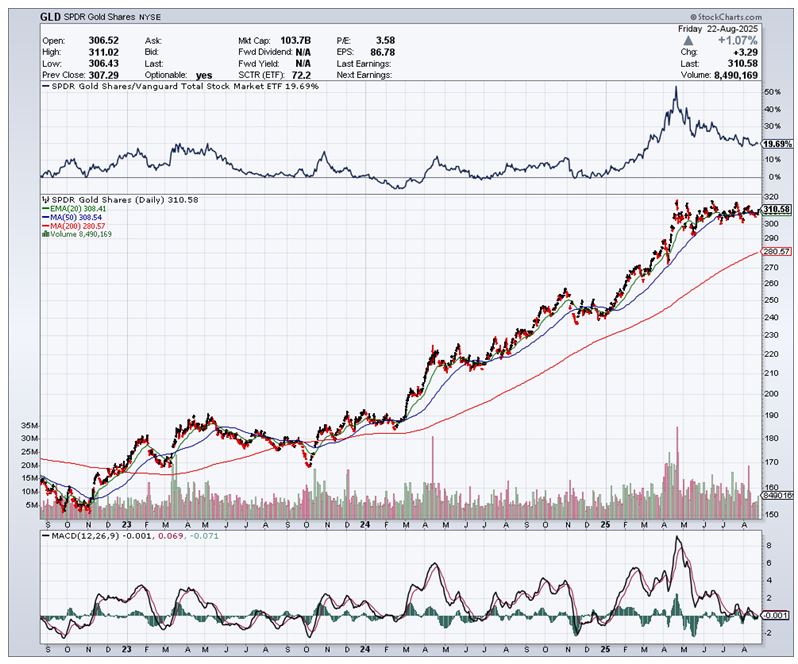
Graphs are for illustrative and discussion purposes only. Please read important disclosures at the end of this commentary.
Investor anxiety about long-term U.S. fiscal sustainability is a large and consistent part of the macro-economic dialogue as the potential for future dollar debasement grows with every $1-trillion added to the federal debt. Even as the Fed is gradually seeing core inflation rachet down towards its 2% target, there is a deep-seated anxiety about fiscal-driven inflation that could emerge like a roman candle.
As of August 2025, the gross national debt has surpassed $37-trillion, a historic and surreal milestone. The U.S. is adding about $1-trillion every 160-days, which is more than twice as fast as the average over the past 25-years. This acceleration is primarily driven by two factors that are proving hugely difficult to corral – massive federal budget deficits and exploding interest payments at higher average interest rates.
The fiscal year 2025 deficit is projected at $1.9-trillion, with $1.63-trillion already recorded in the first 10-months and annual interest on the debt is nearing $1-trillion, making it the second-largest federal expense, surpassing defense, and Medicare, trailing only Social Security. As a result, Treasury auctions have scaled up dramatically, with $125-billion in notes and bonds issued in August alone, plus the shorter-term bills.
Trump’s Big Beautiful Bill raised the debt ceiling by $5-trillion. The jury is still out as to how lower top income tax rates, higher tariffs, inflation and economic growth will impact any further growth of the federal debt and whether there is real potential for deficit reduction – as is being voiced by Treasury Secretary Scott Bessent, who has repeatedly emphasized that the Trump administration is “laser-focused” on using rising tariff revenues to pay down the national debt. Bessent projected over $300-billion in tariff revenue this year and stated that this would be prioritized for debt reduction. He’s committed to lowering the deficit-to-GDP ratio at around 100% of GDP, which he considers a “manageable, responsible” level.
A “3-3-3” Plan (aiming for 3% GDP growth, 3% inflation and 3% interest rates on federal debt) is Scott Bessent’s goal. This trifecta set of goals is designed to create conditions where the debt burden becomes more sustainable, relative to economic output. What is missing in this formula is dramatic restraint on Congressional spending – something that has proven to be wildly unpopular with our elected officials.
It’s too early to tell if this plan and other strategic efforts will produce meaningful results to combat the debt crisis because, quite simply, the political will seems to be lacking, at least as long as the market keeps absorbing U.S. debt at these record Treasury auctions. In the meantime, this sideways price action in gold for the past six-months looks like it will culminate in a solid move higher, sooner than later.
All content above represents the opinion of Bryan Perry of Navellier & Associates, Inc.
Also In This Issue
A Look Ahead by Louis Navellier
Ukraine Talks Shift from Alaska to the White House
Income Mail by Bryan Perry
Gold is Set for More Gains, Based on “Weak Dollar” Misconceptions
Growth Mail by Gary Alexander
Labor Day Time Bomb: Fewer Births = Fewer Workers (and Lower Benefits)
Global Mail by Ivan Martchev
The S&P 500 Could Tag 6600 this Week
Sector Spotlight by Jason Bodner
The Market Finds Its Voice at Jackson Hole
View Full Archive
Read Past Issues Here

Bryan Perry
SENIOR DIRECTOR
Bryan Perry is a Senior Director with Navellier Private Client Group, advising and facilitating high net worth investors in the pursuit of their financial goals.
Bryan’s financial services career spanning the past three decades includes over 20-years of wealth management experience with Wall Street firms that include Bear Stearns, Lehman Brothers and Paine Webber, working with both retail and institutional clients. Bryan earned a B.A. in Political Science from Virginia Polytechnic Institute & State University and currently holds a Series 65 license. All content of “Income Mail” represents the opinion of Bryan Perry
Important Disclosures:
Although information in these reports has been obtained from and is based upon sources that Navellier believes to be reliable, Navellier does not guarantee its accuracy and it may be incomplete or condensed. All opinions and estimates constitute Navellier’s judgment as of the date the report was created and are subject to change without notice. These reports are for informational purposes only and are not a solicitation for the purchase or sale of a security. Any decision to purchase securities mentioned in these reports must take into account existing public information on such securities or any registered prospectus.To the extent permitted by law, neither Navellier & Associates, Inc., nor any of its affiliates, agents, or service providers assumes any liability or responsibility nor owes any duty of care for any consequences of any person acting or refraining to act in reliance on the information contained in this communication or for any decision based on it.
Past performance is no indication of future results. Investment in securities involves significant risk and has the potential for partial or complete loss of funds invested. It should not be assumed that any securities recommendations made by Navellier. in the future will be profitable or equal the performance of securities made in this report. Dividend payments are not guaranteed. The amount of a dividend payment, if any, can vary over time and issuers may reduce dividends paid on securities in the event of a recession or adverse event affecting a specific industry or issuer.
None of the stock information, data, and company information presented herein constitutes a recommendation by Navellier or a solicitation to buy or sell any securities. Any specific securities identified and described do not represent all of the securities purchased, sold, or recommended for advisory clients. The holdings identified do not represent all of the securities purchased, sold, or recommended for advisory clients and the reader should not assume that investments in the securities identified and discussed were or will be profitable.
Information presented is general information that does not take into account your individual circumstances, financial situation, or needs, nor does it present a personalized recommendation to you. Individual stocks presented may not be suitable for every investor. Investment in securities involves significant risk and has the potential for partial or complete loss of funds invested. Investment in fixed income securities has the potential for the investment return and principal value of an investment to fluctuate so that an investor’s holdings, when redeemed, may be worth less than their original cost.
One cannot invest directly in an index. Index is unmanaged and index performance does not reflect deduction of fees, expenses, or taxes. Presentation of Index data does not reflect a belief by Navellier that any stock index constitutes an investment alternative to any Navellier equity strategy or is necessarily comparable to such strategies. Among the most important differences between the Indices and Navellier strategies are that the Navellier equity strategies may (1) incur material management fees, (2) concentrate its investments in relatively few stocks, industries, or sectors, (3) have significantly greater trading activity and related costs, and (4) be significantly more or less volatile than the Indices.
ETF Risk: We may invest in exchange traded funds (“ETFs”) and some of our investment strategies are generally fully invested in ETFs. Like traditional mutual funds, ETFs charge asset-based fees, but they generally do not charge initial sales charges or redemption fees and investors typically pay only customary brokerage fees to buy and sell ETF shares. The fees and costs charged by ETFs held in client accounts will not be deducted from the compensation the client pays Navellier. ETF prices can fluctuate up or down, and a client account could lose money investing in an ETF if the prices of the securities owned by the ETF go down. ETFs are subject to additional risks:
- ETF shares may trade above or below their net asset value;
- An active trading market for an ETF’s shares may not develop or be maintained;
- The value of an ETF may be more volatile than the underlying portfolio of securities the ETF is designed to track;
- The cost of owning shares of the ETF may exceed those a client would incur by directly investing in the underlying securities; and
- Trading of an ETF’s shares may be halted if the listing exchange’s officials deem it appropriate, the shares are delisted from the exchange, or the activation of market-wide “circuit breakers” (which are tied to large decreases in stock prices) halts stock trading generally.
Grader Disclosures: Investment in equity strategies involves substantial risk and has the potential for partial or complete loss of funds invested. The sample portfolio and any accompanying charts are for informational purposes only and are not to be construed as a solicitation to buy or sell any financial instrument and should not be relied upon as the sole factor in an investment making decision. As a matter of normal and important disclosures to you, as a potential investor, please consider the following: The performance presented is not based on any actual securities trading, portfolio, or accounts, and the reported performance of the A, B, C, D, and F portfolios (collectively the “model portfolios”) should be considered mere “paper” or pro forma performance results based on Navellier’s research.
Investors evaluating any of Navellier & Associates, Inc.’s, (or its affiliates’) Investment Products must not use any information presented here, including the performance figures of the model portfolios, in their evaluation of any Navellier Investment Products. Navellier Investment Products include the firm’s mutual funds and managed accounts. The model portfolios, charts, and other information presented do not represent actual funded trades and are not actual funded portfolios. There are material differences between Navellier Investment Products’ portfolios and the model portfolios, research, and performance figures presented here. The model portfolios and the research results (1) may contain stocks or ETFs that are illiquid and difficult to trade; (2) may contain stock or ETF holdings materially different from actual funded Navellier Investment Product portfolios; (3) include the reinvestment of all dividends and other earnings, estimated trading costs, commissions, or management fees; and, (4) may not reflect prices obtained in an actual funded Navellier Investment Product portfolio. For these and other reasons, the reported performances of model portfolios do not reflect the performance results of Navellier’s actually funded and traded Investment Products. In most cases, Navellier’s Investment Products have materially lower performance results than the performances of the model portfolios presented.
This report contains statements that are, or may be considered to be, forward-looking statements. All statements that are not historical facts, including statements about our beliefs or expectations, are “forward-looking statements” within the meaning of The U.S. Private Securities Litigation Reform Act of 1995. These statements may be identified by such forward-looking terminology as “expect,” “estimate,” “plan,” “intend,” “believe,” “anticipate,” “may,” “will,” “should,” “could,” “continue,” “project,” or similar statements or variations of such terms. Our forward-looking statements are based on a series of expectations, assumptions, and projections, are not guarantees of future results or performance, and involve substantial risks and uncertainty as described in Form ADV Part 2A of our filing with the Securities and Exchange Commission (SEC), which is available at www.adviserinfo.sec.gov or by requesting a copy by emailing info@navellier.com. All of our forward-looking statements are as of the date of this report only. We can give no assurance that such expectations or forward-looking statements will prove to be correct. Actual results may differ materially. You are urged to carefully consider all such factors.
FEDERAL TAX ADVICE DISCLAIMER: As required by U.S. Treasury Regulations, you are informed that, to the extent this presentation includes any federal tax advice, the presentation is not written by Navellier to be used, and cannot be used, for the purpose of avoiding federal tax penalties. Navellier does not advise on any income tax requirements or issues. Use of any information presented by Navellier is for general information only and does not represent tax advice either express or implied. You are encouraged to seek professional tax advice for income tax questions and assistance.
IMPORTANT NEWSLETTER DISCLOSURE:The hypothetical performance results for investment newsletters that are authored or edited by Louis Navellier, including Louis Navellier’s Growth Investor, Louis Navellier’s Breakthrough Stocks, Louis Navellier’s Accelerated Profits, and Louis Navellier’s Platinum Club, are not based on any actual securities trading, portfolio, or accounts, and the newsletters’ reported hypothetical performances should be considered mere “paper” or proforma hypothetical performance results and are not actual performance of real world trades. Navellier & Associates, Inc. does not have any relation to or affiliation with the owner of these newsletters. There are material differences between Navellier Investment Products’ portfolios and the InvestorPlace Media, LLC newsletter portfolios authored by Louis Navellier. The InvestorPlace Media, LLC newsletters contain hypothetical performance that do not include transaction costs, advisory fees, or other fees a client might incur if actual investments and trades were being made by an investor. As a result, newsletter performance should not be used to evaluate Navellier Investment services which are separate and different from the newsletters. The owner of the newsletters is InvestorPlace Media, LLC and any questions concerning the newsletters, including any newsletter advertising or hypothetical Newsletter performance claims, (which are calculated solely by Investor Place Media and not Navellier) should be referred to InvestorPlace Media, LLC at (800) 718-8289.
Please note that Navellier & Associates and the Navellier Private Client Group are managed completely independent of the newsletters owned and published by InvestorPlace Media, LLC and written and edited by Louis Navellier, and investment performance of the newsletters should in no way be considered indicative of potential future investment performance for any Navellier & Associates separately managed account portfolio. Potential investors should consult with their financial advisor before investing in any Navellier Investment Product.
Navellier claims compliance with Global Investment Performance Standards (GIPS). To receive a complete list and descriptions of Navellier’s composites and/or a presentation that adheres to the GIPS standards, please contact Navellier or click here. It should not be assumed that any securities recommendations made by Navellier & Associates, Inc. in the future will be profitable or equal the performance of securities made in this report.
FactSet Disclosure: Navellier does not independently calculate the statistical information included in the attached report. The calculation and the information are provided by FactSet, a company not related to Navellier. Although information contained in the report has been obtained from FactSet and is based on sources Navellier believes to be reliable, Navellier does not guarantee its accuracy, and it may be incomplete or condensed. The report and the related FactSet sourced information are provided on an “as is” basis. The user assumes the entire risk of any use made of this information. Investors should consider the report as only a single factor in making their investment decision. The report is for informational purposes only and is not intended as an offer or solicitation for the purchase or sale of a security. FactSet sourced information is the exclusive property of FactSet. Without prior written permission of FactSet, this information may not be reproduced, disseminated or used to create any financial products. All indices are unmanaged and performance of the indices include reinvestment of dividends and interest income, unless otherwise noted, are not illustrative of any particular investment and an investment cannot be made in any index. Past performance is no guarantee of future results.