by Gary Alexander
July 30, 2024
Article I, Section II of the U.S. Constitution mandates a head count every decade, and further states that “The actual enumeration shall be made within three years after the first meeting of the Congress of the United States, and within every subsequent term of ten years, in such manner as they shall by law direct.”
Oops, those last nine words opened Pandora’s Box of Mischief. For our first 17 decades, the census just counted heads, but 70 years ago, on August 31, 1954, something called the Census Bureau was formed, authorizing new tools that soon got used in ways that would make the Founding Fathers cringe. Born under Title 13’s 36 pages of dense small type, the Census Bureau began long-form snooping into every corner of our lives, including our income, and then they proceeded to report it in very misleading ways.
The failed War on Poverty, the bloated annual Cost of Living Allowances (COLAs) and political breast-beating over a widening “income gap” are all products of the way the Census Bureau miscounts our income. But a new book by Senator Phil Gramm, his fellow Texas A&M economics professor, Robert Ekelund, and economist John Early, who twice served as assistant commissioner of the Bureau of Labor Statistics, reveal several errors in the Census Bureau data that turned a national triumph into a travesty.

In this political season, Kamala Harris and other politicians will argue for more income transfers and will likely refer to a huge “income gap,” so let us be armed against any such disinformation in advance. Here are some key takeaways about Census Bureau misinformation from the introduction in Gramm’s book:
- “From the ramp-up of funding for the War on Poverty in 1967 to 2017, annual government transfer payments to the average household in the bottom 20 percent of the income distribution rose more than fourfold in inflation-adjusted dollars, from $9,677 to $45,389, and yet the official poverty measures tell us that the percentage of people living in poverty hardly changed during that 50-year period.”
- “While the highly publicized numbers from the Bureau of the Census on household income inequality show that in 2017 the bottom 20 percent of households had an average income of $13,258, other less publicized data from the Bureau of Labor Statistics show that these same households spent $26,091 on consumption – two times more than their income….The bottom quintile can consume more than twice its Census income only because the Census does not count two-thirds of transfer payments as income.”
- “Excluded from the measurement of household income are some $1.9 trillion of government transfers – programs like refundable tax credits, where beneficiaries get checks from the Treasury; food stamps, where beneficiaries buy food with government-issued debit cards; and … Medicare and Medicaid.”
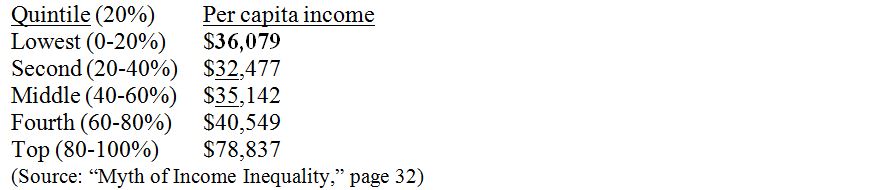
Taking these facts into consideration, only 2.5% of Americans live in poverty, not the official 12.3%. The bottom 20% receive an average of $45,389 a year in government transfer payments, $32,000 of which the Census Bureau ignores, because they only count cash income. In contrast, the Census Bureau counts all income of the top 20%, while not subtracting their high taxes, mostly paid to support the bottom 20%.
Adjusting all of this income data to reality, the solid line below represents the real, flatter income gap:

Graphs are for illustrative and discussion purposes only. Please read important disclosures at the end of this commentary.
It turns out that we are a generous nation, but we don’t get much credit for being generous. Besides our taxes, Americans donate 1.44% of GDP to charity, by far the highest rate of any nation. Among the lowest 20%, half are retired, but among those in their prime working years (18 to 65) who are not students, only 36% work, and those who work put in 17.3 hours per week, less than half the average.
The second quintile is composed mostly of the working poor, but they earn only slightly more ($53,924 vs. $49,613) than the lowest 20%. The per capita income data is even more dramatic. The bottom 20% average only 1.69 persons per household, vs. 2.23, 2.51, 2.81 and 3.10 in the next four quintiles.
That means the poorest 20% are actually better off than the second and middle 20% in per capita terms.
The truth continues to astonish throughout these pages – so I hope you will be able to buy this book.
Now, back to market realities:
August in Market History: 40, 50, 60 and 110 Years Ago
August was usually a strong month – long ago, when harvest seasons were a big deal – but not recently. According to The Stock Trader’s Almanac, August is the worst market month of the last 15 years, and September is the long-term burial month for bull markets, even though October has some notable down days in 1929 and 1987. This tells us that fearful investors try to sell stocks early, first in September, to avoid October, then in August to avoid September – and now investors have been selling in late July!
Graphs are for illustrative and discussion purposes only. Please read important disclosures at the end of this commentary.
Now, let us recall some up and down Augusts in round-numbered anniversary years from decades past:
1914: On Monday, August 3, no stock markets in Europe or America were open. It wasn’t a holiday. It was the day Germany declared war on France and invaded Belgium; very soon, Britain declared war on Germany, and Turkey signed a military pact with Germany. On this day, Sir Edward Grey, British Foreign Secretary, famously said, “The lamps are going out all over Europe, and we shall not see them lit again in our lifetime.” He was almost justified in that prediction considering the dark years, 1914 to 1945.
1964: On Sunday, August 2, North Vietnam allegedly fired on the U.S. destroyer Maddox in the Gulf of Tonkin, leading to the Gulf of Tonkin resolution – passed unanimously in the House and by 88-2 in the Senate, escalating the Vietnam War. On August 5th, the U.S. dropped the first bombs on North Vietnam. The Dow declined 1.4% that week. Six years later, in 1970, Congress repealed this 1964 Resolution.
1974: On Friday, August 9, President Richard Nixon resigned as President and Vice President Gerald Ford was sworn in as America’s 38th President. The Dow quickly fell 18% on the news, from 798 on August 8th to 656 three weeks later, in the worst plunge of the 1974 bear market. On August 20, Nelson Rockefeller was nominated as Vice President. The market did not take kindly to Rocky. In the week of August 19-23, the Dow lost another 44.74 points (-6.1%), to a four-year low of 671.54. In one bright interlude, on August 14, Congress authorized U.S. citizens to own gold for the first time in 41 years, as of Dec. 31. During 1973 and 1974, the Dow was down 45%, and the American Exchange was down 80%.
1984: On Friday, August 3, the Dow jumped 3.3% on a record 236.57 million shares, the first-ever 200-million share day. Almost 73 million shares traded in the first hour. On that day, Mary Lou Retton won a perfect 10 in a gymnastic vault and became the first American woman to win a gold medal in that sport. The S&P 500 and Dow each gained 7.8% in the first three days of August and 10.6% for the full month, after each index rose 11.5% in August 1982, the birth month of the longest and strongest bull market of the 20th Century (up 15-fold from 1982 to 1999). These were the third and fourth best Augusts of the 20th Century, following an unlikely pair of Augusts in Depression-ridden 1932 (+34.8%) and 1933 (+12.8%).
All content above represents the opinion of Gary Alexander of Navellier & Associates, Inc.
Also In This Issue
A Look Ahead by Louis Navellier
The Case for Cutting U.S. Interest Rates This Week
Income Mail by Bryan Perry
A Bottom in Commercial Office Property Values Now Looks Further Out
Growth Mail by Gary Alexander
The American “Income Gap” is Much Smaller Than Advertised
Global Mail by Ivan Martchev
The Yen Strikes Back
Sector Spotlight by Jason Bodner
Managing Change in Markets Can Be Stressful – But Profitable
View Full Archive
Read Past Issues Here
About The Author

Gary Alexander
SENIOR EDITOR
Gary Alexander has been Senior Writer at Navellier since 2009. He edits Navellier’s weekly Marketmail and writes a weekly Growth Mail column, in which he uses market history to support the case for growth stocks. For the previous 20 years before joining Navellier, he was Senior Executive Editor at InvestorPlace Media (formerly Phillips Publishing), where he worked with several leading investment analysts, including Louis Navellier (since 1997), helping launch Louis Navellier’s Blue Chip Growth and Global Growth newsletters.
Prior to that, Gary edited Wealth Magazine and Gold Newsletter and wrote various investment research reports for Jefferson Financial in New Orleans in the 1980s. He began his financial newsletter career with KCI Communications in 1980, where he served as consulting editor for Personal Finance newsletter while serving as general manager of KCI’s Alexandria House book division. Before that, he covered the economics beat for news magazines. All content of “Growth Mail” represents the opinion of Gary Alexander
Important Disclosures:
Although information in these reports has been obtained from and is based upon sources that Navellier believes to be reliable, Navellier does not guarantee its accuracy and it may be incomplete or condensed. All opinions and estimates constitute Navellier’s judgment as of the date the report was created and are subject to change without notice. These reports are for informational purposes only and are not a solicitation for the purchase or sale of a security. Any decision to purchase securities mentioned in these reports must take into account existing public information on such securities or any registered prospectus.To the extent permitted by law, neither Navellier & Associates, Inc., nor any of its affiliates, agents, or service providers assumes any liability or responsibility nor owes any duty of care for any consequences of any person acting or refraining to act in reliance on the information contained in this communication or for any decision based on it.
Past performance is no indication of future results. Investment in securities involves significant risk and has the potential for partial or complete loss of funds invested. It should not be assumed that any securities recommendations made by Navellier. in the future will be profitable or equal the performance of securities made in this report. Dividend payments are not guaranteed. The amount of a dividend payment, if any, can vary over time and issuers may reduce dividends paid on securities in the event of a recession or adverse event affecting a specific industry or issuer.
None of the stock information, data, and company information presented herein constitutes a recommendation by Navellier or a solicitation to buy or sell any securities. Any specific securities identified and described do not represent all of the securities purchased, sold, or recommended for advisory clients. The holdings identified do not represent all of the securities purchased, sold, or recommended for advisory clients and the reader should not assume that investments in the securities identified and discussed were or will be profitable.
Information presented is general information that does not take into account your individual circumstances, financial situation, or needs, nor does it present a personalized recommendation to you. Individual stocks presented may not be suitable for every investor. Investment in securities involves significant risk and has the potential for partial or complete loss of funds invested. Investment in fixed income securities has the potential for the investment return and principal value of an investment to fluctuate so that an investor’s holdings, when redeemed, may be worth less than their original cost.
One cannot invest directly in an index. Index is unmanaged and index performance does not reflect deduction of fees, expenses, or taxes. Presentation of Index data does not reflect a belief by Navellier that any stock index constitutes an investment alternative to any Navellier equity strategy or is necessarily comparable to such strategies. Among the most important differences between the Indices and Navellier strategies are that the Navellier equity strategies may (1) incur material management fees, (2) concentrate its investments in relatively few stocks, industries, or sectors, (3) have significantly greater trading activity and related costs, and (4) be significantly more or less volatile than the Indices.
ETF Risk: We may invest in exchange traded funds (“ETFs”) and some of our investment strategies are generally fully invested in ETFs. Like traditional mutual funds, ETFs charge asset-based fees, but they generally do not charge initial sales charges or redemption fees and investors typically pay only customary brokerage fees to buy and sell ETF shares. The fees and costs charged by ETFs held in client accounts will not be deducted from the compensation the client pays Navellier. ETF prices can fluctuate up or down, and a client account could lose money investing in an ETF if the prices of the securities owned by the ETF go down. ETFs are subject to additional risks:
- ETF shares may trade above or below their net asset value;
- An active trading market for an ETF’s shares may not develop or be maintained;
- The value of an ETF may be more volatile than the underlying portfolio of securities the ETF is designed to track;
- The cost of owning shares of the ETF may exceed those a client would incur by directly investing in the underlying securities; and
- Trading of an ETF’s shares may be halted if the listing exchange’s officials deem it appropriate, the shares are delisted from the exchange, or the activation of market-wide “circuit breakers” (which are tied to large decreases in stock prices) halts stock trading generally.
Grader Disclosures: Investment in equity strategies involves substantial risk and has the potential for partial or complete loss of funds invested. The sample portfolio and any accompanying charts are for informational purposes only and are not to be construed as a solicitation to buy or sell any financial instrument and should not be relied upon as the sole factor in an investment making decision. As a matter of normal and important disclosures to you, as a potential investor, please consider the following: The performance presented is not based on any actual securities trading, portfolio, or accounts, and the reported performance of the A, B, C, D, and F portfolios (collectively the “model portfolios”) should be considered mere “paper” or pro forma performance results based on Navellier’s research.
Investors evaluating any of Navellier & Associates, Inc.’s, (or its affiliates’) Investment Products must not use any information presented here, including the performance figures of the model portfolios, in their evaluation of any Navellier Investment Products. Navellier Investment Products include the firm’s mutual funds and managed accounts. The model portfolios, charts, and other information presented do not represent actual funded trades and are not actual funded portfolios. There are material differences between Navellier Investment Products’ portfolios and the model portfolios, research, and performance figures presented here. The model portfolios and the research results (1) may contain stocks or ETFs that are illiquid and difficult to trade; (2) may contain stock or ETF holdings materially different from actual funded Navellier Investment Product portfolios; (3) include the reinvestment of all dividends and other earnings, estimated trading costs, commissions, or management fees; and, (4) may not reflect prices obtained in an actual funded Navellier Investment Product portfolio. For these and other reasons, the reported performances of model portfolios do not reflect the performance results of Navellier’s actually funded and traded Investment Products. In most cases, Navellier’s Investment Products have materially lower performance results than the performances of the model portfolios presented.
This report contains statements that are, or may be considered to be, forward-looking statements. All statements that are not historical facts, including statements about our beliefs or expectations, are “forward-looking statements” within the meaning of The U.S. Private Securities Litigation Reform Act of 1995. These statements may be identified by such forward-looking terminology as “expect,” “estimate,” “plan,” “intend,” “believe,” “anticipate,” “may,” “will,” “should,” “could,” “continue,” “project,” or similar statements or variations of such terms. Our forward-looking statements are based on a series of expectations, assumptions, and projections, are not guarantees of future results or performance, and involve substantial risks and uncertainty as described in Form ADV Part 2A of our filing with the Securities and Exchange Commission (SEC), which is available at www.adviserinfo.sec.gov or by requesting a copy by emailing info@navellier.com. All of our forward-looking statements are as of the date of this report only. We can give no assurance that such expectations or forward-looking statements will prove to be correct. Actual results may differ materially. You are urged to carefully consider all such factors.
FEDERAL TAX ADVICE DISCLAIMER: As required by U.S. Treasury Regulations, you are informed that, to the extent this presentation includes any federal tax advice, the presentation is not written by Navellier to be used, and cannot be used, for the purpose of avoiding federal tax penalties. Navellier does not advise on any income tax requirements or issues. Use of any information presented by Navellier is for general information only and does not represent tax advice either express or implied. You are encouraged to seek professional tax advice for income tax questions and assistance.
IMPORTANT NEWSLETTER DISCLOSURE:The hypothetical performance results for investment newsletters that are authored or edited by Louis Navellier, including Louis Navellier’s Growth Investor, Louis Navellier’s Breakthrough Stocks, Louis Navellier’s Accelerated Profits, and Louis Navellier’s Platinum Club, are not based on any actual securities trading, portfolio, or accounts, and the newsletters’ reported hypothetical performances should be considered mere “paper” or proforma hypothetical performance results and are not actual performance of real world trades. Navellier & Associates, Inc. does not have any relation to or affiliation with the owner of these newsletters. There are material differences between Navellier Investment Products’ portfolios and the InvestorPlace Media, LLC newsletter portfolios authored by Louis Navellier. The InvestorPlace Media, LLC newsletters contain hypothetical performance that do not include transaction costs, advisory fees, or other fees a client might incur if actual investments and trades were being made by an investor. As a result, newsletter performance should not be used to evaluate Navellier Investment services which are separate and different from the newsletters. The owner of the newsletters is InvestorPlace Media, LLC and any questions concerning the newsletters, including any newsletter advertising or hypothetical Newsletter performance claims, (which are calculated solely by Investor Place Media and not Navellier) should be referred to InvestorPlace Media, LLC at (800) 718-8289.
Please note that Navellier & Associates and the Navellier Private Client Group are managed completely independent of the newsletters owned and published by InvestorPlace Media, LLC and written and edited by Louis Navellier, and investment performance of the newsletters should in no way be considered indicative of potential future investment performance for any Navellier & Associates separately managed account portfolio. Potential investors should consult with their financial advisor before investing in any Navellier Investment Product.
Navellier claims compliance with Global Investment Performance Standards (GIPS). To receive a complete list and descriptions of Navellier’s composites and/or a presentation that adheres to the GIPS standards, please contact Navellier or click here. It should not be assumed that any securities recommendations made by Navellier & Associates, Inc. in the future will be profitable or equal the performance of securities made in this report.
FactSet Disclosure: Navellier does not independently calculate the statistical information included in the attached report. The calculation and the information are provided by FactSet, a company not related to Navellier. Although information contained in the report has been obtained from FactSet and is based on sources Navellier believes to be reliable, Navellier does not guarantee its accuracy, and it may be incomplete or condensed. The report and the related FactSet sourced information are provided on an “as is” basis. The user assumes the entire risk of any use made of this information. Investors should consider the report as only a single factor in making their investment decision. The report is for informational purposes only and is not intended as an offer or solicitation for the purchase or sale of a security. FactSet sourced information is the exclusive property of FactSet. Without prior written permission of FactSet, this information may not be reproduced, disseminated or used to create any financial products. All indices are unmanaged and performance of the indices include reinvestment of dividends and interest income, unless otherwise noted, are not illustrative of any particular investment and an investment cannot be made in any index. Past performance is no guarantee of future results.