by Jason Bodner
July 30, 2024
I’ve just returned from another mini-vacation, this time in the mountains of Colorado – watching some of the snow fall in avalanches, much like the technology stocks have fallen over the last two weeks.
Believe it or not, vacationing is one of the 40 most stressful life events. The good news is that it’s not among the 10 or 20 most stressful events in life. According to Dartmouth, the top five are:
- Death of a Spouse
- Divorce
- Marital Separation
- Jail
- Death of a Close Family Member
The top three are marriage-related, and there is also a common theme in the top 30 to 35 among 40 top stressors listed below. The common thread is a sudden or dramatic change in your life situation.

Evolution says that we were built to adapt, but we modern humans really dislike change. We seek comfort and stability. Sudden change often overwhelms us; we go haywire. We get analysis paralysis, feel uncomfortable and usually make emotional decisions… often the wrong ones.
This is especially true for investors. Right now, the stock market is experiencing massive change. The surface doesn’t always show it because of how most of the indexes are constructed.
For instance, I see a series of problems when we rely on following the leading indexes alone:
- One problem is that the media usually quotes the Dow Jones Industrial Average This list of 30 leading stocks was the only major index 100 years ago. It is now sort of a dinosaur. As a former broker/trader, I can tell you that no one in the financial industry regularly quotes or relies heavily on the Dow. In the investing world, most pros look at the S&P 500.
- This leads us to our second problem, which is probably the biggest culprit with most indexes. The S&P 500 is weighted by capitalization (market size) of each of the 500 stocks in the index, so larger companies get bigger weights. Those weightings can get out of whack, so that a very few stocks dictate everyone’s perceptions of the entire market
You’re no stranger to this if you’ve heard of the Magnificent 7. If you haven’t, congratulations, you’re one of the very few. These are 7 stocks that have captivated attention for a long time now:
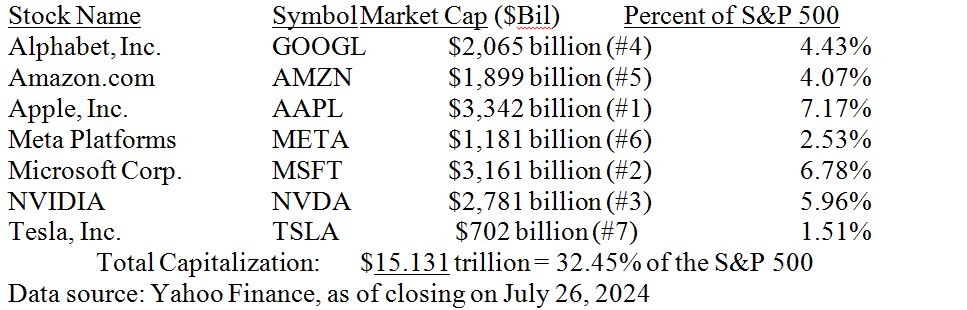
These seven stocks’ market caps (share price times number of shares outstanding) taken together are worth over $15 trillion. The entire S&P 500 is worth $46.6 trillion. In other words, just 1.4% of the index constituents (seven of 500 stocks) account for over 32% of a 500-stock index.
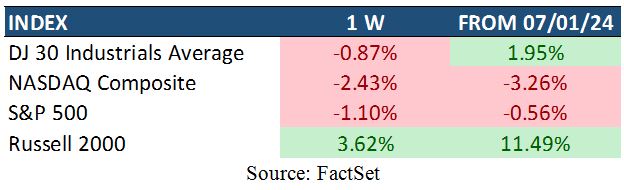
That’s a problem. It’s especially a problem now, because of the rotation we have been discussing for weeks now. It reared its ugly face in full force this week with large-cap stocks getting slammed. The NASDAQ is down about -2.5% for the week as I write this:
Graphs are for illustrative and discussion purposes only. Please read important disclosures at the end of this commentary.
This leads us to a third problem; the everyday investor is heavily focused on these large-cap stocks, so much so that they often ignore small-cap companies. Look again at the table above; notice the Russell 2000, it is up 11.5% since the beginning of July, while the large-cap technology-heavy NASDAQ is down -3.3% That’s nearly a 15% spread on two very divergent indexes.
This massive dispersion is causing a lot of heartburn. I’m certain that many of you know this all too well. Personally, I am long large-cap technology stocks, so I have seen my account value melt over the last two weeks too. I remind myself that this is part of the investing game: Portfolios ebb and flow. Like many, I have enjoyed a big run in my large-cap technology stocks while small-caps sagged.
That changed in mid-July. Let me show you why we are not alone in our recent pain in those stocks. If we look at where the money flows have been going, we see different pictures.
Here we can see a swift drop in the SPY (S&P 500 tracking ETF) since it peaked July 16th:
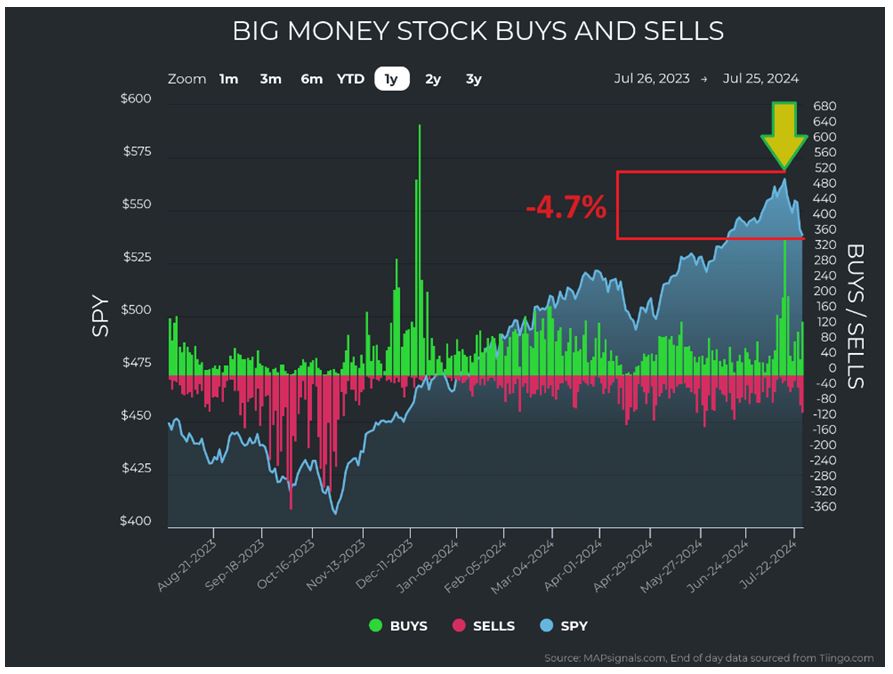
Graphs are for illustrative and discussion purposes only. Please read important disclosures at the end of this commentary.
That’s an uncomfortable 4.7% drop. For perspective, that’s more than $2 trillion of value disappearing. Now, looking at the QQQ (NASDAQ tracking ETF), the drop looks even worse.
Since the July 10th peak, it fell a stomach churning -8.8% (a $2.3 trillion loss):
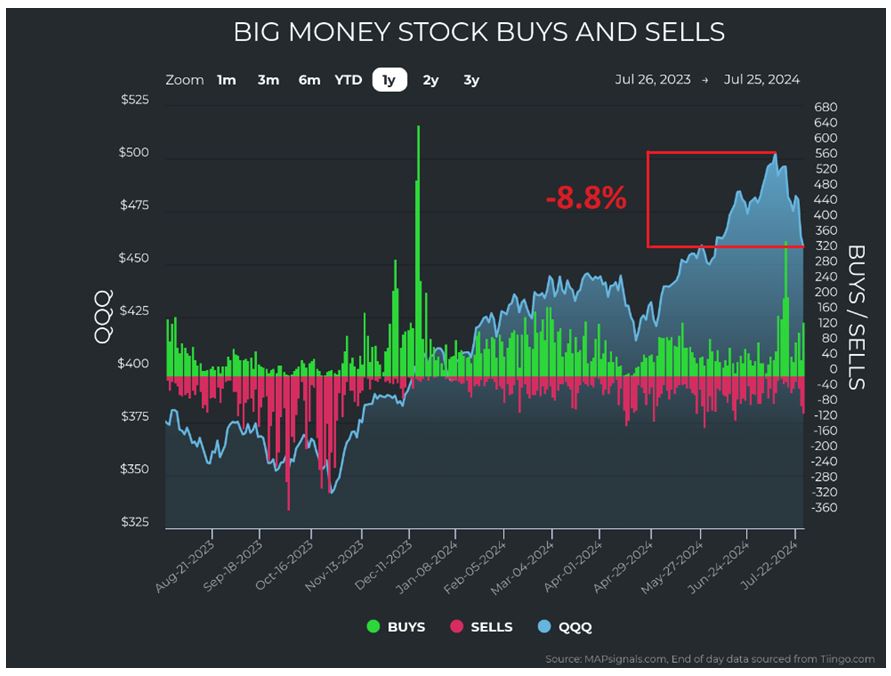
Graphs are for illustrative and discussion purposes only. Please read important disclosures at the end of this commentary.
Here is how the Mag-7 performed since the NASDAQ peak on July 10:
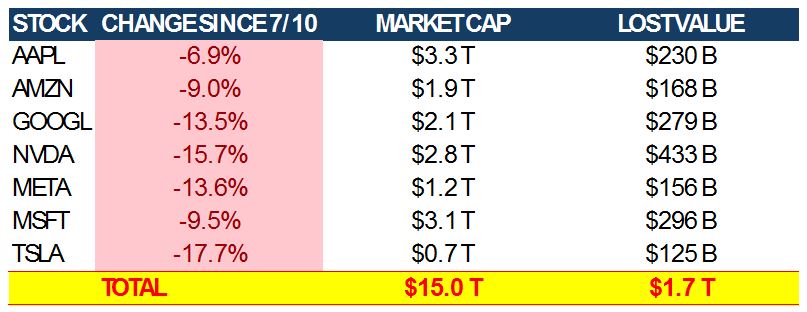
Graphs are for illustrative and discussion purposes only. Please read important disclosures at the end of this commentary.
Voila! 75% of the NASDAQ wipe-out came from just those 7 stocks: It’s an index in miniature!
There’s good news for small-caps, though. When we look through that lens we see huge juice:
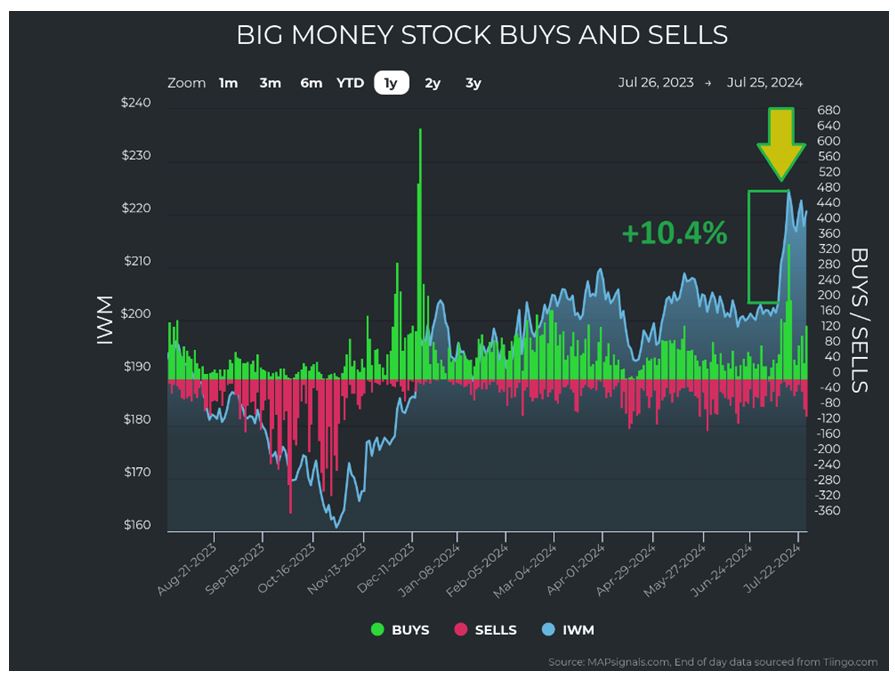
Graphs are for illustrative and discussion purposes only. Please read important disclosures at the end of this commentary.
Let’s look at that unusual buying and selling broken down by market cap:
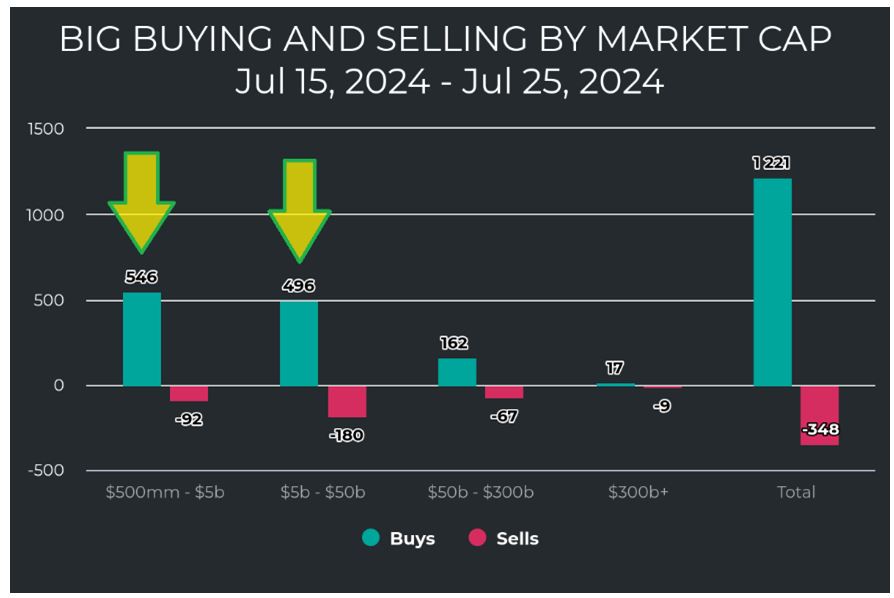
Graphs are for illustrative and discussion purposes only. Please read important disclosures at the end of this commentary.
You can quite literally see the money flows into small-caps and mid-caps!
Now, let’s see the ETF activity against the IWM (Russell 2000 tracking ETF):
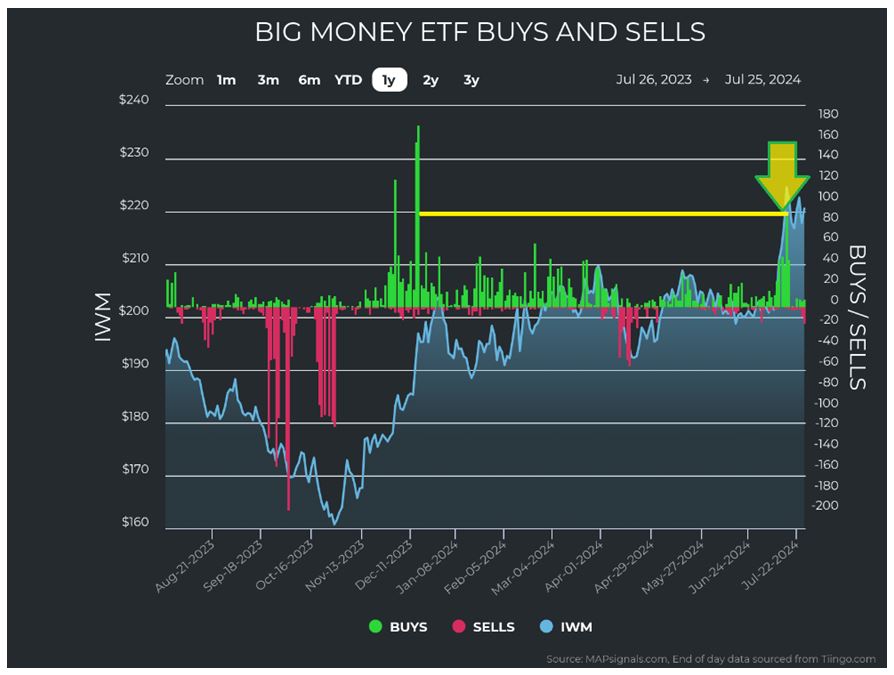
Graphs are for illustrative and discussion purposes only. Please read important disclosures at the end of this commentary.
Huge ETF buying occurred right through July 16th. A shocking 87 ETFs were bought unusually on July 16th, the most since December. Of those, many were growth ETFs like the popular ARK ETFs, small-cap, mid-cap, and value ETFs, too.
When we look at the most frequently bought stocks for the last six months, it’s stunning: 64% of the top 50 most frequently occurring stocks were large-cap (defined as $10 billion and above). Those 32 stocks accounted for 99% of the market cap of the list of 50, and 95% of the list were technology stocks by market cap:
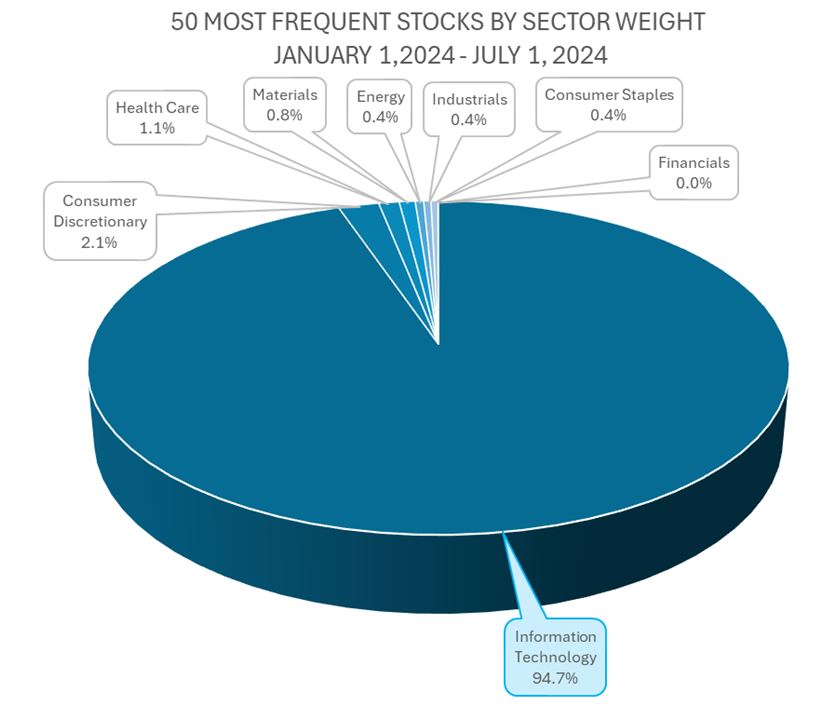
Graphs are for illustrative and discussion purposes only. Please read important disclosures at the end of this commentary.
Again, by market cap, 75% of these top 50 stocks, topped by four of the MAG-7 (MSFT, NVDA, GOOGL, and META), were technology stocks. Put another way, the smallest 28 stocks (below $10 billion in market value) accounted for only $128 billion of value, only a fraction of one Mag-7 stock value.
For months, money flows continued to be huge into large-cap technology. Now, the money flows are mostly into small-caps. This catch-up trade means there is room for new leadership to emerge.
The rotation is impacting sector leadership, too: Technology and discretionary dropped while financials and real estate rose in the list. Look how sectors are rotating, with the red and green arrows:
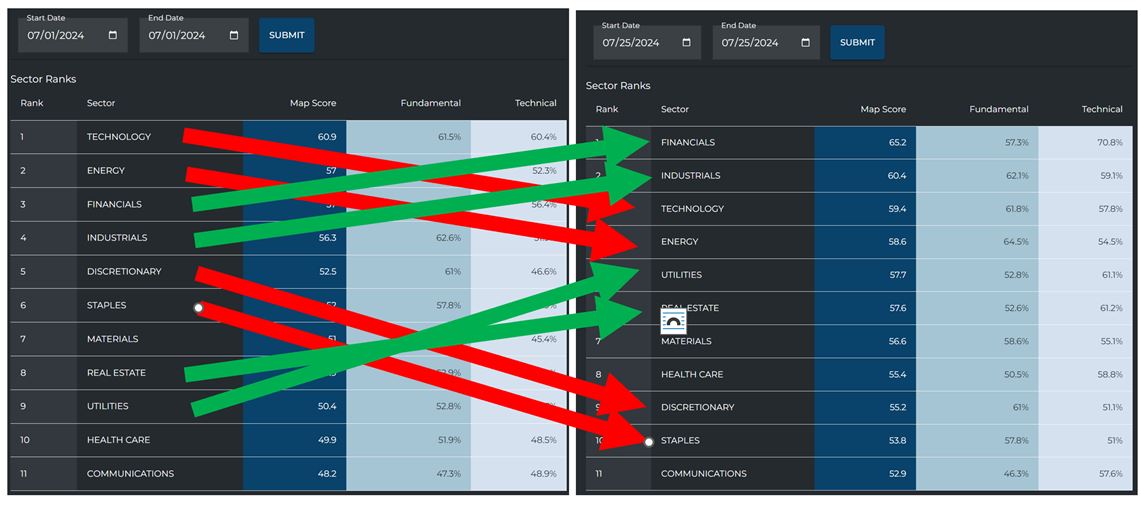
Graphs are for illustrative and discussion purposes only. Please read important disclosures at the end of this commentary.
You can see the rotation in action at a sector level too, looking at unusual buying and selling:
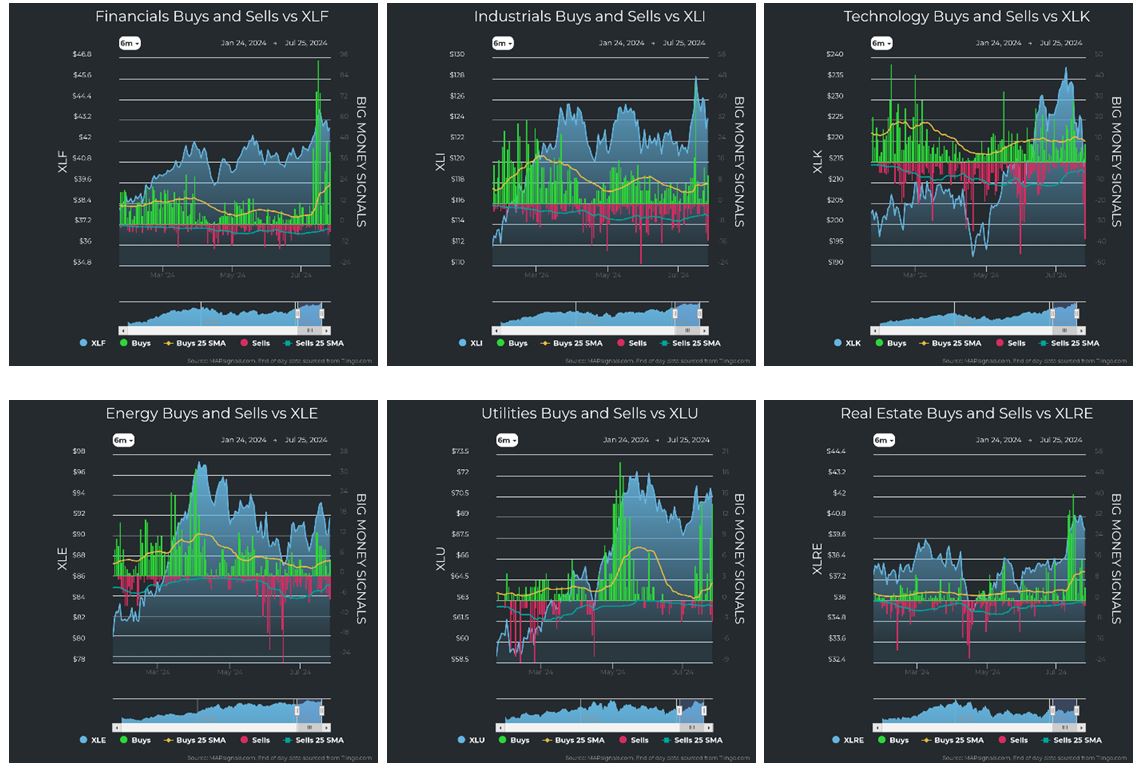
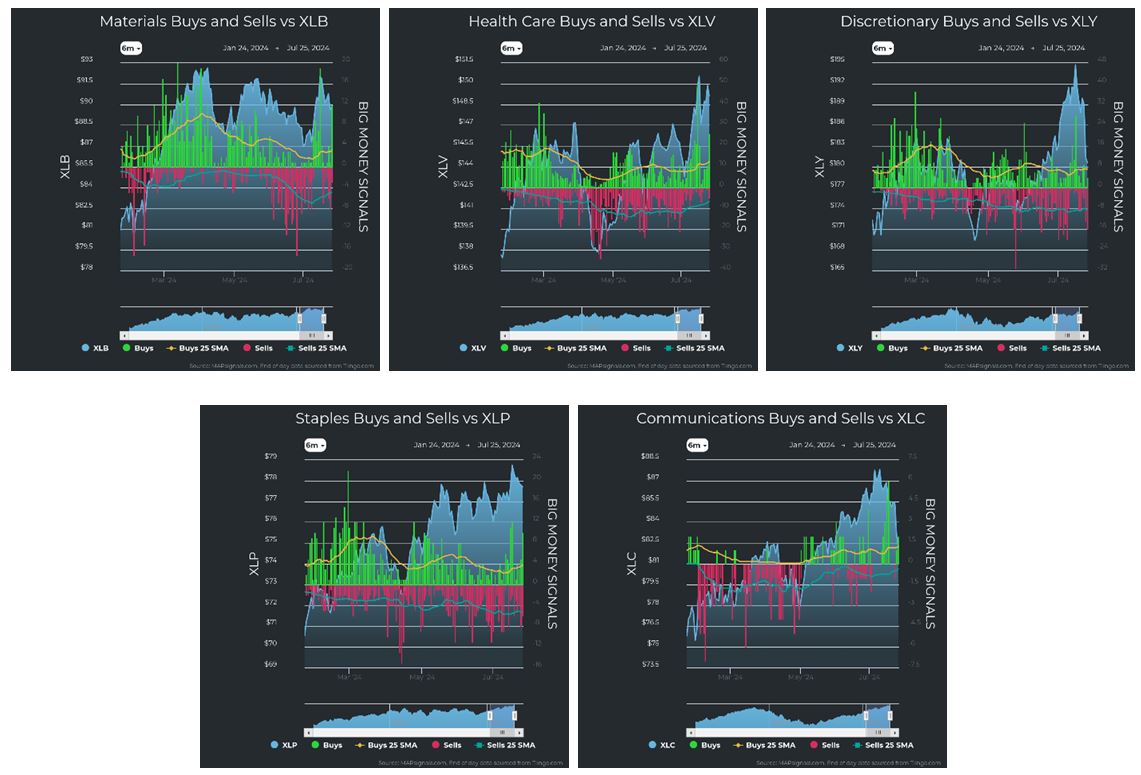
Graphs are for illustrative and discussion purposes only. Please read important disclosures at the end of this commentary.
The trade now is to hunt for new leadership in small-caps. Look for companies with growing sales and earnings and expanding profit margins.
As the late physicist Stephen Hawking said, “Intelligence is the ability to adapt to change.”
Navellier & Associates owns Nvidia Corp (NVDA), Apple Computer (AAPL), Microsoft (MSFT), Amazon (AMZN), and a few accounts own Meta Platforms (META), Alphabet Inc. (GOOG) and Tesla (TSLA), per client request in managed accounts. Jason Bodner owns Nvidia Corp (NVDA), Meta Platforms (META), Alphabet Inc. (GOOG) and Tesla (TSLA), personally but does not own Apple Computer (AAPL), Microsoft (MSFT), or Amazon (AMZN), personally.
All content above represents the opinion of Jason Bodner of Navellier & Associates, Inc.
Also In This Issue
A Look Ahead by Louis Navellier
The Case for Cutting U.S. Interest Rates This Week
Income Mail by Bryan Perry
A Bottom in Commercial Office Property Values Now Looks Further Out
Growth Mail by Gary Alexander
The American “Income Gap” is Much Smaller Than Advertised
Global Mail by Ivan Martchev
The Yen Strikes Back
Sector Spotlight by Jason Bodner
Managing Change in Markets Can Be Stressful – But Profitable
View Full Archive
Read Past Issues Here

Jason Bodner
MARKETMAIL EDITOR FOR SECTOR SPOTLIGHT
Jason Bodner writes Sector Spotlight in the weekly Marketmail publication and has authored several white papers for the company. He is also Co-Founder of Macro Analytics for Professionals which produces proprietary equity accumulation and distribution research for its clients. Previously, Mr. Bodner served as Director of European Equity Derivatives for Cantor Fitzgerald Europe in London, then moved to the role of Head of Equity Derivatives North America for the same company in New York. He also served as S.V.P. Equity Derivatives for Jefferies, LLC. He received a B.S. in business administration in 1996, with honors, from Skidmore College as a member of the Periclean Honors Society. All content of “Sector Spotlight” represents the opinion of Jason Bodner
Important Disclosures:
Jason Bodner is a co-founder and co-owner of Mapsignals. Mr. Bodner is an independent contractor who is occasionally hired by Navellier & Associates to write an article and or provide opinions for possible use in articles that appear in Navellier & Associates weekly Market Mail. Mr. Bodner is not employed or affiliated with Louis Navellier, Navellier & Associates, Inc., or any other Navellier owned entity. The opinions and statements made here are those of Mr. Bodner and not necessarily those of any other persons or entities. This is not an endorsement, or solicitation or testimonial or investment advice regarding the BMI Index or any statements or recommendations or analysis in the article or the BMI Index or Mapsignals or its products or strategies.
Although information in these reports has been obtained from and is based upon sources that Navellier believes to be reliable, Navellier does not guarantee its accuracy and it may be incomplete or condensed. All opinions and estimates constitute Navellier’s judgment as of the date the report was created and are subject to change without notice. These reports are for informational purposes only and are not a solicitation for the purchase or sale of a security. Any decision to purchase securities mentioned in these reports must take into account existing public information on such securities or any registered prospectus.To the extent permitted by law, neither Navellier & Associates, Inc., nor any of its affiliates, agents, or service providers assumes any liability or responsibility nor owes any duty of care for any consequences of any person acting or refraining to act in reliance on the information contained in this communication or for any decision based on it.
Past performance is no indication of future results. Investment in securities involves significant risk and has the potential for partial or complete loss of funds invested. It should not be assumed that any securities recommendations made by Navellier. in the future will be profitable or equal the performance of securities made in this report. Dividend payments are not guaranteed. The amount of a dividend payment, if any, can vary over time and issuers may reduce dividends paid on securities in the event of a recession or adverse event affecting a specific industry or issuer.
None of the stock information, data, and company information presented herein constitutes a recommendation by Navellier or a solicitation to buy or sell any securities. Any specific securities identified and described do not represent all of the securities purchased, sold, or recommended for advisory clients. The holdings identified do not represent all of the securities purchased, sold, or recommended for advisory clients and the reader should not assume that investments in the securities identified and discussed were or will be profitable.
Information presented is general information that does not take into account your individual circumstances, financial situation, or needs, nor does it present a personalized recommendation to you. Individual stocks presented may not be suitable for every investor. Investment in securities involves significant risk and has the potential for partial or complete loss of funds invested. Investment in fixed income securities has the potential for the investment return and principal value of an investment to fluctuate so that an investor’s holdings, when redeemed, may be worth less than their original cost.
One cannot invest directly in an index. Index is unmanaged and index performance does not reflect deduction of fees, expenses, or taxes. Presentation of Index data does not reflect a belief by Navellier that any stock index constitutes an investment alternative to any Navellier equity strategy or is necessarily comparable to such strategies. Among the most important differences between the Indices and Navellier strategies are that the Navellier equity strategies may (1) incur material management fees, (2) concentrate its investments in relatively few stocks, industries, or sectors, (3) have significantly greater trading activity and related costs, and (4) be significantly more or less volatile than the Indices.
ETF Risk: We may invest in exchange traded funds (“ETFs”) and some of our investment strategies are generally fully invested in ETFs. Like traditional mutual funds, ETFs charge asset-based fees, but they generally do not charge initial sales charges or redemption fees and investors typically pay only customary brokerage fees to buy and sell ETF shares. The fees and costs charged by ETFs held in client accounts will not be deducted from the compensation the client pays Navellier. ETF prices can fluctuate up or down, and a client account could lose money investing in an ETF if the prices of the securities owned by the ETF go down. ETFs are subject to additional risks:
- ETF shares may trade above or below their net asset value;
- An active trading market for an ETF’s shares may not develop or be maintained;
- The value of an ETF may be more volatile than the underlying portfolio of securities the ETF is designed to track;
- The cost of owning shares of the ETF may exceed those a client would incur by directly investing in the underlying securities and;
- Trading of an ETF’s shares may be halted if the listing exchange’s officials deem it appropriate, the shares are delisted from the exchange, or the activation of market-wide “circuit breakers” (which are tied to large decreases in stock prices) halts stock trading generally.
Grader Disclosures: Investment in equity strategies involves substantial risk and has the potential for partial or complete loss of funds invested. The sample portfolio and any accompanying charts are for informational purposes only and are not to be construed as a solicitation to buy or sell any financial instrument and should not be relied upon as the sole factor in an investment making decision. As a matter of normal and important disclosures to you, as a potential investor, please consider the following: The performance presented is not based on any actual securities trading, portfolio, or accounts, and the reported performance of the A, B, C, D, and F portfolios (collectively the “model portfolios”) should be considered mere “paper” or pro forma performance results based on Navellier’s research.
Investors evaluating any of Navellier & Associates, Inc.’s, (or its affiliates’) Investment Products must not use any information presented here, including the performance figures of the model portfolios, in their evaluation of any Navellier Investment Products. Navellier Investment Products include the firm’s mutual funds and managed accounts. The model portfolios, charts, and other information presented do not represent actual funded trades and are not actual funded portfolios. There are material differences between Navellier Investment Products’ portfolios and the model portfolios, research, and performance figures presented here. The model portfolios and the research results (1) may contain stocks or ETFs that are illiquid and difficult to trade; (2) may contain stock or ETF holdings materially different from actual funded Navellier Investment Product portfolios; (3) include the reinvestment of all dividends and other earnings, estimated trading costs, commissions, or management fees; and, (4) may not reflect prices obtained in an actual funded Navellier Investment Product portfolio. For these and other reasons, the reported performances of model portfolios do not reflect the performance results of Navellier’s actually funded and traded Investment Products. In most cases, Navellier’s Investment Products have materially lower performance results than the performances of the model portfolios presented.
This report contains statements that are, or may be considered to be, forward-looking statements. All statements that are not historical facts, including statements about our beliefs or expectations, are “forward-looking statements” within the meaning of The U.S. Private Securities Litigation Reform Act of 1995. These statements may be identified by such forward-looking terminology as “expect,” “estimate,” “plan,” “intend,” “believe,” “anticipate,” “may,” “will,” “should,” “could,” “continue,” “project,” or similar statements or variations of such terms. Our forward-looking statements are based on a series of expectations, assumptions, and projections, are not guarantees of future results or performance, and involve substantial risks and uncertainty as described in Form ADV Part 2A of our filing with the Securities and Exchange Commission (SEC), which is available at www.adviserinfo.sec.gov or by requesting a copy by emailing info@navellier.com. All of our forward-looking statements are as of the date of this report only. We can give no assurance that such expectations or forward-looking statements will prove to be correct. Actual results may differ materially. You are urged to carefully consider all such factors.
FEDERAL TAX ADVICE DISCLAIMER: As required by U.S. Treasury Regulations, you are informed that, to the extent this presentation includes any federal tax advice, the presentation is not written by Navellier to be used, and cannot be used, for the purpose of avoiding federal tax penalties. Navellier does not advise on any income tax requirements or issues. Use of any information presented by Navellier is for general information only and does not represent tax advice either express or implied. You are encouraged to seek professional tax advice for income tax questions and assistance.
IMPORTANT NEWSLETTER DISCLOSURE:The hypothetical performance results for investment newsletters that are authored or edited by Louis Navellier, including Louis Navellier’s Growth Investor, Louis Navellier’s Breakthrough Stocks, Louis Navellier’s Accelerated Profits, and Louis Navellier’s Platinum Club, are not based on any actual securities trading, portfolio, or accounts, and the newsletters’ reported hypothetical performances should be considered mere “paper” or proforma hypothetical performance results and are not actual performance of real world trades. Navellier & Associates, Inc. does not have any relation to or affiliation with the owner of these newsletters. There are material differences between Navellier Investment Products’ portfolios and the InvestorPlace Media, LLC newsletter portfolios authored by Louis Navellier. The InvestorPlace Media, LLC newsletters contain hypothetical performance that do not include transaction costs, advisory fees, or other fees a client might incur if actual investments and trades were being made by an investor. As a result, newsletter performance should not be used to evaluate Navellier Investment services which are separate and different from the newsletters. The owner of the newsletters is InvestorPlace Media, LLC and any questions concerning the newsletters, including any newsletter advertising or hypothetical Newsletter performance claims, (which are calculated solely by Investor Place Media and not Navellier) should be referred to InvestorPlace Media, LLC at (800) 718-8289.
Please note that Navellier & Associates and the Navellier Private Client Group are managed completely independent of the newsletters owned and published by InvestorPlace Media, LLC and written and edited by Louis Navellier, and investment performance of the newsletters should in no way be considered indicative of potential future investment performance for any Navellier & Associates separately managed account portfolio. Potential investors should consult with their financial advisor before investing in any Navellier Investment Product.
Navellier claims compliance with Global Investment Performance Standards (GIPS). To receive a complete list and descriptions of Navellier’s composites and/or a presentation that adheres to the GIPS standards, please contact Navellier or click here. It should not be assumed that any securities recommendations made by Navellier & Associates, Inc. in the future will be profitable or equal the performance of securities made in this report.
FactSet Disclosure: Navellier does not independently calculate the statistical information included in the attached report. The calculation and the information are provided by FactSet, a company not related to Navellier. Although information contained in the report has been obtained from FactSet and is based on sources Navellier believes to be reliable, Navellier does not guarantee its accuracy, and it may be incomplete or condensed. The report and the related FactSet sourced information are provided on an “as is” basis. The user assumes the entire risk of any use made of this information. Investors should consider the report as only a single factor in making their investment decision. The report is for informational purposes only and is not intended as an offer or solicitation for the purchase or sale of a security. FactSet sourced information is the exclusive property of FactSet. Without prior written permission of FactSet, this information may not be reproduced, disseminated or used to create any financial products. All indices are unmanaged and performance of the indices include reinvestment of dividends and interest income, unless otherwise noted, are not illustrative of any particular investment and an investment cannot be made in any index. Past performance is no guarantee of future results.