by Bryan Perry
July 23, 2024
This past week saw the stock market take on an entirely different tone than what had dominated the first half of July. Following the shooting at President Trump and a Republican National Convention that propelled Trump into a wider lead in the race for the White House, fresh fears of trade relations with China and the possibility of a new round of tariffs hit the all-important technology sector in a large way.
A softer-than-forecast third quarter guide from a Dutch chip equipment maker punished the semiconductor equipment sector, even as the company reported record bookings that will ramp up sales in the fourth quarter. Again, the sell-off was driven more by growing concerns of export tariffs under a Trump administration coming at a time when many portfolio managers are vacationing.
It didn’t help matters that a global meltdown of Windows operating systems stemming from a software upgrade brought major disruptions at airports around the world. Emergency management systems could not function properly, so media companies and financial institutions had their normal business operations disrupted and the bearish momentum just built on itself with a market devoid of any new bullish catalysts.
And then came Sunday’s shocking (but ultimately inevitable) news that President Biden will not run for re-election, followed by his full support behind Vice President Kamala Harris. Apparently, the ongoing pressure by senior Democratic leaders and big donors forced his inevitable decision to change course.
How the market reacts to this news will unfold this week, but it seems as if this leadership change was already priced into the market. As it stands, the Democratic Party could still hold a “mini-primary,” if the powers-that-be are not behind Harris, and investors will probably anticipate any such plans this week.
Aside from this volatile political landscape, bond traders are now more confident that that Fed will find a way to cut rates not just in September, but also in November and December. This perception caught a strong tailwind in July, not just by rewarding small-cap stocks, but also in real estate, utilities, industrials, materials, staples and financials. While big-cap technology is consolidating, most of this year’s neglected sectors caught a strong bid. For the second week in a row, the equal-weight S&P 500 beat its cap-weight peer.
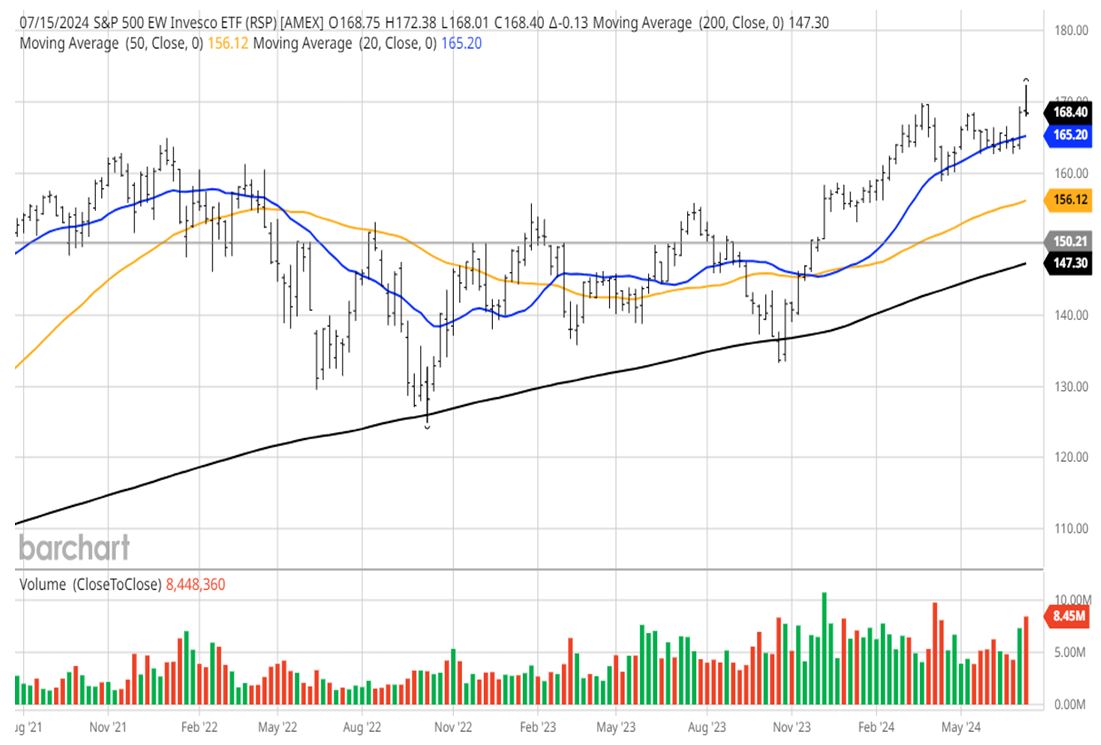
Graphs are for illustrative and discussion purposes only. Please read important disclosures at the end of this commentary.
The bulls are now looking to benefit from a few upside catalysts over the next two weeks, including a parade of blue-chip earnings reports that includes most of the mega-cap technology companies that have powered the market higher year-to-date on the back of a tsunami of capital investment into AI products and services. This backdrop for a robust earnings season is supported by the Atlanta Fed’s GDPNow model projecting second-quarter real GDP growth rising to a 2.7% annual rate, up from a 1.4% pace in the first quarter. Regardless of politics, growth is growth, and that is what the stock market likes most.
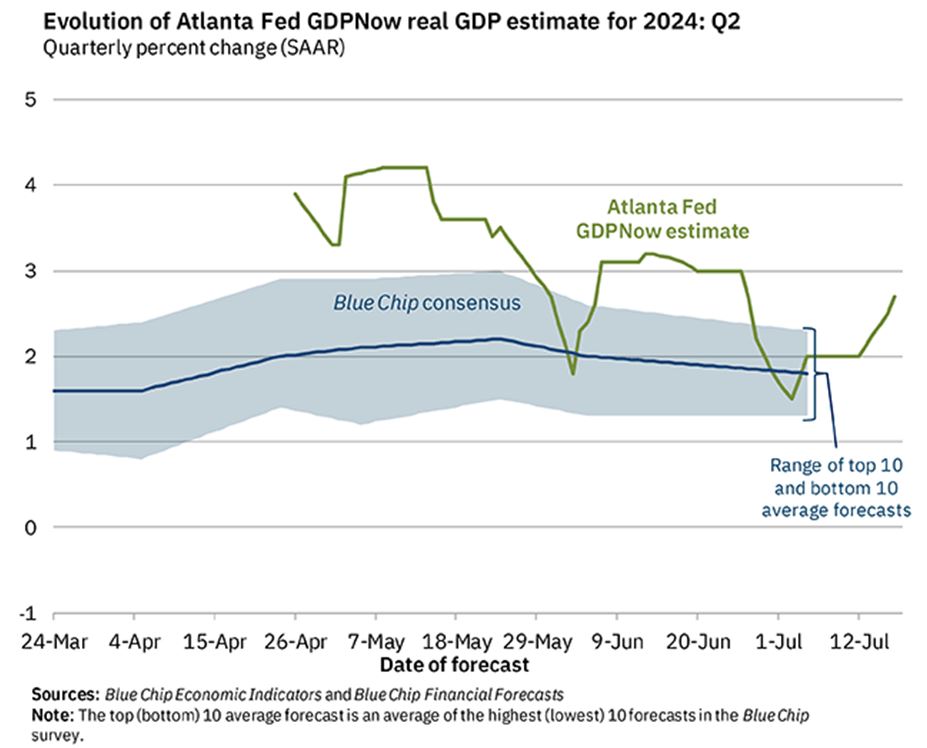
Graphs are for illustrative and discussion purposes only. Please read important disclosures at the end of this commentary.
Later this week, the Fed’s favorite inflation indicator, the June Personal Consumer Expenditures (PCE) index, will be released, with the Street looking for a 0.1% rise, and 0.2% on the Core PCE number. With summer almost half gone, it is good to see the national average price of gasoline already trending lower.
Despite the turmoil in the Middle East and the extended production cuts by OPEC+ nations, WTI crude prices have declined to $80, from $84 per barrel on July 3. This would imply cheaper gas prices in the months ahead, being that gas prices always lag oil prices on the way down.
The University of Michigan Consumer Confidence Survey is also due out this Friday. Considering the new-found anticipation of future rate cuts being priced into the bond market and a low inflation reading for June, this latest slide in gas prices should deliver an improving consumer sentiment reading this week.
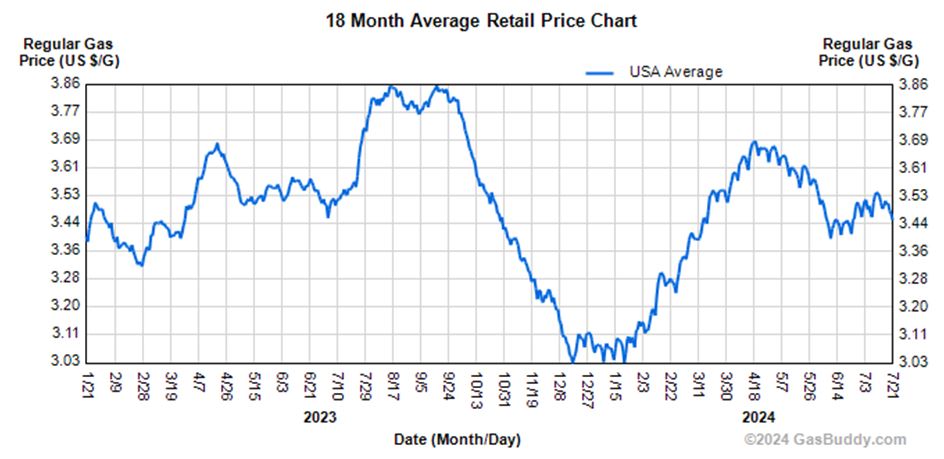
Graphs are for illustrative and discussion purposes only. Please read important disclosures at the end of this commentary.
While it is all well and good that the market has broadened out, there is no getting around the fact that the Magnificent Seven still own the leadership role for the S&P 500 and NASDAQ. The top 10 stocks of the S&P 500 make up over 35% of its total capitalization and the top 10 in the NASDAQ 100 make up over 50% of its market cap, while the Mag 7 stocks are part the top 10 holdings in both indexes. What is highly attractive about this pre-earnings season set-up is that all the Mag 7 stocks have pulled back well off their early July highs and are now oversold, by most technical indicators, going into this earnings season.
This is the time for the technology sector to shine and retake its rightful place as the market’s torch bearer. The recent selling pressure in the Mag 7 stocks resulted in a collective loss of $1.13 trillion in market capitalization over five trading sessions last week, the biggest loss since May 2022.
Given all the wild events that have transpired over the past several days, investors are due for some good news in the form of strong sales, earnings, and bullish guidance from these companies whose stocks matter most to the bull trend. It is time for America’s technology titans to shine, and it’s a good bet they will.
Graphs are for illustrative and discussion purposes only. Please read important disclosures at the end of this commentary.
All content above represents the opinion of Bryan Perry of Navellier & Associates, Inc.
Also In This Issue
A Look Ahead by Louis Navellier
The Best Tech and Energy Stocks Should Remain Strong
Income Mail by Bryan Perry
Riding Out Summer Volatility with the “Mag 7” Earnings on Deck
Growth Mail by Gary Alexander
“Mr. Powell, Tear Down This Interest Rate Wall!”
Global Mail by Ivan Martchev
It is Starting to Look like an Intermediate-Term Sell-Off
Sector Spotlight by Jason Bodner
Here’s Your “X-Ray Vision” Key to the Market
View Full Archive
Read Past Issues Here

Bryan Perry
SENIOR DIRECTOR
Bryan Perry is a Senior Director with Navellier Private Client Group, advising and facilitating high net worth investors in the pursuit of their financial goals.
Bryan’s financial services career spanning the past three decades includes over 20 years of wealth management experience with Wall Street firms that include Bear Stearns, Lehman Brothers and Paine Webber, working with both retail and institutional clients. Bryan earned a B.A. in Political Science from Virginia Polytechnic Institute & State University and currently holds a Series 65 license. All content of “Income Mail” represents the opinion of Bryan Perry
Important Disclosures:
Although information in these reports has been obtained from and is based upon sources that Navellier believes to be reliable, Navellier does not guarantee its accuracy and it may be incomplete or condensed. All opinions and estimates constitute Navellier’s judgment as of the date the report was created and are subject to change without notice. These reports are for informational purposes only and are not a solicitation for the purchase or sale of a security. Any decision to purchase securities mentioned in these reports must take into account existing public information on such securities or any registered prospectus.To the extent permitted by law, neither Navellier & Associates, Inc., nor any of its affiliates, agents, or service providers assumes any liability or responsibility nor owes any duty of care for any consequences of any person acting or refraining to act in reliance on the information contained in this communication or for any decision based on it.
Past performance is no indication of future results. Investment in securities involves significant risk and has the potential for partial or complete loss of funds invested. It should not be assumed that any securities recommendations made by Navellier. in the future will be profitable or equal the performance of securities made in this report. Dividend payments are not guaranteed. The amount of a dividend payment, if any, can vary over time and issuers may reduce dividends paid on securities in the event of a recession or adverse event affecting a specific industry or issuer.
None of the stock information, data, and company information presented herein constitutes a recommendation by Navellier or a solicitation to buy or sell any securities. Any specific securities identified and described do not represent all of the securities purchased, sold, or recommended for advisory clients. The holdings identified do not represent all of the securities purchased, sold, or recommended for advisory clients and the reader should not assume that investments in the securities identified and discussed were or will be profitable.
Information presented is general information that does not take into account your individual circumstances, financial situation, or needs, nor does it present a personalized recommendation to you. Individual stocks presented may not be suitable for every investor. Investment in securities involves significant risk and has the potential for partial or complete loss of funds invested. Investment in fixed income securities has the potential for the investment return and principal value of an investment to fluctuate so that an investor’s holdings, when redeemed, may be worth less than their original cost.
One cannot invest directly in an index. Index is unmanaged and index performance does not reflect deduction of fees, expenses, or taxes. Presentation of Index data does not reflect a belief by Navellier that any stock index constitutes an investment alternative to any Navellier equity strategy or is necessarily comparable to such strategies. Among the most important differences between the Indices and Navellier strategies are that the Navellier equity strategies may (1) incur material management fees, (2) concentrate its investments in relatively few stocks, industries, or sectors, (3) have significantly greater trading activity and related costs, and (4) be significantly more or less volatile than the Indices.
ETF Risk: We may invest in exchange traded funds (“ETFs”) and some of our investment strategies are generally fully invested in ETFs. Like traditional mutual funds, ETFs charge asset-based fees, but they generally do not charge initial sales charges or redemption fees and investors typically pay only customary brokerage fees to buy and sell ETF shares. The fees and costs charged by ETFs held in client accounts will not be deducted from the compensation the client pays Navellier. ETF prices can fluctuate up or down, and a client account could lose money investing in an ETF if the prices of the securities owned by the ETF go down. ETFs are subject to additional risks:
- ETF shares may trade above or below their net asset value;
- An active trading market for an ETF’s shares may not develop or be maintained;
- The value of an ETF may be more volatile than the underlying portfolio of securities the ETF is designed to track;
- The cost of owning shares of the ETF may exceed those a client would incur by directly investing in the underlying securities; and
- Trading of an ETF’s shares may be halted if the listing exchange’s officials deem it appropriate, the shares are delisted from the exchange, or the activation of market-wide “circuit breakers” (which are tied to large decreases in stock prices) halts stock trading generally.
Grader Disclosures: Investment in equity strategies involves substantial risk and has the potential for partial or complete loss of funds invested. The sample portfolio and any accompanying charts are for informational purposes only and are not to be construed as a solicitation to buy or sell any financial instrument and should not be relied upon as the sole factor in an investment making decision. As a matter of normal and important disclosures to you, as a potential investor, please consider the following: The performance presented is not based on any actual securities trading, portfolio, or accounts, and the reported performance of the A, B, C, D, and F portfolios (collectively the “model portfolios”) should be considered mere “paper” or pro forma performance results based on Navellier’s research.
Investors evaluating any of Navellier & Associates, Inc.’s, (or its affiliates’) Investment Products must not use any information presented here, including the performance figures of the model portfolios, in their evaluation of any Navellier Investment Products. Navellier Investment Products include the firm’s mutual funds and managed accounts. The model portfolios, charts, and other information presented do not represent actual funded trades and are not actual funded portfolios. There are material differences between Navellier Investment Products’ portfolios and the model portfolios, research, and performance figures presented here. The model portfolios and the research results (1) may contain stocks or ETFs that are illiquid and difficult to trade; (2) may contain stock or ETF holdings materially different from actual funded Navellier Investment Product portfolios; (3) include the reinvestment of all dividends and other earnings, estimated trading costs, commissions, or management fees; and, (4) may not reflect prices obtained in an actual funded Navellier Investment Product portfolio. For these and other reasons, the reported performances of model portfolios do not reflect the performance results of Navellier’s actually funded and traded Investment Products. In most cases, Navellier’s Investment Products have materially lower performance results than the performances of the model portfolios presented.
This report contains statements that are, or may be considered to be, forward-looking statements. All statements that are not historical facts, including statements about our beliefs or expectations, are “forward-looking statements” within the meaning of The U.S. Private Securities Litigation Reform Act of 1995. These statements may be identified by such forward-looking terminology as “expect,” “estimate,” “plan,” “intend,” “believe,” “anticipate,” “may,” “will,” “should,” “could,” “continue,” “project,” or similar statements or variations of such terms. Our forward-looking statements are based on a series of expectations, assumptions, and projections, are not guarantees of future results or performance, and involve substantial risks and uncertainty as described in Form ADV Part 2A of our filing with the Securities and Exchange Commission (SEC), which is available at www.adviserinfo.sec.gov or by requesting a copy by emailing info@navellier.com. All of our forward-looking statements are as of the date of this report only. We can give no assurance that such expectations or forward-looking statements will prove to be correct. Actual results may differ materially. You are urged to carefully consider all such factors.
FEDERAL TAX ADVICE DISCLAIMER: As required by U.S. Treasury Regulations, you are informed that, to the extent this presentation includes any federal tax advice, the presentation is not written by Navellier to be used, and cannot be used, for the purpose of avoiding federal tax penalties. Navellier does not advise on any income tax requirements or issues. Use of any information presented by Navellier is for general information only and does not represent tax advice either express or implied. You are encouraged to seek professional tax advice for income tax questions and assistance.
IMPORTANT NEWSLETTER DISCLOSURE:The hypothetical performance results for investment newsletters that are authored or edited by Louis Navellier, including Louis Navellier’s Growth Investor, Louis Navellier’s Breakthrough Stocks, Louis Navellier’s Accelerated Profits, and Louis Navellier’s Platinum Club, are not based on any actual securities trading, portfolio, or accounts, and the newsletters’ reported hypothetical performances should be considered mere “paper” or proforma hypothetical performance results and are not actual performance of real world trades. Navellier & Associates, Inc. does not have any relation to or affiliation with the owner of these newsletters. There are material differences between Navellier Investment Products’ portfolios and the InvestorPlace Media, LLC newsletter portfolios authored by Louis Navellier. The InvestorPlace Media, LLC newsletters contain hypothetical performance that do not include transaction costs, advisory fees, or other fees a client might incur if actual investments and trades were being made by an investor. As a result, newsletter performance should not be used to evaluate Navellier Investment services which are separate and different from the newsletters. The owner of the newsletters is InvestorPlace Media, LLC and any questions concerning the newsletters, including any newsletter advertising or hypothetical Newsletter performance claims, (which are calculated solely by Investor Place Media and not Navellier) should be referred to InvestorPlace Media, LLC at (800) 718-8289.
Please note that Navellier & Associates and the Navellier Private Client Group are managed completely independent of the newsletters owned and published by InvestorPlace Media, LLC and written and edited by Louis Navellier, and investment performance of the newsletters should in no way be considered indicative of potential future investment performance for any Navellier & Associates separately managed account portfolio. Potential investors should consult with their financial advisor before investing in any Navellier Investment Product.
Navellier claims compliance with Global Investment Performance Standards (GIPS). To receive a complete list and descriptions of Navellier’s composites and/or a presentation that adheres to the GIPS standards, please contact Navellier or click here. It should not be assumed that any securities recommendations made by Navellier & Associates, Inc. in the future will be profitable or equal the performance of securities made in this report.
FactSet Disclosure: Navellier does not independently calculate the statistical information included in the attached report. The calculation and the information are provided by FactSet, a company not related to Navellier. Although information contained in the report has been obtained from FactSet and is based on sources Navellier believes to be reliable, Navellier does not guarantee its accuracy, and it may be incomplete or condensed. The report and the related FactSet sourced information are provided on an “as is” basis. The user assumes the entire risk of any use made of this information. Investors should consider the report as only a single factor in making their investment decision. The report is for informational purposes only and is not intended as an offer or solicitation for the purchase or sale of a security. FactSet sourced information is the exclusive property of FactSet. Without prior written permission of FactSet, this information may not be reproduced, disseminated or used to create any financial products. All indices are unmanaged and performance of the indices include reinvestment of dividends and interest income, unless otherwise noted, are not illustrative of any particular investment and an investment cannot be made in any index. Past performance is no guarantee of future results.