by Bryan Perry
June 25, 2024
The financial media and some Wall Street gurus are banging a drum to say that the AI trade is overpriced – or priced way ahead of expectations – as to what this once in a lifetime secular theme will deliver to investors, ever since the AI-led tech rally hit the “pause” button last week. As the month of June got underway, bond yields fell on softer inflation data, and mega-cap AI growth stocks surged to new highs, admittedly reaching overbought technical levels that have given way to some short-term profit taking.
This recent round of consolidation in the leading AI names is highly constructive for new buyers. Big parabolic moves higher leave huge gaps underneath that result in more volatile pullbacks that create doubt in the minds of investors about the longevity of a stock’s uptrend. Quite frankly, I am pleased to see how the top 10 AI stocks have been trading in the past week, giving back some of the FOMO-like moves that were fueled by massive options trading and leverage. Hot growth stocks take the stairway up to new highs, then take the elevator down to rising support trend-lines. The moves up and down can be stunning.
The AI trade is fueling what is arguably one of the most hated stock rallies of all time – hated by some fund managers, that is, because they simply have not embraced what is happening within the greatest capital spending cycle in history. Some famous Wall Street Chief Investment Officers (CIOs) called for a recession in 2024, and like the Pied Piper, they scared over $6 trillion into money markets and short-term instruments, while the AI-rich NASDAQ has rallied in the past nine months, fueled by eye-popping forecasts for capital spending in AI-driven applications, equipment, data centers, networks and all types of devices.
For market veterans that respect technical analysis, the recent price action has been volatile enough to shake out a lot of hot and leveraged trading money while allowing professional fund managers and retail investors an opportunity to initiate and add to positions in top-rated AI stocks at attractive entry points.
Graphs are for illustrative and discussion purposes only. Please read important disclosures at the end of this commentary.
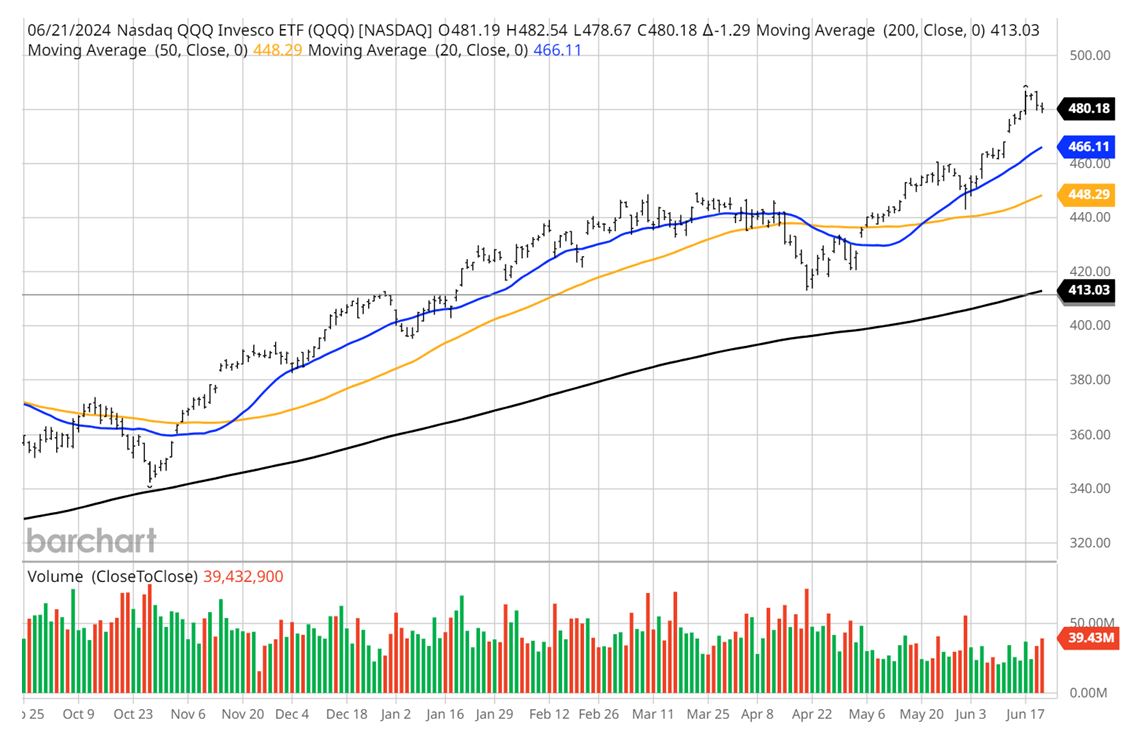
From the chart above, I would infer that there is potential for another 6% downside that would test the 50-day moving average (orange line). From there, the heart of earnings season is just one month away, and that is sure to bring its own set of post-July 4th market fireworks, making the present period of consolidation an appealing time to pick up some great AI stocks on sizeable dips
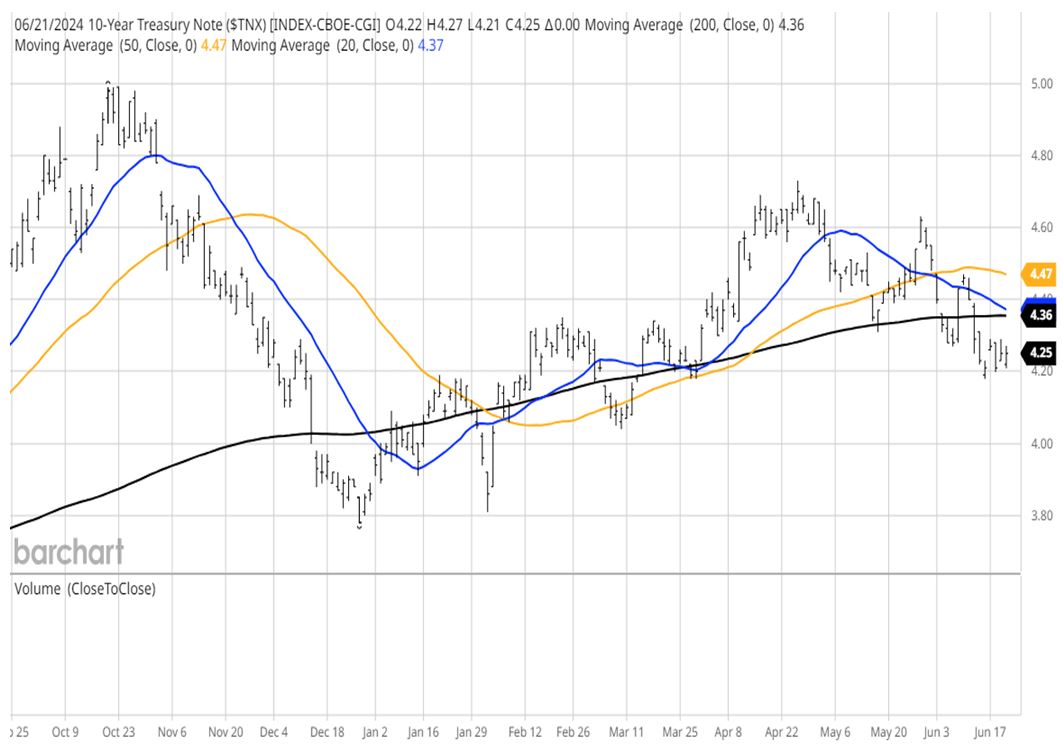
Looking at this nine-month chart, we can see where this rally kicked into high gear when traders assumed that 3-4 future Fed rate cuts were in the cards. This 33% rally in the S&P 500 paused during the April timeframe, when inflation data came in hotter-than-forecast. From the chart below, the yield on the 10-year Treasury gapped to 4.75% from 4.20% during the same time, when the S&P 500 gave back 7.7%.
Graphs are for illustrative and discussion purposes only. Please read important disclosures at the end of this commentary.
During this garden variety pullback, there were some key developer conferences that fortified the message the AI bulls have been shouting from the hilltops – this is the biggest advance in technology of all time. The Alphabet I/O Conference held May 14, the NVIDIA GTC Conference held the week of May 22, the Microsoft Build Conference held May 24-25, and Apple’s Worldwide Developers Conference from June 10-14 collectively planted the flag for the next leg up for the biggest AI-centric stocks.
When the bond market regained its footing on the back of several softer-than-forecasted economic reports, coupled with the first interest rate cuts coming from the Bank of Canada and the European Central Bank, it was a green light for stock investors, so the rally in mega-cap AI stocks was back on, following a healthy month of consolidation, taking the NASDAQ and S&P 500 to new all-time highs.
Last week saw some very constructive technical backing-and-filling for best-of-breed AI stocks that fall into several categories – Graphics Processing Units (GPUs), Application Programming Interfaces (APIs), generative AI software, memory storage, hard drives, liquid cooled servers and end user products that are just now on the cusp of a global refresh cycle for PCs and wireless devices to include AI functionality.
It all starts with AI infrastructure, also called the AI stack, which refers to the integrated hardware and software environment that supports artificial intelligence and machine learning (ML) workloads. The AI stack includes software, hardware, and networks that are essential to build and deploy AI-powered applications. There are six basic components of artificial intelligence infrastructure that investors need to consider when researching which stocks to invest in to get the fullest exposure to the AI revolution:
- Computational power
- Networking and connectivity frameworks
- Data handling and storage solutions
- Data processing frameworks
- Security and compliance
- Machine learning operations (MLOps)
Source: AI Infrastructure: a comprehensive guide to building your AI stack | Future Processing (future-processing com).
To understand the future of demand for AI, a recent survey stated that 83% of companies polled claim that using AI in their business is a top priority. This widespread commitment to applying AI by U.S. and global companies continues to demonstrate the potential size of the market being created over the next 3-5 years, making for what should be a fine time to accumulate portfolios in a very healthy manner.

Graphs are for illustrative and discussion purposes only. Please read important disclosures at the end of this commentary.
Stock picking for AI winners is key to staying on top of how best to maximize one’s dollars invested into the whole AI experience. There are likely to be a few lead changes in this horse race over the next few years. The Invesco QQQ Trust ETF (QQQ) does a splendid job of positioning a few of the best of breed AI stocks within their Top 10 Holdings, accounting for 46% of the fund’s total weighting. There are also about a dozen ETFs with a 100% focus on AI which offer a nice blend of exposure to all the sub-sectors.
Navellier & Associates owns Nvidia Corp (NVDA), Microsoft Corp (MSFT), Alphabet Inc. Class A (GOOGL), and some accounts own Apple Computer (AAPL), in managed accounts. Bryan Perry personally owns Nvidia Corp (NVDA), Microsoft Corp (MSFT), and Alphabet Inc. Class A (GOOGL), but does not own Apple Computer (AAPL).
All content above represents the opinion of Bryan Perry of Navellier & Associates, Inc.
Also In This Issue
A Look Ahead by Louis Navellier
Bond Traders (Not the Fed) Control Interest Rates
Income Mail by Bryan Perry
The Torrid AI Rally Takes a “Pause That Refreshes”
Growth Mail by Gary Alexander
Keep Investing – Even During World War III
Global Mail by Ivan Martchev
More European Political Fireworks Are Coming
Sector Spotlight by Jason Bodner
Try Not to Track Stock Prices Daily
View Full Archive
Read Past Issues Here

Bryan Perry
SENIOR DIRECTOR
Bryan Perry is a Senior Director with Navellier Private Client Group, advising and facilitating high net worth investors in the pursuit of their financial goals.
Bryan’s financial services career spanning the past three decades includes over 20 years of wealth management experience with Wall Street firms that include Bear Stearns, Lehman Brothers and Paine Webber, working with both retail and institutional clients. Bryan earned a B.A. in Political Science from Virginia Polytechnic Institute & State University and currently holds a Series 65 license. All content of “Income Mail” represents the opinion of Bryan Perry
Important Disclosures:
Although information in these reports has been obtained from and is based upon sources that Navellier believes to be reliable, Navellier does not guarantee its accuracy and it may be incomplete or condensed. All opinions and estimates constitute Navellier’s judgment as of the date the report was created and are subject to change without notice. These reports are for informational purposes only and are not a solicitation for the purchase or sale of a security. Any decision to purchase securities mentioned in these reports must take into account existing public information on such securities or any registered prospectus.To the extent permitted by law, neither Navellier & Associates, Inc., nor any of its affiliates, agents, or service providers assumes any liability or responsibility nor owes any duty of care for any consequences of any person acting or refraining to act in reliance on the information contained in this communication or for any decision based on it.
Past performance is no indication of future results. Investment in securities involves significant risk and has the potential for partial or complete loss of funds invested. It should not be assumed that any securities recommendations made by Navellier. in the future will be profitable or equal the performance of securities made in this report. Dividend payments are not guaranteed. The amount of a dividend payment, if any, can vary over time and issuers may reduce dividends paid on securities in the event of a recession or adverse event affecting a specific industry or issuer.
None of the stock information, data, and company information presented herein constitutes a recommendation by Navellier or a solicitation to buy or sell any securities. Any specific securities identified and described do not represent all of the securities purchased, sold, or recommended for advisory clients. The holdings identified do not represent all of the securities purchased, sold, or recommended for advisory clients and the reader should not assume that investments in the securities identified and discussed were or will be profitable.
Information presented is general information that does not take into account your individual circumstances, financial situation, or needs, nor does it present a personalized recommendation to you. Individual stocks presented may not be suitable for every investor. Investment in securities involves significant risk and has the potential for partial or complete loss of funds invested. Investment in fixed income securities has the potential for the investment return and principal value of an investment to fluctuate so that an investor’s holdings, when redeemed, may be worth less than their original cost.
One cannot invest directly in an index. Index is unmanaged and index performance does not reflect deduction of fees, expenses, or taxes. Presentation of Index data does not reflect a belief by Navellier that any stock index constitutes an investment alternative to any Navellier equity strategy or is necessarily comparable to such strategies. Among the most important differences between the Indices and Navellier strategies are that the Navellier equity strategies may (1) incur material management fees, (2) concentrate its investments in relatively few stocks, industries, or sectors, (3) have significantly greater trading activity and related costs, and (4) be significantly more or less volatile than the Indices.
ETF Risk: We may invest in exchange traded funds (“ETFs”) and some of our investment strategies are generally fully invested in ETFs. Like traditional mutual funds, ETFs charge asset-based fees, but they generally do not charge initial sales charges or redemption fees and investors typically pay only customary brokerage fees to buy and sell ETF shares. The fees and costs charged by ETFs held in client accounts will not be deducted from the compensation the client pays Navellier. ETF prices can fluctuate up or down, and a client account could lose money investing in an ETF if the prices of the securities owned by the ETF go down. ETFs are subject to additional risks:
- ETF shares may trade above or below their net asset value;
- An active trading market for an ETF’s shares may not develop or be maintained;
- The value of an ETF may be more volatile than the underlying portfolio of securities the ETF is designed to track;
- The cost of owning shares of the ETF may exceed those a client would incur by directly investing in the underlying securities; and
- Trading of an ETF’s shares may be halted if the listing exchange’s officials deem it appropriate, the shares are delisted from the exchange, or the activation of market-wide “circuit breakers” (which are tied to large decreases in stock prices) halts stock trading generally.
Grader Disclosures: Investment in equity strategies involves substantial risk and has the potential for partial or complete loss of funds invested. The sample portfolio and any accompanying charts are for informational purposes only and are not to be construed as a solicitation to buy or sell any financial instrument and should not be relied upon as the sole factor in an investment making decision. As a matter of normal and important disclosures to you, as a potential investor, please consider the following: The performance presented is not based on any actual securities trading, portfolio, or accounts, and the reported performance of the A, B, C, D, and F portfolios (collectively the “model portfolios”) should be considered mere “paper” or pro forma performance results based on Navellier’s research.
Investors evaluating any of Navellier & Associates, Inc.’s, (or its affiliates’) Investment Products must not use any information presented here, including the performance figures of the model portfolios, in their evaluation of any Navellier Investment Products. Navellier Investment Products include the firm’s mutual funds and managed accounts. The model portfolios, charts, and other information presented do not represent actual funded trades and are not actual funded portfolios. There are material differences between Navellier Investment Products’ portfolios and the model portfolios, research, and performance figures presented here. The model portfolios and the research results (1) may contain stocks or ETFs that are illiquid and difficult to trade; (2) may contain stock or ETF holdings materially different from actual funded Navellier Investment Product portfolios; (3) include the reinvestment of all dividends and other earnings, estimated trading costs, commissions, or management fees; and, (4) may not reflect prices obtained in an actual funded Navellier Investment Product portfolio. For these and other reasons, the reported performances of model portfolios do not reflect the performance results of Navellier’s actually funded and traded Investment Products. In most cases, Navellier’s Investment Products have materially lower performance results than the performances of the model portfolios presented.
This report contains statements that are, or may be considered to be, forward-looking statements. All statements that are not historical facts, including statements about our beliefs or expectations, are “forward-looking statements” within the meaning of The U.S. Private Securities Litigation Reform Act of 1995. These statements may be identified by such forward-looking terminology as “expect,” “estimate,” “plan,” “intend,” “believe,” “anticipate,” “may,” “will,” “should,” “could,” “continue,” “project,” or similar statements or variations of such terms. Our forward-looking statements are based on a series of expectations, assumptions, and projections, are not guarantees of future results or performance, and involve substantial risks and uncertainty as described in Form ADV Part 2A of our filing with the Securities and Exchange Commission (SEC), which is available at www.adviserinfo.sec.gov or by requesting a copy by emailing info@navellier.com. All of our forward-looking statements are as of the date of this report only. We can give no assurance that such expectations or forward-looking statements will prove to be correct. Actual results may differ materially. You are urged to carefully consider all such factors.
FEDERAL TAX ADVICE DISCLAIMER: As required by U.S. Treasury Regulations, you are informed that, to the extent this presentation includes any federal tax advice, the presentation is not written by Navellier to be used, and cannot be used, for the purpose of avoiding federal tax penalties. Navellier does not advise on any income tax requirements or issues. Use of any information presented by Navellier is for general information only and does not represent tax advice either express or implied. You are encouraged to seek professional tax advice for income tax questions and assistance.
IMPORTANT NEWSLETTER DISCLOSURE:The hypothetical performance results for investment newsletters that are authored or edited by Louis Navellier, including Louis Navellier’s Growth Investor, Louis Navellier’s Breakthrough Stocks, Louis Navellier’s Accelerated Profits, and Louis Navellier’s Platinum Club, are not based on any actual securities trading, portfolio, or accounts, and the newsletters’ reported hypothetical performances should be considered mere “paper” or proforma hypothetical performance results and are not actual performance of real world trades. Navellier & Associates, Inc. does not have any relation to or affiliation with the owner of these newsletters. There are material differences between Navellier Investment Products’ portfolios and the InvestorPlace Media, LLC newsletter portfolios authored by Louis Navellier. The InvestorPlace Media, LLC newsletters contain hypothetical performance that do not include transaction costs, advisory fees, or other fees a client might incur if actual investments and trades were being made by an investor. As a result, newsletter performance should not be used to evaluate Navellier Investment services which are separate and different from the newsletters. The owner of the newsletters is InvestorPlace Media, LLC and any questions concerning the newsletters, including any newsletter advertising or hypothetical Newsletter performance claims, (which are calculated solely by Investor Place Media and not Navellier) should be referred to InvestorPlace Media, LLC at (800) 718-8289.
Please note that Navellier & Associates and the Navellier Private Client Group are managed completely independent of the newsletters owned and published by InvestorPlace Media, LLC and written and edited by Louis Navellier, and investment performance of the newsletters should in no way be considered indicative of potential future investment performance for any Navellier & Associates separately managed account portfolio. Potential investors should consult with their financial advisor before investing in any Navellier Investment Product.
Navellier claims compliance with Global Investment Performance Standards (GIPS). To receive a complete list and descriptions of Navellier’s composites and/or a presentation that adheres to the GIPS standards, please contact Navellier or click here. It should not be assumed that any securities recommendations made by Navellier & Associates, Inc. in the future will be profitable or equal the performance of securities made in this report.
FactSet Disclosure: Navellier does not independently calculate the statistical information included in the attached report. The calculation and the information are provided by FactSet, a company not related to Navellier. Although information contained in the report has been obtained from FactSet and is based on sources Navellier believes to be reliable, Navellier does not guarantee its accuracy, and it may be incomplete or condensed. The report and the related FactSet sourced information are provided on an “as is” basis. The user assumes the entire risk of any use made of this information. Investors should consider the report as only a single factor in making their investment decision. The report is for informational purposes only and is not intended as an offer or solicitation for the purchase or sale of a security. FactSet sourced information is the exclusive property of FactSet. Without prior written permission of FactSet, this information may not be reproduced, disseminated or used to create any financial products. All indices are unmanaged and performance of the indices include reinvestment of dividends and interest income, unless otherwise noted, are not illustrative of any particular investment and an investment cannot be made in any index. Past performance is no guarantee of future results.