by Jason Bodner
June 11, 2024
Why do you invest?
People like to spend their money on different things. Some like watches, cars, and homes. Some enjoy accumulating and not spending. Some like to give; others just want to win the game of having the most.
Pablo Escobar, who made Forbes’ top 100 billionaire’s list seven times, once burned $2 million in cash, just to keep his daughter warm. A noble thought, until you recall he was a drug lord and narco-terrorist.
As for me, I’m more of an experience junky. When my last day comes, I will have tried all I wanted to try. As I write this, I’m in Barcelona, Spain with my family. Eventually, our children will splinter off, and yet I feel we will still have at least a few weeks a year together for travel and vacations as life goes on.
Naturally that requires money, so I sold some investments to fund this trip. That is, in part, why I invest.
Whatever your reason, the ultimate goal of investing is the same – to make money.
I’m here to help you achieve that goal, and my method relies exclusively on cold, hard data.
They say you must know where you’ve been to know where you’re going. So, as usual, I will first look at what the data has shown us about the past in order to get a potential glimpse of the possible future.
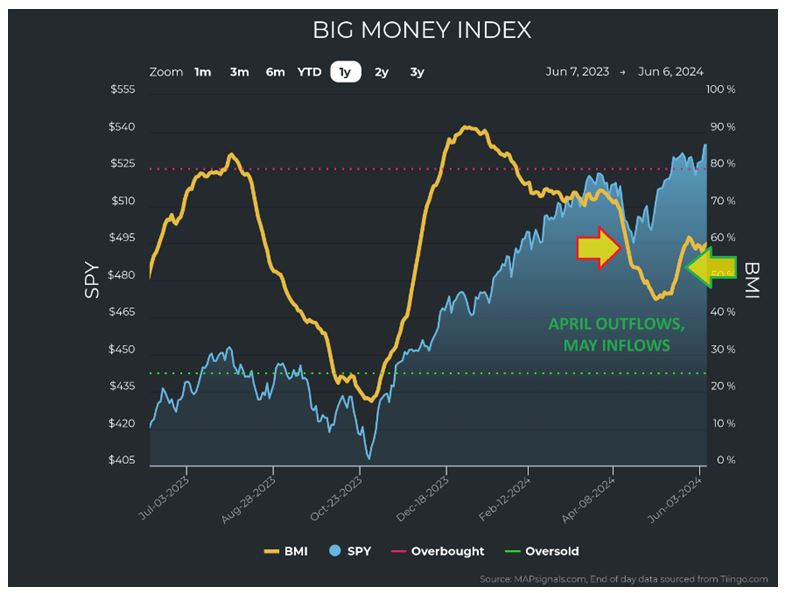
My usual starting point is the Big Money Index (BMI), one of the best money flow indicators I know of. It’s simple: If it rises, Big Money is flowing in. If it falls, big investors are dropping out. April saw money flowing out of stocks but May showed a strong reversion. Early June paused, but we still saw inflows:
Graphs are for illustrative and discussion purposes only. Please read important disclosures at the end of this commentary.
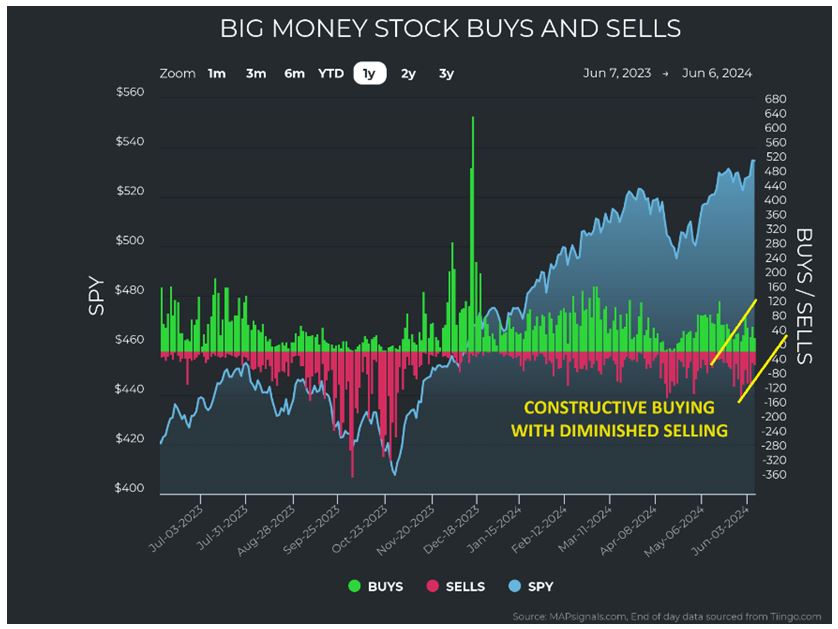
Naturally we should be able to see this trend echoed with real stock buying. This chart shows daily counts for unusually large buying and selling of stocks. As you can see, buying has been strong.
Graphs are for illustrative and discussion purposes only. Please read important disclosures at the end of this commentary.
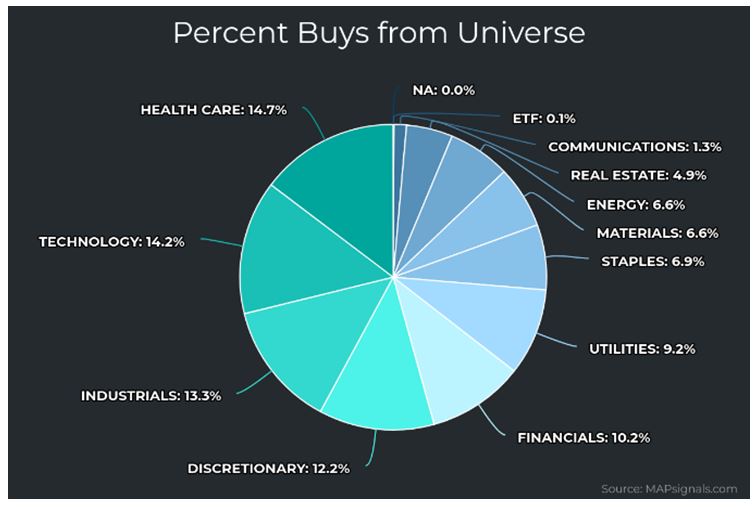
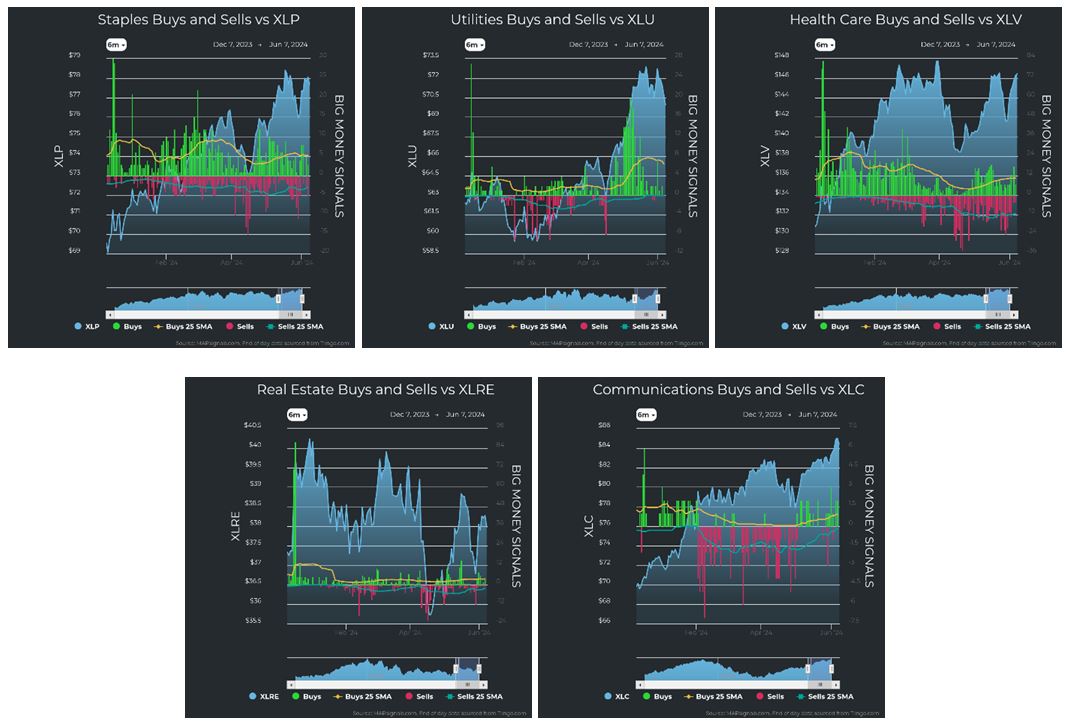
Selling (the red line) was noticeably lower. Looking into more of the details, we can see that the buying was nicely distributed across different sectors. What impressed me most about the following chart is that the growth areas have been under accumulation. Health Care, Technology, Industrial, and Discretionary:
Graphs are for illustrative and discussion purposes only. Please read important disclosures at the end of this commentary.
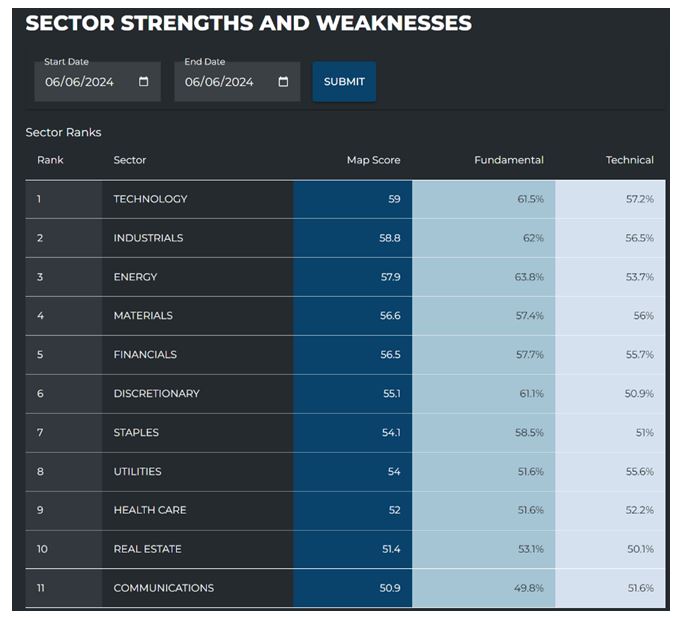
This level of sustained buying, especially in technology stocks, has pushed it into the pole position:
Graphs are for illustrative and discussion purposes only. Please read important disclosures at the end of this commentary.
If we stopped there, life would seem rosy enough, but there has been a darker side in the tech arena. Recently, we have seen the most selling in technology stocks since last October:
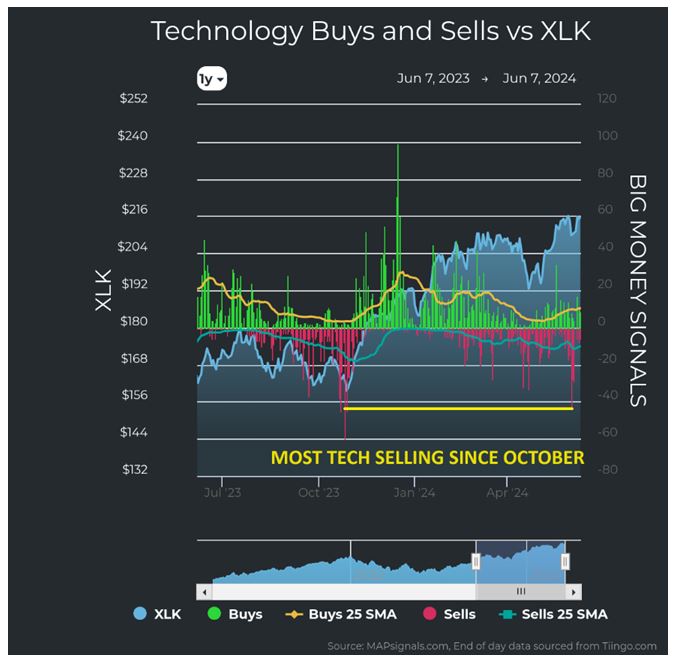
Graphs are for illustrative and discussion purposes only. Please read important disclosures at the end of this commentary.
On May 30th alone, there were 44 tech stocks sold in an unusually large way. The latest catalyst for selling was Salesforce.com (CRM), which released disappointing earnings and guidance. The entire sector took a beating, but specifically the Software Industry group got pummeled. In the last week alone, 74 Software stocks showed unusual buying or selling. A shocking 57 of them were sold in a big way.
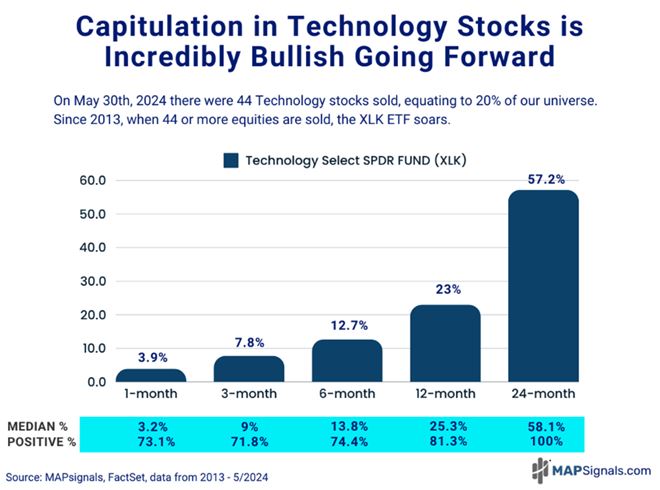
Given that software is a growth engine, that’s a disconcerting perspective and enough to sow the seeds of fear and doubt. That said, there are a couple of things you should know. The first is that my colleague Luke undertook an excellent survey of the sector and found that we’ve seen this kind of technology selling before. It signals capitulation and resignation for technology investors, which is excellent news for the bulls.
His study shows that going back to 2013, there have been 78 days when our data logged 44 or more technology stocks being sold. Here’s the forward returns for XLK after this rare signal:
- 3-months later, XLK ramps up +7.8% on average
- 6-months later, the group surges by 12.7%
- 12-months after, technology shares power 23% higher
- 24-months post this signal, XLK rips 57.2% higher, with a 100% positive hit ratio
Graphs are for illustrative and discussion purposes only. Please read important disclosures at the end of this commentary.
The next thing to know is that not all recent technology trading was selling. There was buying in electronics and even some select software companies too. Here we see the distribution of buying to selling for last week:
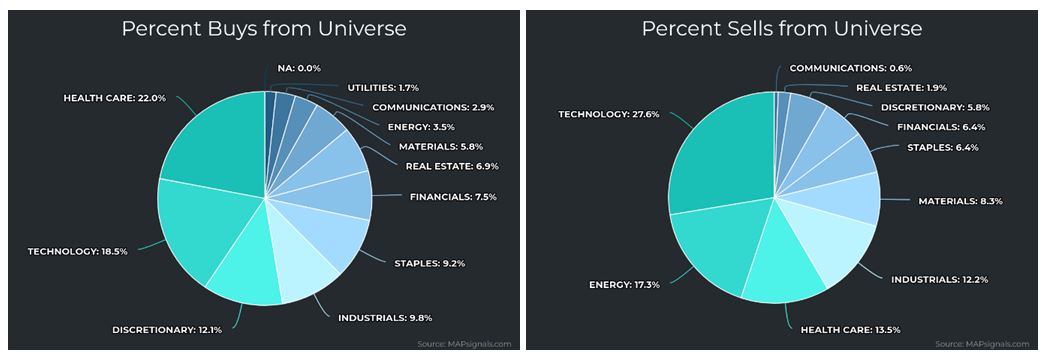
Graphs are for illustrative and discussion purposes only. Please read important disclosures at the end of this commentary.
Also, nearly all sectors look solid across the board. Here we see reasonable buying in most sectors:
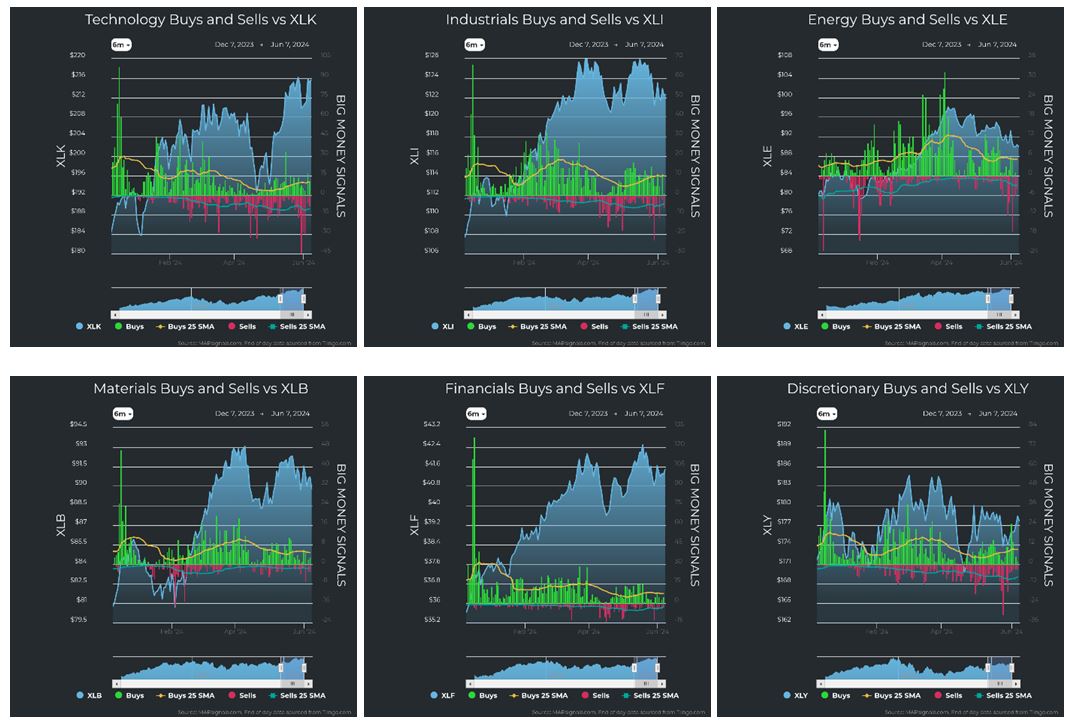
Graphs are for illustrative and discussion purposes only. Please read important disclosures at the end of this commentary.
Overall, things look good and stable. Stocks are at or near all-time highs, but we had technology capitulation that prefaces technology stocks ripping higher. This event, should it come to pass (which it has, 100% of the time, historically speaking) bodes well for stocks. Technology is also historically a major leader during bull markets.
I have some more good news for you. I dug into similar times, like now, for the recent BMI action.
Here you can see that both the BMI and the S&P 500 rose 5 of 10 trading days from May 9th – 21st:
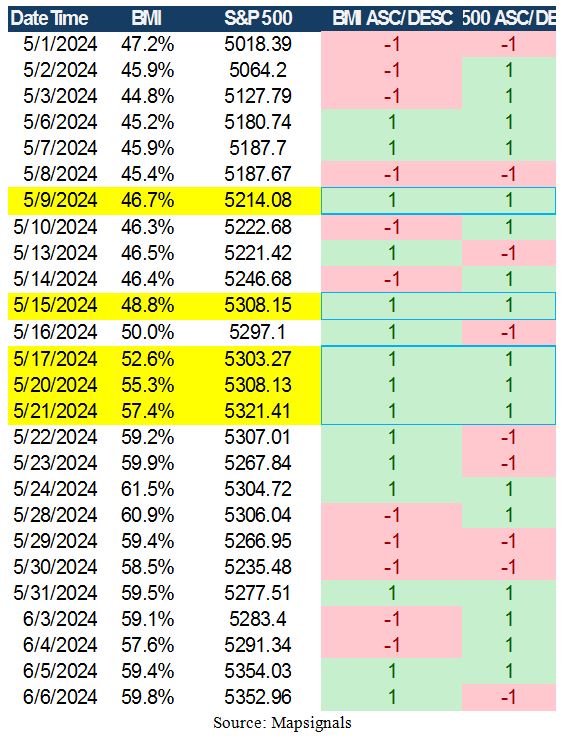
Graphs are for illustrative and discussion purposes only. Please read important disclosures at the end of this commentary.
This setup has happened 577 trading days since 1990 out of 8,648 possible trading days, or only 6.7% of trading days (1 in 15) since 1990, so it’s relatively rare, and here’s what happened, going forward:
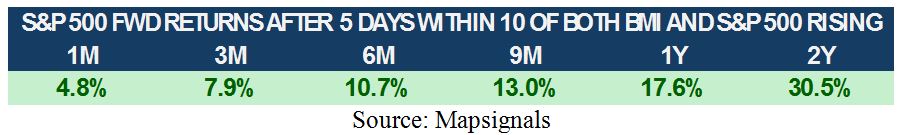
Graphs are for illustrative and discussion purposes only. Please read important disclosures at the end of this commentary.
Returns look terrific, I’d say.
This is also an election year, when we will almost certainly see rates fall by year’s end. Cuts are already happening in Europe, and we should expect more. Such tailwinds are what we hope for as stock investors.
For me, this means more future vacations.
What does it mean for you?
“It is better to travel well than to arrive.” – Buddha
Navellier & Associates owns Salesforce (CRM), in some managed accounts. Jason Bodner owns Salesforce (CRM), personally.
All content above represents the opinion of Jason Bodner of Navellier & Associates, Inc.
Also In This Issue
A Look Ahead by Louis Navellier
Overseas Rate Cuts Could Help Lower U.S. Yields This Summer
Income Mail by Bryan Perry
Non-Leveraged High Yield Asset Class Pays Double-Digit Yields
Growth Mail by Gary Alexander
High Tech Stocks Can Create (or Crater) Fortunes
Global Mail by Ivan Martchev
Fresh All Time Highs, Now What?
Sector Spotlight by Jason Bodner
Why Do You Invest? To Hoard Wealth, or Spend It?
View Full Archive
Read Past Issues Here

Jason Bodner
MARKETMAIL EDITOR FOR SECTOR SPOTLIGHT
Jason Bodner writes Sector Spotlight in the weekly Marketmail publication and has authored several white papers for the company. He is also Co-Founder of Macro Analytics for Professionals which produces proprietary equity accumulation/distribution research for its clients. Previously, Mr. Bodner served as Director of European Equity Derivatives for Cantor Fitzgerald Europe in London, then moved to the role of Head of Equity Derivatives North America for the same company in New York. He also served as S.V.P. Equity Derivatives for Jefferies, LLC. He received a B.S. in business administration in 1996, with honors, from Skidmore College as a member of the Periclean Honors Society. All content of “Sector Spotlight” represents the opinion of Jason Bodner
Important Disclosures:
Jason Bodner is a co-founder and co-owner of Mapsignals. Mr. Bodner is an independent contractor who is occasionally hired by Navellier & Associates to write an article and or provide opinions for possible use in articles that appear in Navellier & Associates weekly Market Mail. Mr. Bodner is not employed or affiliated with Louis Navellier, Navellier & Associates, Inc., or any other Navellier owned entity. The opinions and statements made here are those of Mr. Bodner and not necessarily those of any other persons or entities. This is not an endorsement, or solicitation or testimonial or investment advice regarding the BMI Index or any statements or recommendations or analysis in the article or the BMI Index or Mapsignals or its products or strategies.
Although information in these reports has been obtained from and is based upon sources that Navellier believes to be reliable, Navellier does not guarantee its accuracy and it may be incomplete or condensed. All opinions and estimates constitute Navellier’s judgment as of the date the report was created and are subject to change without notice. These reports are for informational purposes only and are not a solicitation for the purchase or sale of a security. Any decision to purchase securities mentioned in these reports must take into account existing public information on such securities or any registered prospectus.To the extent permitted by law, neither Navellier & Associates, Inc., nor any of its affiliates, agents, or service providers assumes any liability or responsibility nor owes any duty of care for any consequences of any person acting or refraining to act in reliance on the information contained in this communication or for any decision based on it.
Past performance is no indication of future results. Investment in securities involves significant risk and has the potential for partial or complete loss of funds invested. It should not be assumed that any securities recommendations made by Navellier. in the future will be profitable or equal the performance of securities made in this report. Dividend payments are not guaranteed. The amount of a dividend payment, if any, can vary over time and issuers may reduce dividends paid on securities in the event of a recession or adverse event affecting a specific industry or issuer.
None of the stock information, data, and company information presented herein constitutes a recommendation by Navellier or a solicitation to buy or sell any securities. Any specific securities identified and described do not represent all of the securities purchased, sold, or recommended for advisory clients. The holdings identified do not represent all of the securities purchased, sold, or recommended for advisory clients and the reader should not assume that investments in the securities identified and discussed were or will be profitable.
Information presented is general information that does not take into account your individual circumstances, financial situation, or needs, nor does it present a personalized recommendation to you. Individual stocks presented may not be suitable for every investor. Investment in securities involves significant risk and has the potential for partial or complete loss of funds invested. Investment in fixed income securities has the potential for the investment return and principal value of an investment to fluctuate so that an investor’s holdings, when redeemed, may be worth less than their original cost.
One cannot invest directly in an index. Index is unmanaged and index performance does not reflect deduction of fees, expenses, or taxes. Presentation of Index data does not reflect a belief by Navellier that any stock index constitutes an investment alternative to any Navellier equity strategy or is necessarily comparable to such strategies. Among the most important differences between the Indices and Navellier strategies are that the Navellier equity strategies may (1) incur material management fees, (2) concentrate its investments in relatively few stocks, industries, or sectors, (3) have significantly greater trading activity and related costs, and (4) be significantly more or less volatile than the Indices.
ETF Risk: We may invest in exchange traded funds (“ETFs”) and some of our investment strategies are generally fully invested in ETFs. Like traditional mutual funds, ETFs charge asset-based fees, but they generally do not charge initial sales charges or redemption fees and investors typically pay only customary brokerage fees to buy and sell ETF shares. The fees and costs charged by ETFs held in client accounts will not be deducted from the compensation the client pays Navellier. ETF prices can fluctuate up or down, and a client account could lose money investing in an ETF if the prices of the securities owned by the ETF go down. ETFs are subject to additional risks:
- ETF shares may trade above or below their net asset value;
- An active trading market for an ETF’s shares may not develop or be maintained;
- The value of an ETF may be more volatile than the underlying portfolio of securities the ETF is designed to track;
- The cost of owning shares of the ETF may exceed those a client would incur by directly investing in the underlying securities; and
- Trading of an ETF’s shares may be halted if the listing exchange’s officials deem it appropriate, the shares are delisted from the exchange, or the activation of market-wide “circuit breakers” (which are tied to large decreases in stock prices) halts stock trading generally.
Grader Disclosures: Investment in equity strategies involves substantial risk and has the potential for partial or complete loss of funds invested. The sample portfolio and any accompanying charts are for informational purposes only and are not to be construed as a solicitation to buy or sell any financial instrument and should not be relied upon as the sole factor in an investment making decision. As a matter of normal and important disclosures to you, as a potential investor, please consider the following: The performance presented is not based on any actual securities trading, portfolio, or accounts, and the reported performance of the A, B, C, D, and F portfolios (collectively the “model portfolios”) should be considered mere “paper” or pro forma performance results based on Navellier’s research.
Investors evaluating any of Navellier & Associates, Inc.’s, (or its affiliates’) Investment Products must not use any information presented here, including the performance figures of the model portfolios, in their evaluation of any Navellier Investment Products. Navellier Investment Products include the firm’s mutual funds and managed accounts. The model portfolios, charts, and other information presented do not represent actual funded trades and are not actual funded portfolios. There are material differences between Navellier Investment Products’ portfolios and the model portfolios, research, and performance figures presented here. The model portfolios and the research results (1) may contain stocks or ETFs that are illiquid and difficult to trade; (2) may contain stock or ETF holdings materially different from actual funded Navellier Investment Product portfolios; (3) include the reinvestment of all dividends and other earnings, estimated trading costs, commissions, or management fees; and, (4) may not reflect prices obtained in an actual funded Navellier Investment Product portfolio. For these and other reasons, the reported performances of model portfolios do not reflect the performance results of Navellier’s actually funded and traded Investment Products. In most cases, Navellier’s Investment Products have materially lower performance results than the performances of the model portfolios presented.
This report contains statements that are, or may be considered to be, forward-looking statements. All statements that are not historical facts, including statements about our beliefs or expectations, are “forward-looking statements” within the meaning of The U.S. Private Securities Litigation Reform Act of 1995. These statements may be identified by such forward-looking terminology as “expect,” “estimate,” “plan,” “intend,” “believe,” “anticipate,” “may,” “will,” “should,” “could,” “continue,” “project,” or similar statements or variations of such terms. Our forward-looking statements are based on a series of expectations, assumptions, and projections, are not guarantees of future results or performance, and involve substantial risks and uncertainty as described in Form ADV Part 2A of our filing with the Securities and Exchange Commission (SEC), which is available at www.adviserinfo.sec.gov or by requesting a copy by emailing info@navellier.com. All of our forward-looking statements are as of the date of this report only. We can give no assurance that such expectations or forward-looking statements will prove to be correct. Actual results may differ materially. You are urged to carefully consider all such factors.
FEDERAL TAX ADVICE DISCLAIMER: As required by U.S. Treasury Regulations, you are informed that, to the extent this presentation includes any federal tax advice, the presentation is not written by Navellier to be used, and cannot be used, for the purpose of avoiding federal tax penalties. Navellier does not advise on any income tax requirements or issues. Use of any information presented by Navellier is for general information only and does not represent tax advice either express or implied. You are encouraged to seek professional tax advice for income tax questions and assistance.
IMPORTANT NEWSLETTER DISCLOSURE:The hypothetical performance results for investment newsletters that are authored or edited by Louis Navellier, including Louis Navellier’s Growth Investor, Louis Navellier’s Breakthrough Stocks, Louis Navellier’s Accelerated Profits, and Louis Navellier’s Platinum Club, are not based on any actual securities trading, portfolio, or accounts, and the newsletters’ reported hypothetical performances should be considered mere “paper” or proforma hypothetical performance results and are not actual performance of real world trades. Navellier & Associates, Inc. does not have any relation to or affiliation with the owner of these newsletters. There are material differences between Navellier Investment Products’ portfolios and the InvestorPlace Media, LLC newsletter portfolios authored by Louis Navellier. The InvestorPlace Media, LLC newsletters contain hypothetical performance that do not include transaction costs, advisory fees, or other fees a client might incur if actual investments and trades were being made by an investor. As a result, newsletter performance should not be used to evaluate Navellier Investment services which are separate and different from the newsletters. The owner of the newsletters is InvestorPlace Media, LLC and any questions concerning the newsletters, including any newsletter advertising or hypothetical Newsletter performance claims, (which are calculated solely by Investor Place Media and not Navellier) should be referred to InvestorPlace Media, LLC at (800) 718-8289.
Please note that Navellier & Associates and the Navellier Private Client Group are managed completely independent of the newsletters owned and published by InvestorPlace Media, LLC and written and edited by Louis Navellier, and investment performance of the newsletters should in no way be considered indicative of potential future investment performance for any Navellier & Associates separately managed account portfolio. Potential investors should consult with their financial advisor before investing in any Navellier Investment Product.
Navellier claims compliance with Global Investment Performance Standards (GIPS). To receive a complete list and descriptions of Navellier’s composites and/or a presentation that adheres to the GIPS standards, please contact Navellier or click here. It should not be assumed that any securities recommendations made by Navellier & Associates, Inc. in the future will be profitable or equal the performance of securities made in this report.
FactSet Disclosure: Navellier does not independently calculate the statistical information included in the attached report. The calculation and the information are provided by FactSet, a company not related to Navellier. Although information contained in the report has been obtained from FactSet and is based on sources Navellier believes to be reliable, Navellier does not guarantee its accuracy, and it may be incomplete or condensed. The report and the related FactSet sourced information are provided on an “as is” basis. The user assumes the entire risk of any use made of this information. Investors should consider the report as only a single factor in making their investment decision. The report is for informational purposes only and is not intended as an offer or solicitation for the purchase or sale of a security. FactSet sourced information is the exclusive property of FactSet. Without prior written permission of FactSet, this information may not be reproduced, disseminated or used to create any financial products. All indices are unmanaged and performance of the indices include reinvestment of dividends and interest income, unless otherwise noted, are not illustrative of any particular investment and an investment cannot be made in any index. Past performance is no guarantee of future results.