by Jason Bodner
May 6, 2025
Stocks always seemed to rise in the 1990s, when I was young, but in 1998, when I was 24, the stock market was in a tailspin. The S&P 500 fell almost 20% in less than three-months. The Asian Financial Crisis lined up with Russia defaulting on its debt. These events put immense pressure on a hedge fund named Long Term Capital Management (LTCM), founded by financial geniuses like John Meriwether and two 1997 Nobel prize-winning mathematicians, Myron Scholes and Robert Merton. If the Scholes name sounds familiar, it’s because he co-authored the famous Black/Scholes equation for pricing options. It is still widely used as the main options pricing model for the $1 quadrillion-dollar derivatives market.
LTCM enjoyed years of stellar returns and swelling Assets Under Management (AUM). All that came to a crashing halt in the fall of 1998 when the firm lost over $4.6-billion due to the confluence of the above-mentioned events. All the math skills and brain power in the world couldn’t save them, and the fund needed a federally organized bailout by private parties to stave off a global financial collapse.
It felt like an unprecedented calamity… but the market survived and thrived: the S&P 500 went on to rally by over 60% before reaching its peak in March 2000. More dramatically, the S&P 500 gained over 25% between its low on October 7th 1998, and Thanksgiving that year – in just seven-weeks.
While geopolitical events are different, 2025 is a similar scenario. The S&P 500 fell a similar near-20% peak-to-trough this year, on a closing basis and -21% to its intra-day low. Despite its recent 15.4% rally from its lows, it is still down 7.5% from the peak and down 3.3% for 2025, through last Friday’s close.
In times of trouble, it always feels different. Just as the 1998 threat of a financial system collapse felt different to me then, Trump’s trade war fueling global recession fears feels different. My bold take: It’s not. And we will be fine. And don’t just take my word for it, the market has already begun telling us so:

Graphs are for illustrative and discussion purposes only. Please read important disclosures at the end of this commentary.
That’s the chart of a rising Big Money Index (BMI), the powerful indicator of big money flows. We can see it plummeted until the market troughed, but then reversed higher. The important distinction, however, is that the BMI didn’t rise due to fresh capital plowing into stocks. While value hunters did step in, buyers haven’t launched stocks to new highs quite yet. The rise in the BMI came from a complete vanishing act of outflows (selling). We can see below that both ETFs and stocks saw the relentless selling just stop:

Graphs are for illustrative and discussion purposes only. Please read important disclosures at the end of this commentary.
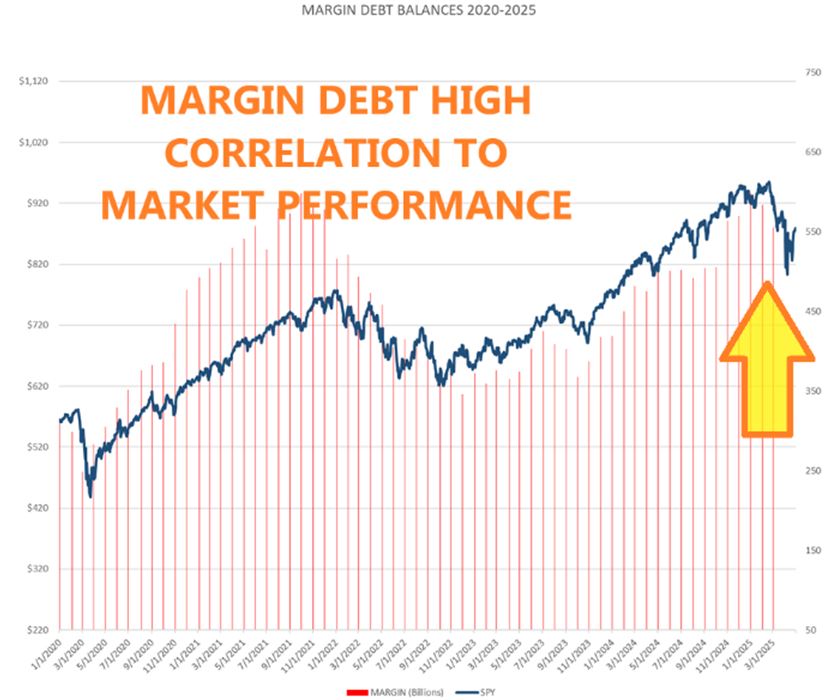
You’ll notice in the stocks chart that I pointed out there was a reduction in margin debt that took place coinciding with a drop in stock market prices. Data scientists will often ask: causation or correlation?
I believe the selling was in fact driven by forced liquidations related to margin-calls.
You can see the correlation (or causation?) here:
Graphs are for illustrative and discussion purposes only. Please read important disclosures at the end of this commentary.
While trade wars may not compare to financial collapse, look at how eerily similar the markets and margin-calls are to 1998:

Graphs are for illustrative and discussion purposes only. Please read important disclosures at the end of this commentary.
I told you, however, that stocks went on to rally 63% thereafter in 1998.
Look at how margin swelled along with it:

Graphs are for illustrative and discussion purposes only. Please read important disclosures at the end of this commentary.
We can also see the market disruption resuming to normal in elevated trading volumes.
Next, look at how volumes exploded as the market sank, and resumed normal when rebounding:

Graphs are for illustrative and discussion purposes only. Please read important disclosures at the end of this commentary.
I can tell you that, below the surface, the action is quite constructive too. First, looking at the surface, we see that defensive-sectors are still ranked highest. Utilities and Staples remain at the top of the rankings while growth sectors like Discretionary and Technology remain weak:
![]()
Graphs are for illustrative and discussion purposes only. Please read important disclosures at the end of this commentary.
But looking within the sectors, we can see that every single sector has seen a rebound. More importantly, each sector saw a drop-off with outflows. Some even saw a rise from inflows:


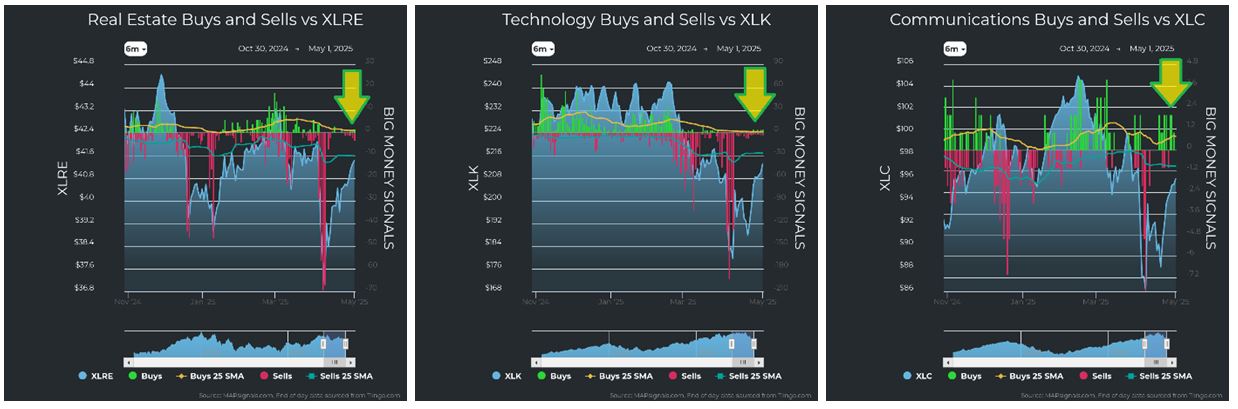
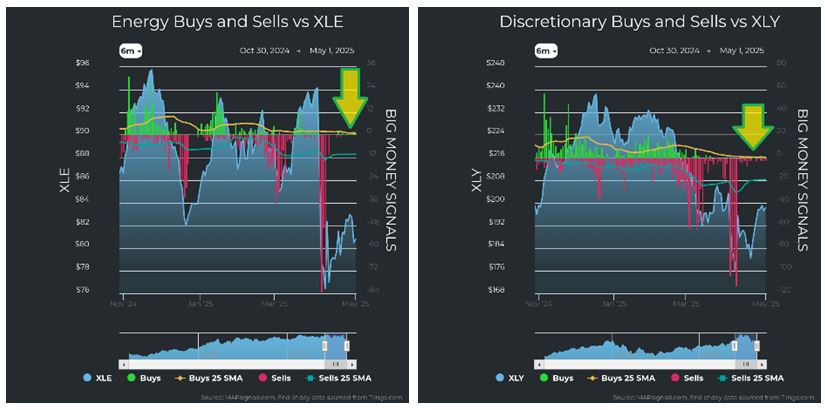
Graphs are for illustrative and discussion purposes only. Please read important disclosures at the end of this commentary.
If you’ve been reading me throughout this year, you’ll know that I presented several signal studies to show you that the dismal action of March and April actually fore-shadowed bullish market behavior.
I’ll just re-post the summaries of those studies’ past surveys and predictions here:

Graphs are for illustrative and discussion purposes only. Please read important disclosures at the end of this commentary.
I posted plenty of other studies showing similar results, but you get the picture. We can revisit them a few weeks later. While I predicted a market low on April 1st, I was off by a week as the S&P 500 troughed on April 8th. Here are the returns thereafter: We must wait to see 3, 6, 9, 12, and 24-months performance, but the studies above show we have as high as a 100% chance that markets are higher six-months out.
Last Friday, the S&P 500 closed higher than the prior day for the 9th day in a row. Historically speaking, what does that look like? I went back and looked at historical returns for the S&P 500 since 1928 looking for nine-consecutive up days. It happened only 55-times in 97-years. Here are the forward average returns:

Graphs are for illustrative and discussion purposes only. Please read important disclosures at the end of this commentary.
I was surprised too: We have a better than 60% chance of higher markets all the way from 1 week to 2-years later. Markets were higher more than 75% of the time nine-months or more later.
If you listen to the news lately, you would be led to believe otherwise. Headlines drip with trade war rhetoric, interest rate uncertainty, and global recession fears.
It seems very similar in terms of fear level as LTCM collapsed in late 1998
Or a downgrade of U.S. debt and European sovereign debt crisis in 2011.
Or Brexit and Trump’s first surprise win in 2016.
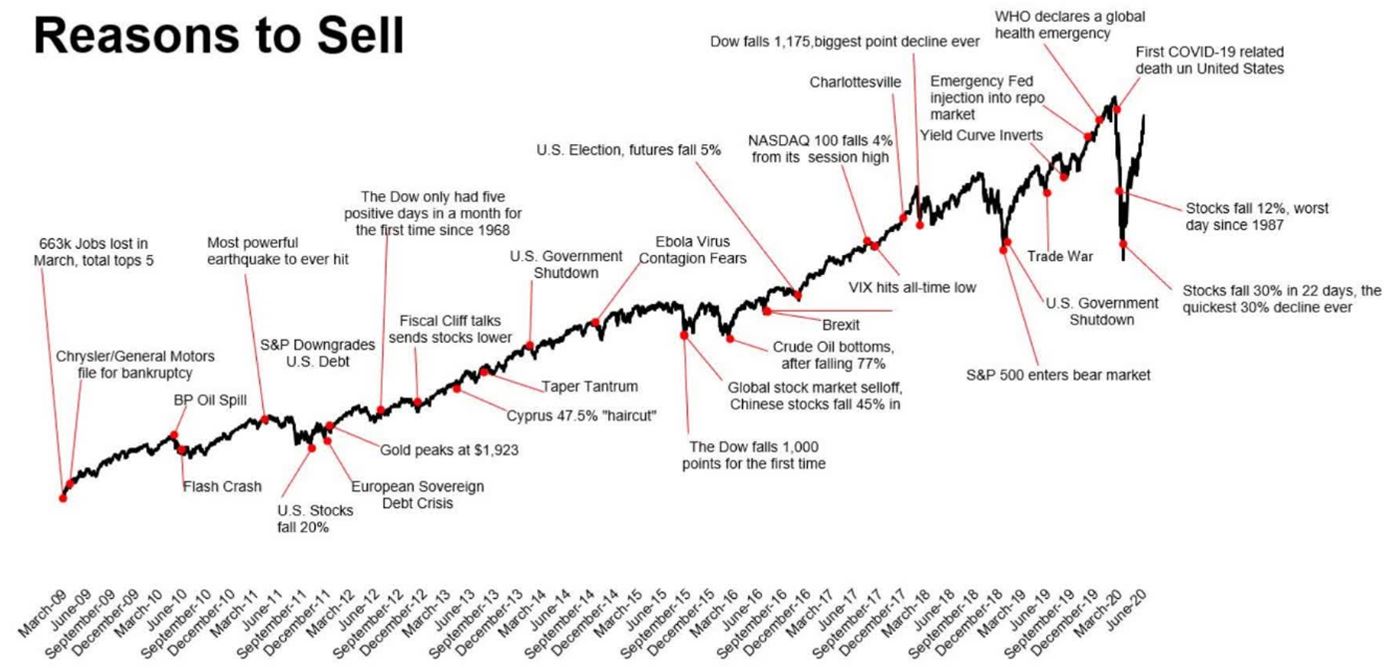
The truth is that there’s always a reason to sell. This chart below plots many from just the last 15-years:
Graphs are for illustrative and discussion purposes only. Please read important disclosures at the end of this commentary.
The pattern repeats itself year after year. There’s always a reason to sell.
But since 1928, the S&P 500 has risen 29,645%. Trying to time the market for perfect sell dates, and sidestepping perceived risk can work, but only if everything lines up just right., twice, selling and buying.
A better investing method might be identifying stellar growth stocks and holding them for long-term appreciation. This method works best if you can tune out the noise that compels you to sell out of fear.
It’s no simple task, but the data I offer here should serve as a good indication that the news is often short-term fuel for drastic price action. In the end, it has proven to be a stellar opportunity.
“Worry does not empty tomorrow of its sorrow. It empties today of its strength.” – Corrie Ten Boom
All content above represents the opinion of Jason Bodner of Navellier & Associates, Inc.
Also In This Issue
A Look Ahead by Louis Navellier
Friday’s Jobs Report Doesn’t Give the Fed a “Pass” on Cutting Rates
Income Mail by Bryan Perry
Hard Truths from Warren Buffett on the Federal Debt Crisis
Growth Mail by Gary Alexander
First-Year Flops Are Normal in Market History
Global Mail by Ivan Martchev
There is a Path to Fresh All-Time Highs for Stocks
Sector Spotlight by Jason Bodner
My Stock Market “Baptism of Fire” Was in 1998 (When Was Yours?)
View Full Archive
Read Past Issues Here

Jason Bodner
MARKETMAIL EDITOR FOR SECTOR SPOTLIGHT
Jason Bodner writes Sector Spotlight in the weekly Marketmail publication and has authored several white papers for the company. He is also Co-Founder of Macro Analytics for Professionals which produces proprietary equity accumulation and distribution research for its clients. Previously, Mr. Bodner served as Director of European Equity Derivatives for Cantor Fitzgerald Europe in London, then moved to the role of Head of Equity Derivatives North America for the same company in New York. He also served as S.V.P. Equity Derivatives for Jefferies, LLC. He received a B.S. in business administration in 1996, with honors, from Skidmore College as a member of the Periclean Honors Society. All content of “Sector Spotlight” represents the opinion of Jason Bodner
Important Disclosures:
Jason Bodner is a co-founder and co-owner of Mapsignals. Mr. Bodner is an independent contractor who is occasionally hired by Navellier & Associates to write an article and or provide opinions for possible use in articles that appear in Navellier & Associates weekly Market Mail. Mr. Bodner is not employed or affiliated with Louis Navellier, Navellier & Associates, Inc., or any other Navellier owned entity. The opinions and statements made here are those of Mr. Bodner and not necessarily those of any other persons or entities. This is not an endorsement, or solicitation or testimonial or investment advice regarding the BMI Index or any statements or recommendations or analysis in the article or the BMI Index or Mapsignals or its products or strategies.
Although information in these reports has been obtained from and is based upon sources that Navellier believes to be reliable, Navellier does not guarantee its accuracy and it may be incomplete or condensed. All opinions and estimates constitute Navellier’s judgment as of the date the report was created and are subject to change without notice. These reports are for informational purposes only and are not a solicitation for the purchase or sale of a security. Any decision to purchase securities mentioned in these reports must take into account existing public information on such securities or any registered prospectus.To the extent permitted by law, neither Navellier & Associates, Inc., nor any of its affiliates, agents, or service providers assumes any liability or responsibility nor owes any duty of care for any consequences of any person acting or refraining to act in reliance on the information contained in this communication or for any decision based on it.
Past performance is no indication of future results. Investment in securities involves significant risk and has the potential for partial or complete loss of funds invested. It should not be assumed that any securities recommendations made by Navellier. in the future will be profitable or equal the performance of securities made in this report. Dividend payments are not guaranteed. The amount of a dividend payment, if any, can vary over time and issuers may reduce dividends paid on securities in the event of a recession or adverse event affecting a specific industry or issuer.
None of the stock information, data, and company information presented herein constitutes a recommendation by Navellier or a solicitation to buy or sell any securities. Any specific securities identified and described do not represent all of the securities purchased, sold, or recommended for advisory clients. The holdings identified do not represent all of the securities purchased, sold, or recommended for advisory clients and the reader should not assume that investments in the securities identified and discussed were or will be profitable.
Information presented is general information that does not take into account your individual circumstances, financial situation, or needs, nor does it present a personalized recommendation to you. Individual stocks presented may not be suitable for every investor. Investment in securities involves significant risk and has the potential for partial or complete loss of funds invested. Investment in fixed income securities has the potential for the investment return and principal value of an investment to fluctuate so that an investor’s holdings, when redeemed, may be worth less than their original cost.
One cannot invest directly in an index. Index is unmanaged and index performance does not reflect deduction of fees, expenses, or taxes. Presentation of Index data does not reflect a belief by Navellier that any stock index constitutes an investment alternative to any Navellier equity strategy or is necessarily comparable to such strategies. Among the most important differences between the Indices and Navellier strategies are that the Navellier equity strategies may (1) incur material management fees, (2) concentrate its investments in relatively few stocks, industries, or sectors, (3) have significantly greater trading activity and related costs, and (4) be significantly more or less volatile than the Indices.
ETF Risk: We may invest in exchange traded funds (“ETFs”) and some of our investment strategies are generally fully invested in ETFs. Like traditional mutual funds, ETFs charge asset-based fees, but they generally do not charge initial sales charges or redemption fees and investors typically pay only customary brokerage fees to buy and sell ETF shares. The fees and costs charged by ETFs held in client accounts will not be deducted from the compensation the client pays Navellier. ETF prices can fluctuate up or down, and a client account could lose money investing in an ETF if the prices of the securities owned by the ETF go down. ETFs are subject to additional risks:
- ETF shares may trade above or below their net asset value;
- An active trading market for an ETF’s shares may not develop or be maintained;
- The value of an ETF may be more volatile than the underlying portfolio of securities the ETF is designed to track;
- The cost of owning shares of the ETF may exceed those a client would incur by directly investing in the underlying securities and;
- Trading of an ETF’s shares may be halted if the listing exchange’s officials deem it appropriate, the shares are delisted from the exchange, or the activation of market-wide “circuit breakers” (which are tied to large decreases in stock prices) halts stock trading generally.
Grader Disclosures: Investment in equity strategies involves substantial risk and has the potential for partial or complete loss of funds invested. The sample portfolio and any accompanying charts are for informational purposes only and are not to be construed as a solicitation to buy or sell any financial instrument and should not be relied upon as the sole factor in an investment making decision. As a matter of normal and important disclosures to you, as a potential investor, please consider the following: The performance presented is not based on any actual securities trading, portfolio, or accounts, and the reported performance of the A, B, C, D, and F portfolios (collectively the “model portfolios”) should be considered mere “paper” or pro forma performance results based on Navellier’s research.
Investors evaluating any of Navellier & Associates, Inc.’s, (or its affiliates’) Investment Products must not use any information presented here, including the performance figures of the model portfolios, in their evaluation of any Navellier Investment Products. Navellier Investment Products include the firm’s mutual funds and managed accounts. The model portfolios, charts, and other information presented do not represent actual funded trades and are not actual funded portfolios. There are material differences between Navellier Investment Products’ portfolios and the model portfolios, research, and performance figures presented here. The model portfolios and the research results (1) may contain stocks or ETFs that are illiquid and difficult to trade; (2) may contain stock or ETF holdings materially different from actual funded Navellier Investment Product portfolios; (3) include the reinvestment of all dividends and other earnings, estimated trading costs, commissions, or management fees; and, (4) may not reflect prices obtained in an actual funded Navellier Investment Product portfolio. For these and other reasons, the reported performances of model portfolios do not reflect the performance results of Navellier’s actually funded and traded Investment Products. In most cases, Navellier’s Investment Products have materially lower performance results than the performances of the model portfolios presented.
This report contains statements that are, or may be considered to be, forward-looking statements. All statements that are not historical facts, including statements about our beliefs or expectations, are “forward-looking statements” within the meaning of The U.S. Private Securities Litigation Reform Act of 1995. These statements may be identified by such forward-looking terminology as “expect,” “estimate,” “plan,” “intend,” “believe,” “anticipate,” “may,” “will,” “should,” “could,” “continue,” “project,” or similar statements or variations of such terms. Our forward-looking statements are based on a series of expectations, assumptions, and projections, are not guarantees of future results or performance, and involve substantial risks and uncertainty as described in Form ADV Part 2A of our filing with the Securities and Exchange Commission (SEC), which is available at www.adviserinfo.sec.gov or by requesting a copy by emailing info@navellier.com. All of our forward-looking statements are as of the date of this report only. We can give no assurance that such expectations or forward-looking statements will prove to be correct. Actual results may differ materially. You are urged to carefully consider all such factors.
FEDERAL TAX ADVICE DISCLAIMER: As required by U.S. Treasury Regulations, you are informed that, to the extent this presentation includes any federal tax advice, the presentation is not written by Navellier to be used, and cannot be used, for the purpose of avoiding federal tax penalties. Navellier does not advise on any income tax requirements or issues. Use of any information presented by Navellier is for general information only and does not represent tax advice either express or implied. You are encouraged to seek professional tax advice for income tax questions and assistance.
IMPORTANT NEWSLETTER DISCLOSURE:The hypothetical performance results for investment newsletters that are authored or edited by Louis Navellier, including Louis Navellier’s Growth Investor, Louis Navellier’s Breakthrough Stocks, Louis Navellier’s Accelerated Profits, and Louis Navellier’s Platinum Club, are not based on any actual securities trading, portfolio, or accounts, and the newsletters’ reported hypothetical performances should be considered mere “paper” or proforma hypothetical performance results and are not actual performance of real world trades. Navellier & Associates, Inc. does not have any relation to or affiliation with the owner of these newsletters. There are material differences between Navellier Investment Products’ portfolios and the InvestorPlace Media, LLC newsletter portfolios authored by Louis Navellier. The InvestorPlace Media, LLC newsletters contain hypothetical performance that do not include transaction costs, advisory fees, or other fees a client might incur if actual investments and trades were being made by an investor. As a result, newsletter performance should not be used to evaluate Navellier Investment services which are separate and different from the newsletters. The owner of the newsletters is InvestorPlace Media, LLC and any questions concerning the newsletters, including any newsletter advertising or hypothetical Newsletter performance claims, (which are calculated solely by Investor Place Media and not Navellier) should be referred to InvestorPlace Media, LLC at (800) 718-8289.
Please note that Navellier & Associates and the Navellier Private Client Group are managed completely independent of the newsletters owned and published by InvestorPlace Media, LLC and written and edited by Louis Navellier, and investment performance of the newsletters should in no way be considered indicative of potential future investment performance for any Navellier & Associates separately managed account portfolio. Potential investors should consult with their financial advisor before investing in any Navellier Investment Product.
Navellier claims compliance with Global Investment Performance Standards (GIPS). To receive a complete list and descriptions of Navellier’s composites and/or a presentation that adheres to the GIPS standards, please contact Navellier or click here. It should not be assumed that any securities recommendations made by Navellier & Associates, Inc. in the future will be profitable or equal the performance of securities made in this report.
FactSet Disclosure: Navellier does not independently calculate the statistical information included in the attached report. The calculation and the information are provided by FactSet, a company not related to Navellier. Although information contained in the report has been obtained from FactSet and is based on sources Navellier believes to be reliable, Navellier does not guarantee its accuracy, and it may be incomplete or condensed. The report and the related FactSet sourced information are provided on an “as is” basis. The user assumes the entire risk of any use made of this information. Investors should consider the report as only a single factor in making their investment decision. The report is for informational purposes only and is not intended as an offer or solicitation for the purchase or sale of a security. FactSet sourced information is the exclusive property of FactSet. Without prior written permission of FactSet, this information may not be reproduced, disseminated or used to create any financial products. All indices are unmanaged and performance of the indices include reinvestment of dividends and interest income, unless otherwise noted, are not illustrative of any particular investment and an investment cannot be made in any index. Past performance is no guarantee of future results.