by Bryan Perry
May 29, 2024
Millions of investors are just now beginning to get up to speed on the topic of AI and the promise it brings to those that invest and trade in the right AI stocks. Depending on which forecast one follows, the growth projections are not just huge, but are by some measures accelerating, as AI is finding broader applications.
Artificial Intelligence is having a profound impact on various industries. Some that stand out include manufacturing, medical testing, aerospace, defense, advertising, education, healthcare delivery, carbon emission reduction, agriculture, customer service, cybersecurity, hospitality, transportation, product personalization, managing the gig economy, software development, content creation, autonomous vehicle navigation, finance, banking and insurance, information technology and too many others to mention.
Investors live in an amazing time, when such a powerful, disruptive and transformative advancement in technology has what some believe, is a multi-year runway in front of it. Those that took the arrival of the Internet seriously in the 1990s made a fortune. I bring AI to light because the market has come to believe the monetization of the AI transformation is similar for portfolios going forward.
Even the sleepy utilities sector, which has been weighed down by interest rates being higher for longer, is trading sharply higher on the notion of rapidly increasing demand for electricity to power the football-field sized data centers sprouting up all over the country and around the world. Industrial stocks charge higher on the promise of retooling manufacturing with 24/7/365 AI-driven robotic production lines. Medical research sees no limit as to how AI will crunch data to propel new therapies to FDA approval.
And the list goes on and on.
The AI revolution doesn’t care about geopolitics – or the Trump versus Biden election, or climate change, or the border crisis or the culture wars. To those of us with long memories, it is like when UUNet Technologies Inc. (UUNT) sold the first T-1 virtual private network connection to the Internet in 1988. UUNET was the fastest-growing Internet Service Provider (ISP) in the mid-90s, doubling its capacity every few months. UUNET completed its IPO at $14 in May 1995, raising $50 million. UUNET was acquired by Metropolitan Fiber Systems (MFS) in August 1996 for $2 billion, 40 times its IPO valuation.
In a more recent example, it’s like when Steve Jobs introduced the first iPhone in 2007. AI is just as big, if not bigger, because of how fast it can be scaled. Today, the global AI market is worth an estimated $196 billion, having doubled in size since 2021 ($95.6 billion) and it is projected to grow 10-fold by 2030, reaching nearly $2 trillion. Spending on AI-centric systems is forecasted to surpass $300 billion in 2026, with a compound annual growth rate (CAGR) of 27% from 2022 to 2026. Between 2022 and 2030, the global AI market is expected to grow at a CAGR of 33%. Barring worst-case scenarios (World War III or a default by the U.S. Treasury), there seems to be a runway for stellar growth in AI for the next 3-5 years.
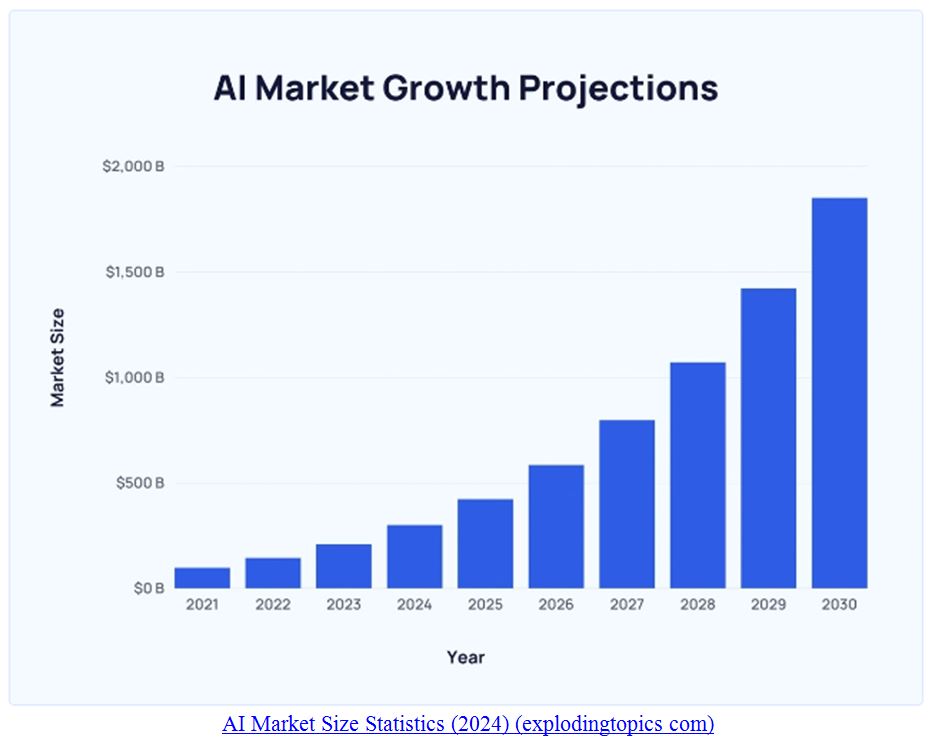
Graphs are for illustrative and discussion purposes only. Please read important disclosures at the end of this commentary.
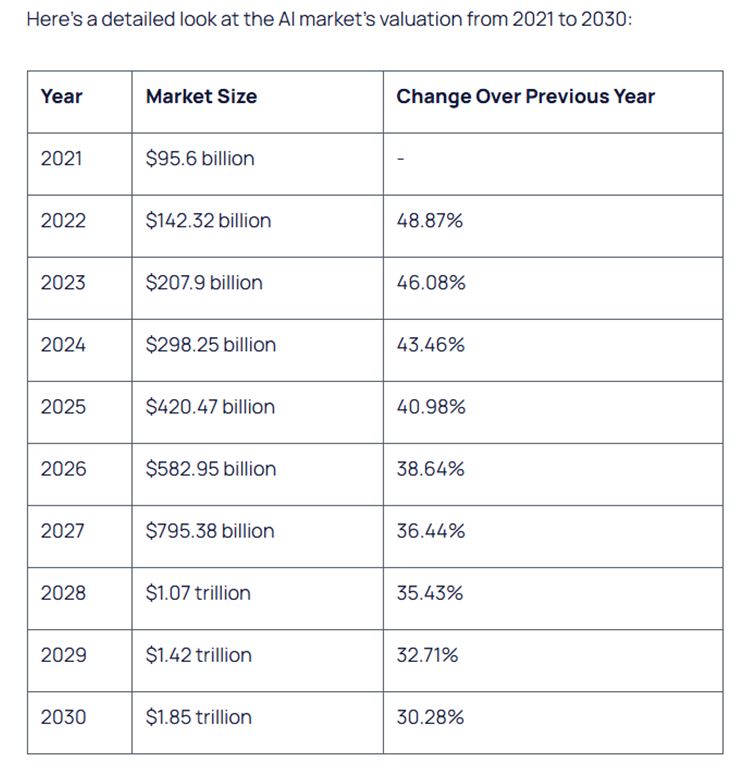
Source: NextMSC
Graphs are for illustrative and discussion purposes only. Please read important disclosures at the end of this commentary.
There are several ways to participate – through those companies that provide infrastructure that support enterprise data, workloads across various domains, deployment of tools to install machine learning (ML) models used in open-source frameworks and databases, makers of advanced memory and storage systems, companies offering full-featured AI-enabled smartphones, notebooks, PCs, and hardware.
AI For Income Investors
AI investing isn’t just for growth investors. Income investors can fully capitalize on this mega-trend by way of a proactive covered-call option strategy. Based and the leading companies that have the war chests of cash to deploy AI at scale, investors can enlist a hearty number of stocks for both growth and income.
At a time when inflation has raised our cost of living, yields on most asset classes are not keeping up with inflation. The good news for those seeking income from the AI sector is that option premiums on the top AI stocks are rich enough so that selling call options well out-of-the-money can possibly generate income stream while managing risk of the underlying positions called away (assigned).
It is rare when a new technology touches most of the best-of-breed stocks in so many sectors, where the growth catalysts are being revised broadly higher. That means all 11 S&P 500 market sectors are available to rotate in and out of, with arguably great stocks within the top 10 holdings of each sector ETF. But for generating income from writing covered calls, it stands to reason that the rapidly improving fundamentals regarding capital investments into those AI-Centric companies will experience higher sales/earnings growth and higher volatility. Option premiums expand when stocks demonstrate higher volatility, and as we have all seen in 2023 and 2024 – the AI sector is indeed volatile.
Income investors can diversify their risk by working with the ETFs that have a high concentration in AI stocks. In my experience, the VanEck Semiconductor ETF (SMH) is one of them, representing the leading chip and chip equipment stocks that are essential to the growth of AI.
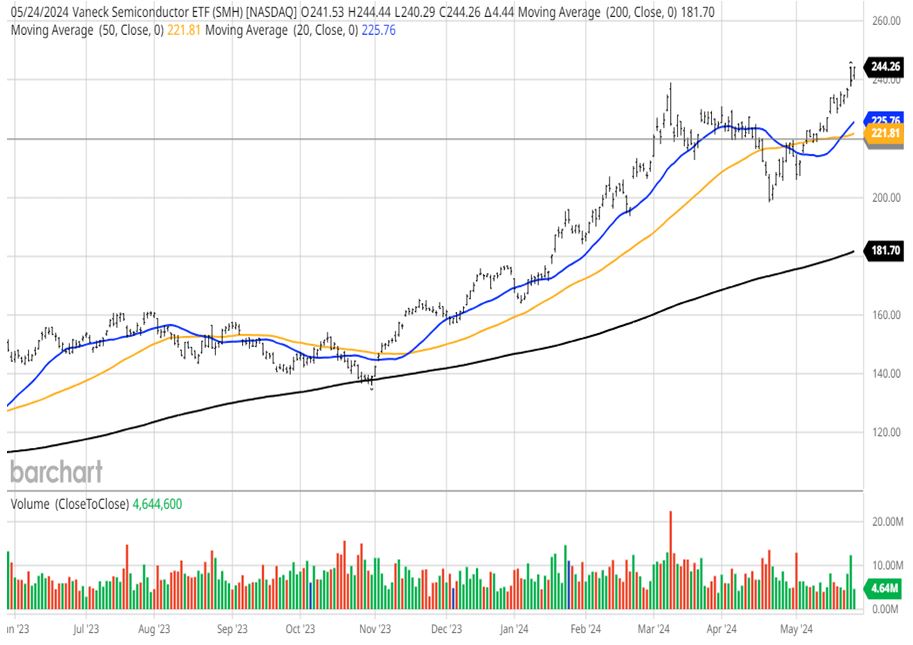
Graphs are for illustrative and discussion purposes only. Please read important disclosures at the end of this commentary.
All content above represents the opinion of Bryan Perry of Navellier & Associates, Inc.
Also In This Issue
A Look Ahead by Louis Navellier
Why June Could Bring a Return of $90 to $100 Crude Oil Prices
Income Mail by Bryan Perry
How to Add Premium Income from Selling Covered-Calls in Big Cap AI Stocks
Growth Mail by Gary Alexander
Remembering Our Dark Summers 50 and 100 Years Ago
Global Mail by Ivan Martchev
The Stock Market is Channeling Yogi Berra
Sector Spotlight by Jason Bodner
Don’t Worry: Be Healthy, Happy (and Richer)
View Full Archive
Read Past Issues Here

Bryan Perry
SENIOR DIRECTOR
Bryan Perry is a Senior Director with Navellier Private Client Group, advising and facilitating high net worth investors in the pursuit of their financial goals.
Bryan’s financial services career spanning the past three decades includes over 20 years of wealth management experience with Wall Street firms that include Bear Stearns, Lehman Brothers and Paine Webber, working with both retail and institutional clients. Bryan earned a B.A. in Political Science from Virginia Polytechnic Institute & State University and currently holds a Series 65 license. All content of “Income Mail” represents the opinion of Bryan Perry
Important Disclosures:
Although information in these reports has been obtained from and is based upon sources that Navellier believes to be reliable, Navellier does not guarantee its accuracy and it may be incomplete or condensed. All opinions and estimates constitute Navellier’s judgment as of the date the report was created and are subject to change without notice. These reports are for informational purposes only and are not a solicitation for the purchase or sale of a security. Any decision to purchase securities mentioned in these reports must take into account existing public information on such securities or any registered prospectus.To the extent permitted by law, neither Navellier & Associates, Inc., nor any of its affiliates, agents, or service providers assumes any liability or responsibility nor owes any duty of care for any consequences of any person acting or refraining to act in reliance on the information contained in this communication or for any decision based on it.
Past performance is no indication of future results. Investment in securities involves significant risk and has the potential for partial or complete loss of funds invested. It should not be assumed that any securities recommendations made by Navellier. in the future will be profitable or equal the performance of securities made in this report. Dividend payments are not guaranteed. The amount of a dividend payment, if any, can vary over time and issuers may reduce dividends paid on securities in the event of a recession or adverse event affecting a specific industry or issuer.
None of the stock information, data, and company information presented herein constitutes a recommendation by Navellier or a solicitation to buy or sell any securities. Any specific securities identified and described do not represent all of the securities purchased, sold, or recommended for advisory clients. The holdings identified do not represent all of the securities purchased, sold, or recommended for advisory clients and the reader should not assume that investments in the securities identified and discussed were or will be profitable.
Information presented is general information that does not take into account your individual circumstances, financial situation, or needs, nor does it present a personalized recommendation to you. Individual stocks presented may not be suitable for every investor. Investment in securities involves significant risk and has the potential for partial or complete loss of funds invested. Investment in fixed income securities has the potential for the investment return and principal value of an investment to fluctuate so that an investor’s holdings, when redeemed, may be worth less than their original cost.
One cannot invest directly in an index. Index is unmanaged and index performance does not reflect deduction of fees, expenses, or taxes. Presentation of Index data does not reflect a belief by Navellier that any stock index constitutes an investment alternative to any Navellier equity strategy or is necessarily comparable to such strategies. Among the most important differences between the Indices and Navellier strategies are that the Navellier equity strategies may (1) incur material management fees, (2) concentrate its investments in relatively few stocks, industries, or sectors, (3) have significantly greater trading activity and related costs, and (4) be significantly more or less volatile than the Indices.
ETF Risk: We may invest in exchange traded funds (“ETFs”) and some of our investment strategies are generally fully invested in ETFs. Like traditional mutual funds, ETFs charge asset-based fees, but they generally do not charge initial sales charges or redemption fees and investors typically pay only customary brokerage fees to buy and sell ETF shares. The fees and costs charged by ETFs held in client accounts will not be deducted from the compensation the client pays Navellier. ETF prices can fluctuate up or down, and a client account could lose money investing in an ETF if the prices of the securities owned by the ETF go down. ETFs are subject to additional risks:
- ETF shares may trade above or below their net asset value;
- An active trading market for an ETF’s shares may not develop or be maintained;
- The value of an ETF may be more volatile than the underlying portfolio of securities the ETF is designed to track;
- The cost of owning shares of the ETF may exceed those a client would incur by directly investing in the underlying securities; and
- Trading of an ETF’s shares may be halted if the listing exchange’s officials deem it appropriate, the shares are delisted from the exchange, or the activation of market-wide “circuit breakers” (which are tied to large decreases in stock prices) halts stock trading generally.
Grader Disclosures: Investment in equity strategies involves substantial risk and has the potential for partial or complete loss of funds invested. The sample portfolio and any accompanying charts are for informational purposes only and are not to be construed as a solicitation to buy or sell any financial instrument and should not be relied upon as the sole factor in an investment making decision. As a matter of normal and important disclosures to you, as a potential investor, please consider the following: The performance presented is not based on any actual securities trading, portfolio, or accounts, and the reported performance of the A, B, C, D, and F portfolios (collectively the “model portfolios”) should be considered mere “paper” or pro forma performance results based on Navellier’s research.
Investors evaluating any of Navellier & Associates, Inc.’s, (or its affiliates’) Investment Products must not use any information presented here, including the performance figures of the model portfolios, in their evaluation of any Navellier Investment Products. Navellier Investment Products include the firm’s mutual funds and managed accounts. The model portfolios, charts, and other information presented do not represent actual funded trades and are not actual funded portfolios. There are material differences between Navellier Investment Products’ portfolios and the model portfolios, research, and performance figures presented here. The model portfolios and the research results (1) may contain stocks or ETFs that are illiquid and difficult to trade; (2) may contain stock or ETF holdings materially different from actual funded Navellier Investment Product portfolios; (3) include the reinvestment of all dividends and other earnings, estimated trading costs, commissions, or management fees; and, (4) may not reflect prices obtained in an actual funded Navellier Investment Product portfolio. For these and other reasons, the reported performances of model portfolios do not reflect the performance results of Navellier’s actually funded and traded Investment Products. In most cases, Navellier’s Investment Products have materially lower performance results than the performances of the model portfolios presented.
This report contains statements that are, or may be considered to be, forward-looking statements. All statements that are not historical facts, including statements about our beliefs or expectations, are “forward-looking statements” within the meaning of The U.S. Private Securities Litigation Reform Act of 1995. These statements may be identified by such forward-looking terminology as “expect,” “estimate,” “plan,” “intend,” “believe,” “anticipate,” “may,” “will,” “should,” “could,” “continue,” “project,” or similar statements or variations of such terms. Our forward-looking statements are based on a series of expectations, assumptions, and projections, are not guarantees of future results or performance, and involve substantial risks and uncertainty as described in Form ADV Part 2A of our filing with the Securities and Exchange Commission (SEC), which is available at www.adviserinfo.sec.gov or by requesting a copy by emailing info@navellier.com. All of our forward-looking statements are as of the date of this report only. We can give no assurance that such expectations or forward-looking statements will prove to be correct. Actual results may differ materially. You are urged to carefully consider all such factors.
FEDERAL TAX ADVICE DISCLAIMER: As required by U.S. Treasury Regulations, you are informed that, to the extent this presentation includes any federal tax advice, the presentation is not written by Navellier to be used, and cannot be used, for the purpose of avoiding federal tax penalties. Navellier does not advise on any income tax requirements or issues. Use of any information presented by Navellier is for general information only and does not represent tax advice either express or implied. You are encouraged to seek professional tax advice for income tax questions and assistance.
IMPORTANT NEWSLETTER DISCLOSURE:The hypothetical performance results for investment newsletters that are authored or edited by Louis Navellier, including Louis Navellier’s Growth Investor, Louis Navellier’s Breakthrough Stocks, Louis Navellier’s Accelerated Profits, and Louis Navellier’s Platinum Club, are not based on any actual securities trading, portfolio, or accounts, and the newsletters’ reported hypothetical performances should be considered mere “paper” or proforma hypothetical performance results and are not actual performance of real world trades. Navellier & Associates, Inc. does not have any relation to or affiliation with the owner of these newsletters. There are material differences between Navellier Investment Products’ portfolios and the InvestorPlace Media, LLC newsletter portfolios authored by Louis Navellier. The InvestorPlace Media, LLC newsletters contain hypothetical performance that do not include transaction costs, advisory fees, or other fees a client might incur if actual investments and trades were being made by an investor. As a result, newsletter performance should not be used to evaluate Navellier Investment services which are separate and different from the newsletters. The owner of the newsletters is InvestorPlace Media, LLC and any questions concerning the newsletters, including any newsletter advertising or hypothetical Newsletter performance claims, (which are calculated solely by Investor Place Media and not Navellier) should be referred to InvestorPlace Media, LLC at (800) 718-8289.
Please note that Navellier & Associates and the Navellier Private Client Group are managed completely independent of the newsletters owned and published by InvestorPlace Media, LLC and written and edited by Louis Navellier, and investment performance of the newsletters should in no way be considered indicative of potential future investment performance for any Navellier & Associates separately managed account portfolio. Potential investors should consult with their financial advisor before investing in any Navellier Investment Product.
Navellier claims compliance with Global Investment Performance Standards (GIPS). To receive a complete list and descriptions of Navellier’s composites and/or a presentation that adheres to the GIPS standards, please contact Navellier or click here. It should not be assumed that any securities recommendations made by Navellier & Associates, Inc. in the future will be profitable or equal the performance of securities made in this report.
FactSet Disclosure: Navellier does not independently calculate the statistical information included in the attached report. The calculation and the information are provided by FactSet, a company not related to Navellier. Although information contained in the report has been obtained from FactSet and is based on sources Navellier believes to be reliable, Navellier does not guarantee its accuracy, and it may be incomplete or condensed. The report and the related FactSet sourced information are provided on an “as is” basis. The user assumes the entire risk of any use made of this information. Investors should consider the report as only a single factor in making their investment decision. The report is for informational purposes only and is not intended as an offer or solicitation for the purchase or sale of a security. FactSet sourced information is the exclusive property of FactSet. Without prior written permission of FactSet, this information may not be reproduced, disseminated or used to create any financial products. All indices are unmanaged and performance of the indices include reinvestment of dividends and interest income, unless otherwise noted, are not illustrative of any particular investment and an investment cannot be made in any index. Past performance is no guarantee of future results.