by Jason Bodner
May 29, 2024
I used to worry all the time about everything: about my kids, my money, if the dog looked sick, the environment, world war, disease, interest rates and, of course, the stock market.
It was exhausting.
I used to worry, but I don’t worry anymore. It took work, but I just stopped worrying.
How did that happen? Let me explain…
I analyzed my time wasted in worrying. What was I really trying to accomplish? It’s human nature to want to control everything we can. It’s our attempt to tame uncertainty. On the good side, it gives us the illusion of control. On the bad side, we are wasting very precious time.
The average lifespan of an adult male is around 77.5 years. Breaking down our days, studies show that the average amount of free time we have (not devoted to work, chores, or sleep) is about five hours a day. Put another way, only 20% of our lives is really “free” time.
Here’s where science reveals how we hurt ourselves: According to a 2019 Penn State study, 91% of our worries don’t happen. This was corroborated by a Cornell University study that found the number to be 85%. Let’s take the midpoint and say that 88% of what we worry about doesn’t happen, so when we worry about things we can’t control, we are wasting 88% of our time.
Fear and anxiety can be very destructive in the short-term. But the fact that’s it’s 88% unfounded (give or take 3%) can be visualized with a simple chart of stocks for the last 100 years.
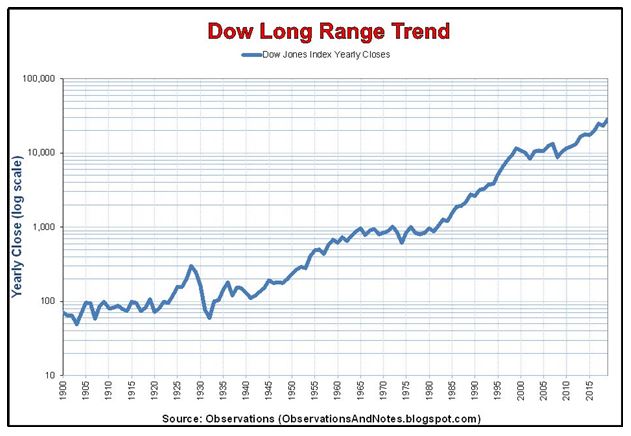
Graphs are for illustrative and discussion purposes only. Please read important disclosures at the end of this commentary.
That chart looks fairly tame, since it is based on logarithmic units of 10, but if we remove the logarithmic scale, we see that growth started to skyrocket in the early 1980s:
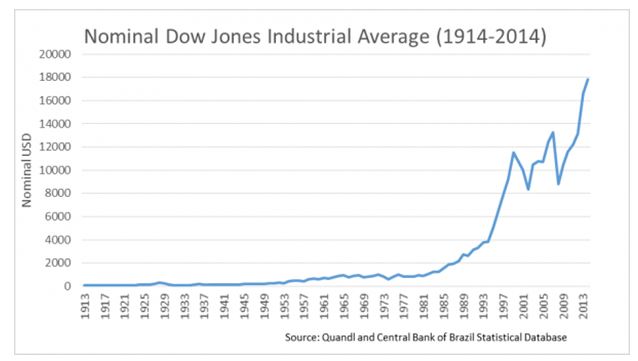
Graphs are for illustrative and discussion purposes only. Please read important disclosures at the end of this commentary.
Interestingly, this was in no small part due to ERISA. The Employee Retirement Income Security Act of 1974 (ERISA), which paved the way for privately directed pension plans via IRAs and 401(k)s. In other words, there is a constant bid for stocks. The wind is at our collective backs.
Naturally, this doesn’t mean that we won’t have bumps and bruises along the way, as in 1987 (now invisible on both charts), or 2001 and 2008. But in our everyday lives, if we worry so much about the bumps and bruises that come with living, we might miss out on the living part.
When it comes to our investments, when things get bumpy, hindsight usually tells us that it’s best to do nothing. Those recent valleys in the chart above are 9/11 and the Great Financial Crisis. (Those charts are not updated for COVID, but since that passed even more quickly than 2008-2009).
During May, Wall Street sputtered to new highs on a new wall of worry. Anxiety over interest rates, inflation, and when (not whether) the Fed will cut rates caused a stomach-churning month for stocks. It’s enough to keep you up at night and keep a fresh bottle of Pepto-Bismol at hand.
But ask yourself this: Will worrying help us if it caused us to bail out and then we see a three-month market surge, or a very strong year? Philosophy is nice, but we are market scientists here, and the data is conclusive: Stop worrying, it’s bad for your personal and financial health.
Last week I pointed out that money flows had bottomed out and started moving into stocks. This “cup” pattern (a “U” pattern) has now made its third appearance in the last year:
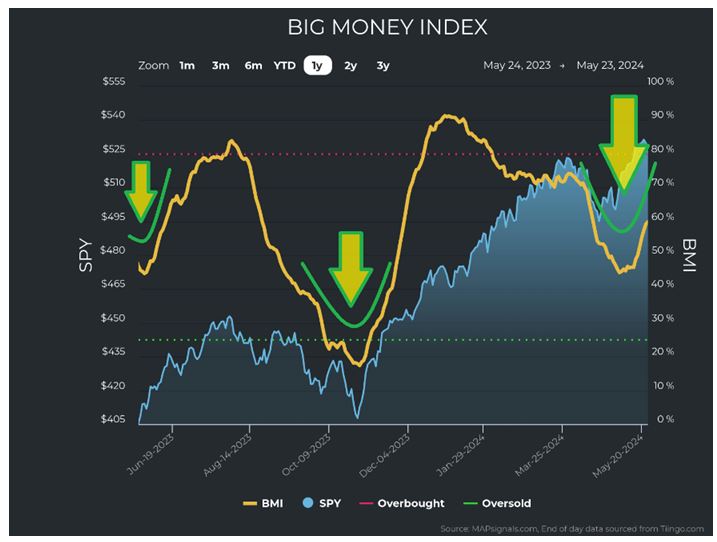
Graphs are for illustrative and discussion purposes only. Please read important disclosures at the end of this commentary.
When I dug into the data behind this, I found some very promising results. This is the daily Big Money Index (BMI) starting on April 1st. You can see many consecutive days of falling in the third column, coinciding with the trading days in April, then a run of rising days, May 6 to 23:
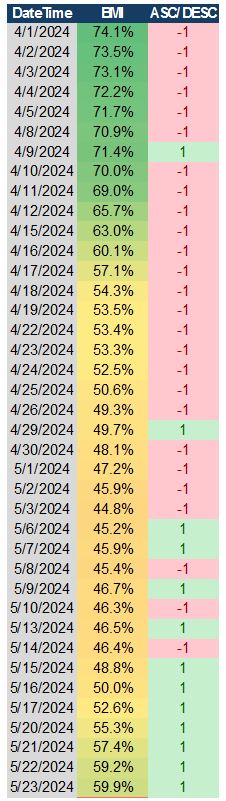
Source: Mapsignals
Graphs are for illustrative and discussion purposes only. Please read important disclosures at the end of this commentary.
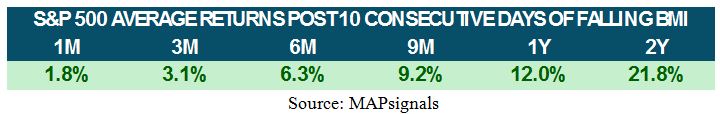
The BMI fell for 10 consecutive trading days, April 10-26. I looked for similar times. There were 737 days since 1990, or 8.5% of all trading days. These were the forward returns of the S&P 500 after 10 consecutive days of a falling BMI:
Graphs are for illustrative and discussion purposes only. Please read important disclosures at the end of this commentary.
You should know that despite this being relatively rare, at 8.5% of the time, it happened every year since 1990. Sometimes multiple times in a year, but always at least once. So why worry?
Because we always worry. That’s the nature of traders. For instance, last Wednesday, bellwether stock NVDA reported beating earnings and sales expectations and cited insatiable demand. The outcome was once again better than expected, which should have lifted the market. Initially it did, but then the market turned ugly.
So, we could worry about that. We could also worry that the BMI rose for seven consecutive trading days, May 15-23. If markets rise when the BMI falls 10 days in a row, shouldn’t we worry?
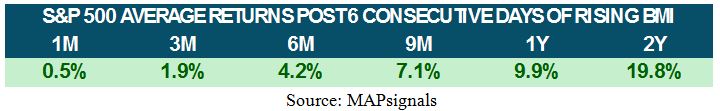
Never fear, I looked at that, too. The BMI rose seven or more consecutive trading days 3,640 times since 1990. This is far more common, 42.5% of the time. Here are the forward returns:
Graphs are for illustrative and discussion purposes only. Please read important disclosures at the end of this commentary.
Those are lower returns than the falling BMI returns listed above, but still pretty rosy returns.
You tell me now: Should we worry? I think not.
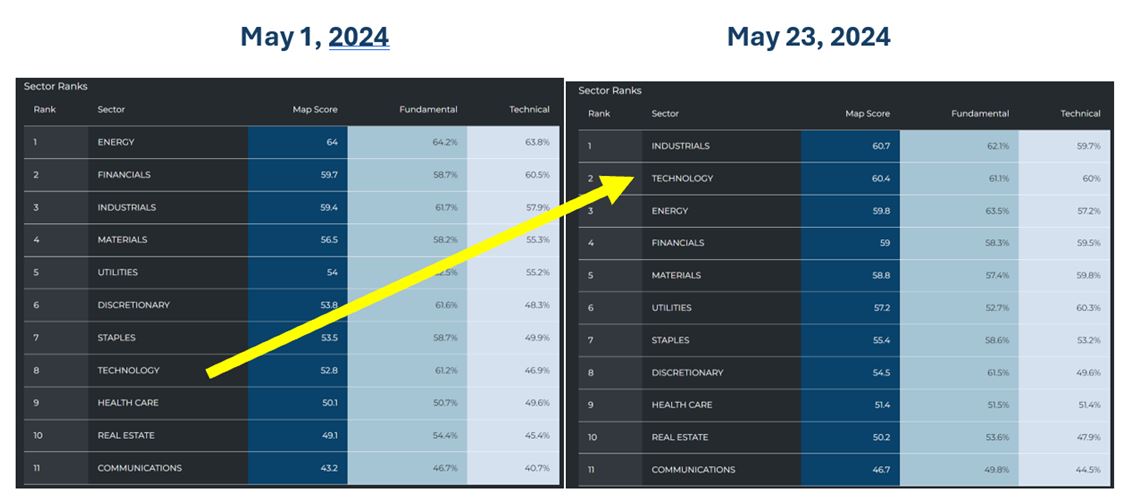
I see other reasons not to worry when we look at sectors. Below, we see the sector ranks from May 1st on the left and May 23rd on the right. Notice that Technology has powered six slots higher on the list in the last three weeks. That’s a meteoric rise. I find this reason enough for cheer because bull markets are at their strongest when led by growth sectors.
Graphs are for illustrative and discussion purposes only. Please read important disclosures at the end of this commentary.
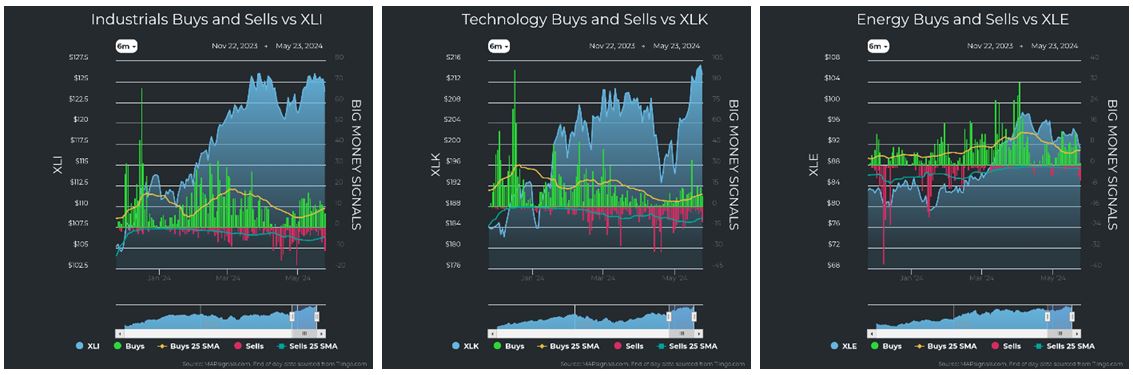
Next, let’s look at the buying and selling in the top three and bottom three sectors:
Graphs are for illustrative and discussion purposes only. Please read important disclosures at the end of this commentary.
Technology is clearly gaining strength. Industrials and Energy see no real signs of selling to fret over.
Now for the bottom three:
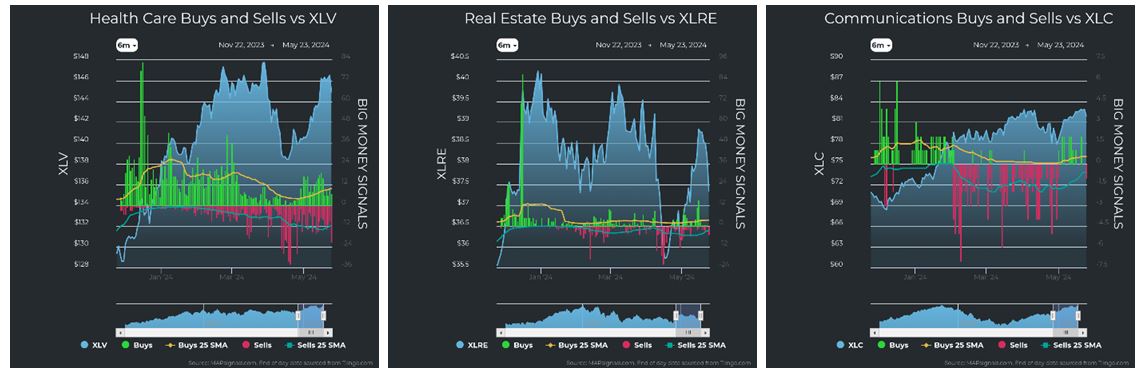
Graphs are for illustrative and discussion purposes only. Please read important disclosures at the end of this commentary.
Even though they are basement dwellers, I see no reason for worry. The most recent Health Care selling spike was led by only 21 stocks.
So, earnings season has concluded. This would be a normal time to expect volatility. (“When the cat’s away the mice will play.”) But seasonality paints a different picture. May has lived up to expectations (April did not). June historically is mixed, while July is strong:
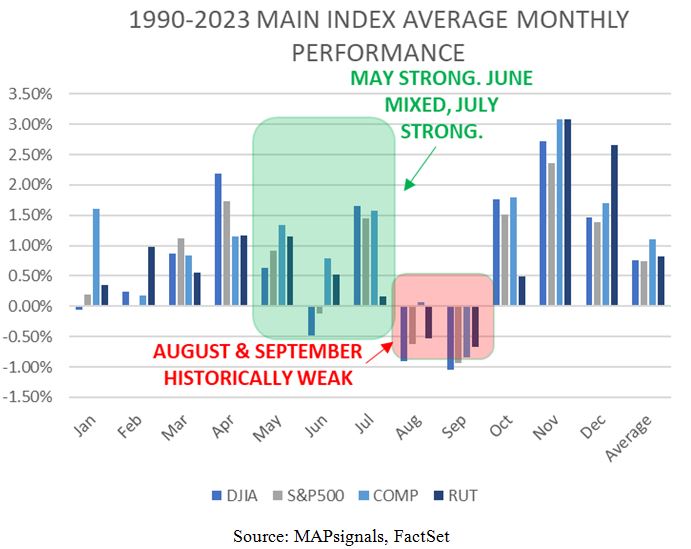
Graphs are for illustrative and discussion purposes only. Please read important disclosures at the end of this commentary.
For me, the easiest way to avoid worrying about markets is to focus on finding the best quality stocks. The data says everything else has a way of working itself out. So, stop worrying. Time can be wasted, but never bought back, so spend your time doing something that brings you joy and peace. And remember:
“If you see ten troubles coming down the road, you can be sure that nine will run into the ditch before they reach you.” – Calvin Coolidge (U.S. President from 1923 to 1929)

Navellier & Associates owns Nvidia Corp (NVDA), in managed accounts. Jason Bodner owns Nvidia Corp (NVDA) in a personal account.
All content above represents the opinion of Jason Bodner of Navellier & Associates, Inc.
Also In This Issue
A Look Ahead by Louis Navellier
Why June Could Bring a Return of $90 to $100 Crude Oil Prices
Income Mail by Bryan Perry
How to Add Premium Income from Selling Covered-Calls in Big Cap AI Stocks
Growth Mail by Gary Alexander
Remembering Our Dark Summers 50 and 100 Years Ago
Global Mail by Ivan Martchev
The Stock Market is Channeling Yogi Berra
Sector Spotlight by Jason Bodner
Don’t Worry: Be Healthy, Happy (and Richer)
View Full Archive
Read Past Issues Here

Jason Bodner
MARKETMAIL EDITOR FOR SECTOR SPOTLIGHT
Jason Bodner writes Sector Spotlight in the weekly Marketmail publication and has authored several white papers for the company. He is also Co-Founder of Macro Analytics for Professionals which produces proprietary equity accumulation/distribution research for its clients. Previously, Mr. Bodner served as Director of European Equity Derivatives for Cantor Fitzgerald Europe in London, then moved to the role of Head of Equity Derivatives North America for the same company in New York. He also served as S.V.P. Equity Derivatives for Jefferies, LLC. He received a B.S. in business administration in 1996, with honors, from Skidmore College as a member of the Periclean Honors Society. All content of “Sector Spotlight” represents the opinion of Jason Bodner
Important Disclosures:
Jason Bodner is a co-founder and co-owner of Mapsignals. Mr. Bodner is an independent contractor who is occasionally hired by Navellier & Associates to write an article and or provide opinions for possible use in articles that appear in Navellier & Associates weekly Market Mail. Mr. Bodner is not employed or affiliated with Louis Navellier, Navellier & Associates, Inc., or any other Navellier owned entity. The opinions and statements made here are those of Mr. Bodner and not necessarily those of any other persons or entities. This is not an endorsement, or solicitation or testimonial or investment advice regarding the BMI Index or any statements or recommendations or analysis in the article or the BMI Index or Mapsignals or its products or strategies.
Although information in these reports has been obtained from and is based upon sources that Navellier believes to be reliable, Navellier does not guarantee its accuracy and it may be incomplete or condensed. All opinions and estimates constitute Navellier’s judgment as of the date the report was created and are subject to change without notice. These reports are for informational purposes only and are not a solicitation for the purchase or sale of a security. Any decision to purchase securities mentioned in these reports must take into account existing public information on such securities or any registered prospectus.To the extent permitted by law, neither Navellier & Associates, Inc., nor any of its affiliates, agents, or service providers assumes any liability or responsibility nor owes any duty of care for any consequences of any person acting or refraining to act in reliance on the information contained in this communication or for any decision based on it.
Past performance is no indication of future results. Investment in securities involves significant risk and has the potential for partial or complete loss of funds invested. It should not be assumed that any securities recommendations made by Navellier. in the future will be profitable or equal the performance of securities made in this report. Dividend payments are not guaranteed. The amount of a dividend payment, if any, can vary over time and issuers may reduce dividends paid on securities in the event of a recession or adverse event affecting a specific industry or issuer.
None of the stock information, data, and company information presented herein constitutes a recommendation by Navellier or a solicitation to buy or sell any securities. Any specific securities identified and described do not represent all of the securities purchased, sold, or recommended for advisory clients. The holdings identified do not represent all of the securities purchased, sold, or recommended for advisory clients and the reader should not assume that investments in the securities identified and discussed were or will be profitable.
Information presented is general information that does not take into account your individual circumstances, financial situation, or needs, nor does it present a personalized recommendation to you. Individual stocks presented may not be suitable for every investor. Investment in securities involves significant risk and has the potential for partial or complete loss of funds invested. Investment in fixed income securities has the potential for the investment return and principal value of an investment to fluctuate so that an investor’s holdings, when redeemed, may be worth less than their original cost.
One cannot invest directly in an index. Index is unmanaged and index performance does not reflect deduction of fees, expenses, or taxes. Presentation of Index data does not reflect a belief by Navellier that any stock index constitutes an investment alternative to any Navellier equity strategy or is necessarily comparable to such strategies. Among the most important differences between the Indices and Navellier strategies are that the Navellier equity strategies may (1) incur material management fees, (2) concentrate its investments in relatively few stocks, industries, or sectors, (3) have significantly greater trading activity and related costs, and (4) be significantly more or less volatile than the Indices.
ETF Risk: We may invest in exchange traded funds (“ETFs”) and some of our investment strategies are generally fully invested in ETFs. Like traditional mutual funds, ETFs charge asset-based fees, but they generally do not charge initial sales charges or redemption fees and investors typically pay only customary brokerage fees to buy and sell ETF shares. The fees and costs charged by ETFs held in client accounts will not be deducted from the compensation the client pays Navellier. ETF prices can fluctuate up or down, and a client account could lose money investing in an ETF if the prices of the securities owned by the ETF go down. ETFs are subject to additional risks:
- ETF shares may trade above or below their net asset value;
- An active trading market for an ETF’s shares may not develop or be maintained;
- The value of an ETF may be more volatile than the underlying portfolio of securities the ETF is designed to track;
- The cost of owning shares of the ETF may exceed those a client would incur by directly investing in the underlying securities; and
- Trading of an ETF’s shares may be halted if the listing exchange’s officials deem it appropriate, the shares are delisted from the exchange, or the activation of market-wide “circuit breakers” (which are tied to large decreases in stock prices) halts stock trading generally.
Grader Disclosures: Investment in equity strategies involves substantial risk and has the potential for partial or complete loss of funds invested. The sample portfolio and any accompanying charts are for informational purposes only and are not to be construed as a solicitation to buy or sell any financial instrument and should not be relied upon as the sole factor in an investment making decision. As a matter of normal and important disclosures to you, as a potential investor, please consider the following: The performance presented is not based on any actual securities trading, portfolio, or accounts, and the reported performance of the A, B, C, D, and F portfolios (collectively the “model portfolios”) should be considered mere “paper” or pro forma performance results based on Navellier’s research.
Investors evaluating any of Navellier & Associates, Inc.’s, (or its affiliates’) Investment Products must not use any information presented here, including the performance figures of the model portfolios, in their evaluation of any Navellier Investment Products. Navellier Investment Products include the firm’s mutual funds and managed accounts. The model portfolios, charts, and other information presented do not represent actual funded trades and are not actual funded portfolios. There are material differences between Navellier Investment Products’ portfolios and the model portfolios, research, and performance figures presented here. The model portfolios and the research results (1) may contain stocks or ETFs that are illiquid and difficult to trade; (2) may contain stock or ETF holdings materially different from actual funded Navellier Investment Product portfolios; (3) include the reinvestment of all dividends and other earnings, estimated trading costs, commissions, or management fees; and, (4) may not reflect prices obtained in an actual funded Navellier Investment Product portfolio. For these and other reasons, the reported performances of model portfolios do not reflect the performance results of Navellier’s actually funded and traded Investment Products. In most cases, Navellier’s Investment Products have materially lower performance results than the performances of the model portfolios presented.
This report contains statements that are, or may be considered to be, forward-looking statements. All statements that are not historical facts, including statements about our beliefs or expectations, are “forward-looking statements” within the meaning of The U.S. Private Securities Litigation Reform Act of 1995. These statements may be identified by such forward-looking terminology as “expect,” “estimate,” “plan,” “intend,” “believe,” “anticipate,” “may,” “will,” “should,” “could,” “continue,” “project,” or similar statements or variations of such terms. Our forward-looking statements are based on a series of expectations, assumptions, and projections, are not guarantees of future results or performance, and involve substantial risks and uncertainty as described in Form ADV Part 2A of our filing with the Securities and Exchange Commission (SEC), which is available at www.adviserinfo.sec.gov or by requesting a copy by emailing info@navellier.com. All of our forward-looking statements are as of the date of this report only. We can give no assurance that such expectations or forward-looking statements will prove to be correct. Actual results may differ materially. You are urged to carefully consider all such factors.
FEDERAL TAX ADVICE DISCLAIMER: As required by U.S. Treasury Regulations, you are informed that, to the extent this presentation includes any federal tax advice, the presentation is not written by Navellier to be used, and cannot be used, for the purpose of avoiding federal tax penalties. Navellier does not advise on any income tax requirements or issues. Use of any information presented by Navellier is for general information only and does not represent tax advice either express or implied. You are encouraged to seek professional tax advice for income tax questions and assistance.
IMPORTANT NEWSLETTER DISCLOSURE:The hypothetical performance results for investment newsletters that are authored or edited by Louis Navellier, including Louis Navellier’s Growth Investor, Louis Navellier’s Breakthrough Stocks, Louis Navellier’s Accelerated Profits, and Louis Navellier’s Platinum Club, are not based on any actual securities trading, portfolio, or accounts, and the newsletters’ reported hypothetical performances should be considered mere “paper” or proforma hypothetical performance results and are not actual performance of real world trades. Navellier & Associates, Inc. does not have any relation to or affiliation with the owner of these newsletters. There are material differences between Navellier Investment Products’ portfolios and the InvestorPlace Media, LLC newsletter portfolios authored by Louis Navellier. The InvestorPlace Media, LLC newsletters contain hypothetical performance that do not include transaction costs, advisory fees, or other fees a client might incur if actual investments and trades were being made by an investor. As a result, newsletter performance should not be used to evaluate Navellier Investment services which are separate and different from the newsletters. The owner of the newsletters is InvestorPlace Media, LLC and any questions concerning the newsletters, including any newsletter advertising or hypothetical Newsletter performance claims, (which are calculated solely by Investor Place Media and not Navellier) should be referred to InvestorPlace Media, LLC at (800) 718-8289.
Please note that Navellier & Associates and the Navellier Private Client Group are managed completely independent of the newsletters owned and published by InvestorPlace Media, LLC and written and edited by Louis Navellier, and investment performance of the newsletters should in no way be considered indicative of potential future investment performance for any Navellier & Associates separately managed account portfolio. Potential investors should consult with their financial advisor before investing in any Navellier Investment Product.
Navellier claims compliance with Global Investment Performance Standards (GIPS). To receive a complete list and descriptions of Navellier’s composites and/or a presentation that adheres to the GIPS standards, please contact Navellier or click here. It should not be assumed that any securities recommendations made by Navellier & Associates, Inc. in the future will be profitable or equal the performance of securities made in this report.
FactSet Disclosure: Navellier does not independently calculate the statistical information included in the attached report. The calculation and the information are provided by FactSet, a company not related to Navellier. Although information contained in the report has been obtained from FactSet and is based on sources Navellier believes to be reliable, Navellier does not guarantee its accuracy, and it may be incomplete or condensed. The report and the related FactSet sourced information are provided on an “as is” basis. The user assumes the entire risk of any use made of this information. Investors should consider the report as only a single factor in making their investment decision. The report is for informational purposes only and is not intended as an offer or solicitation for the purchase or sale of a security. FactSet sourced information is the exclusive property of FactSet. Without prior written permission of FactSet, this information may not be reproduced, disseminated or used to create any financial products. All indices are unmanaged and performance of the indices include reinvestment of dividends and interest income, unless otherwise noted, are not illustrative of any particular investment and an investment cannot be made in any index. Past performance is no guarantee of future results.