by Jason Bodner
May 28, 2025
Scanning the news feed is not for the faint of heart. A few recent headlines make my point:
- President Trump is embroiled in a battle with Harvard over admitting foreign students.
- Two Israeli Embassy staffers were gunned down at a Jewish Museum.
- The Ukraine-Russia war drags on.
- A record number of Americans applied for foreign citizenship to escape Trump’s second term.
- Trump is fighting openly with Bruce Springsteen.
- “Sell America” is gaining momentum as rising U.S. bonds yields put pressure on stocks.
- And, to add insult to injury, the New York Islanders have the #1 NHL draft pick for next year.
It’s all a bit much, and a new bout of negative sentiment can shake some investors out of their stocks, but I’m here to tell you that would be a bad idea, historically speaking, since when you tune out the media din, the data is not looking bad at all. Here’s what I see when I turn off the news and consult the data:
First, the Big Money Index (BMI) shows us that, ever since the lows of April 8th, the overall direction of money is into stocks. We’ve seen a near parabolic rise since early April, when the BMI was in the mid-30s to now, just shy of 70%, which means that 70% of all signals over the past 25-days were inflows:
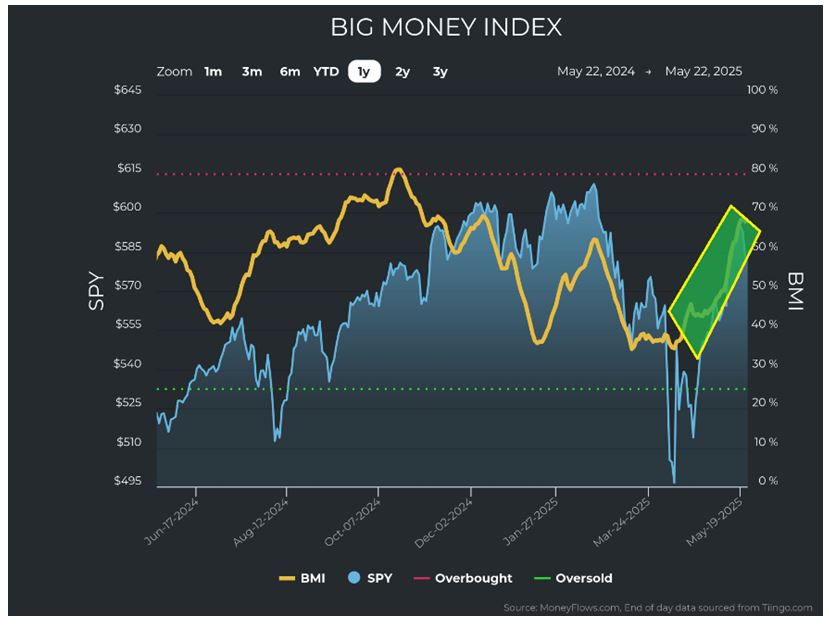
Graphs are for illustrative and discussion purposes only. Please read important disclosures at the end of this commentary.
Originally, this rise in the BMI was due to immense outflows suddenly stopping. But since a week and a half ago, we have seen steady inflows in both stocks and ETFs:
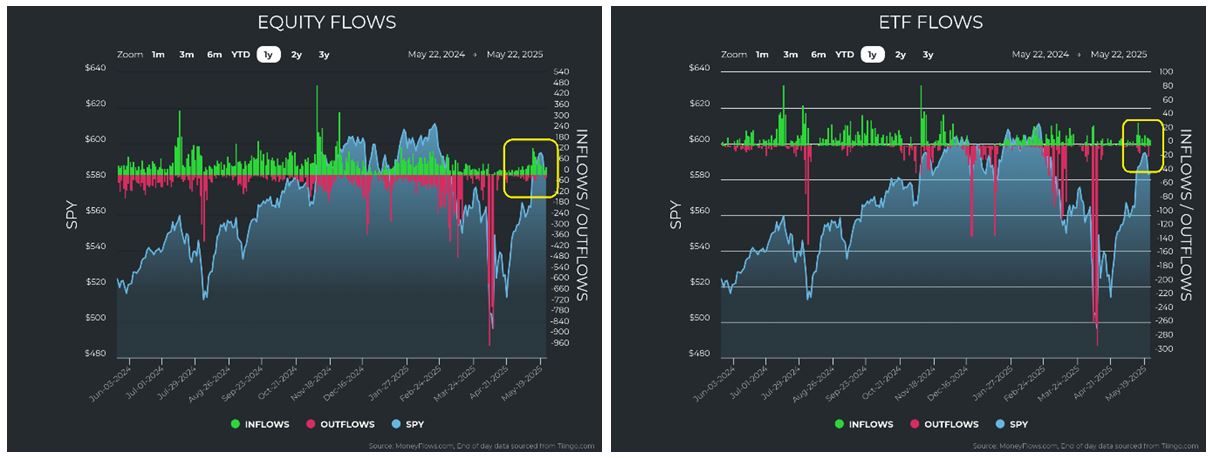
Graphs are for illustrative and discussion purposes only. Please read important disclosures at the end of this commentary.
This is not mere short covering, as that time has largely passed. In the third week of every month, FINRA updates its Margin Debt Statistics. The number peaked at an all-time-high of $937-billion in January of 2025. We just got the numbers for April, where we see that margin debt has dropped to $850-billion.
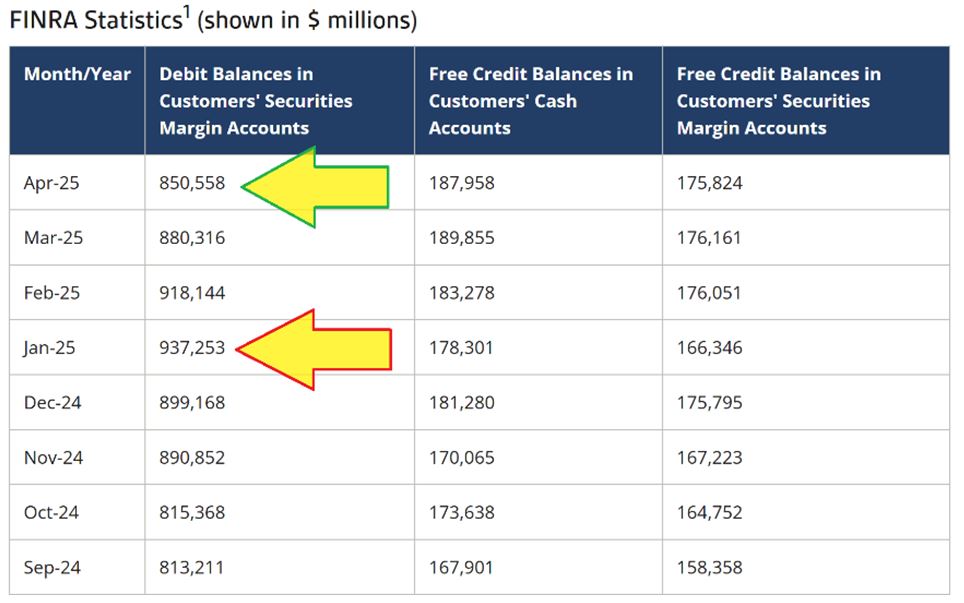
Source: FINRA
Graphs are for illustrative and discussion purposes only. Please read important disclosures at the end of this commentary.
While a 9.3% drop may not seem like much, keep in mind that’s the amount of credit extended, but it can be leveraged, so if clients borrowed $87-billion more dollars in January, if that were leveraged 3-to-1, that is $261-billion coming out of the system. When leverage comes out due to shocks to the system such as Trump’s announcement on Liberation Day, there is tight correlation with a drop in equity prices.
It looks like this:
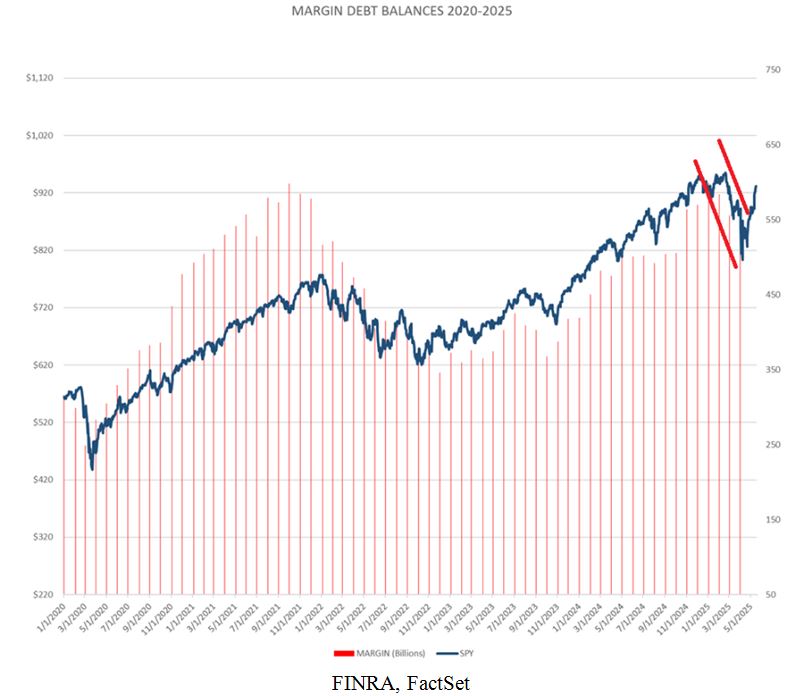
Graphs are for illustrative and discussion purposes only. Please read important disclosures at the end of this commentary.
This deleveraging event is over for now. When margin calls come, those using it, must sell whether they want to or not. After that, investors stepped in to buy the castaways of the forced selling event.
There are other signs that our recent rally from April’s lows was not merely short covering. The beauty of watching money flow is that you can actually see where the fund flows take you. Here, we see that since the pause of China-US tariffs on May 12th, there were substantial inflows into small and mid-cap stocks:
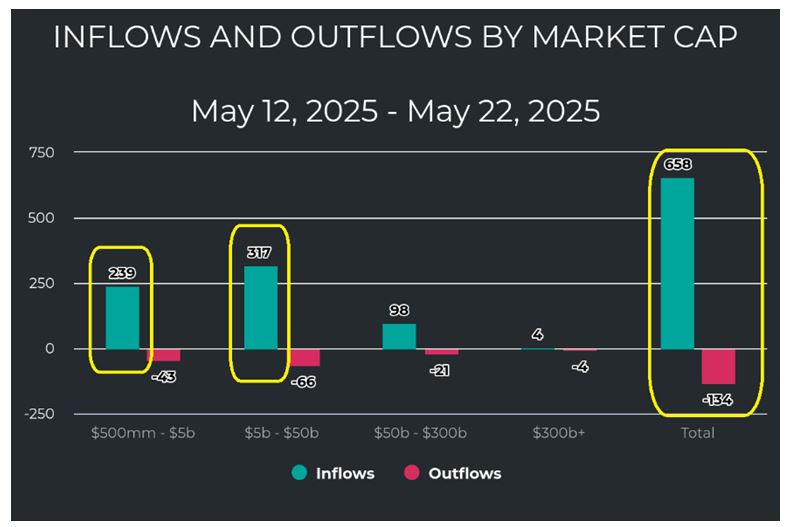
Graphs are for illustrative and discussion purposes only. Please read important disclosures at the end of this commentary.
We also see clearly, in the table above, that inflows outpaced outflows by nearly 5-to-1 in the 10-days between May 12th and May 22nd. What’s more, we can see there have been inflows into growth areas of the market. The rise in Discretionary and Technology-sectors indicate a risk-on mentality, despite what the news is telling us. We see on the left that Technology and Discretionary were the lowest ranked sectors at market lows on April 8th. Now we see they rose substantially in the rankings while the defensive Staples sector fell:
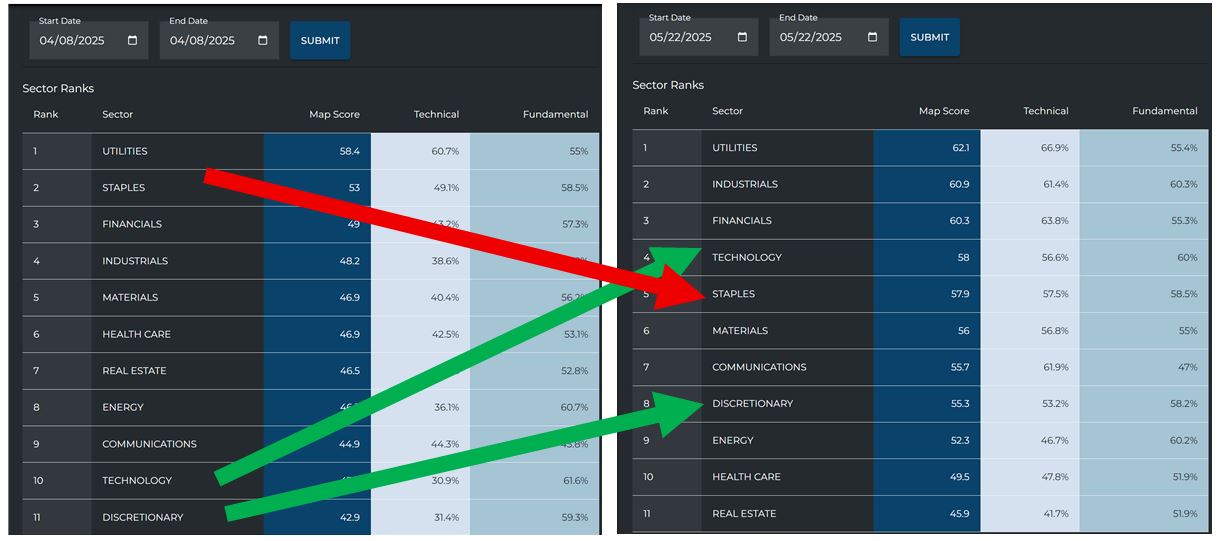
Graphs are for illustrative and discussion purposes only. Please read important disclosures at the end of this commentary.
Layer this constructive data with recent inflows in previously beaten-down sectors, and we can begin to celebrate. Below, we see inflows into Industrials, Technology, Materials, Discretionary and Energy:
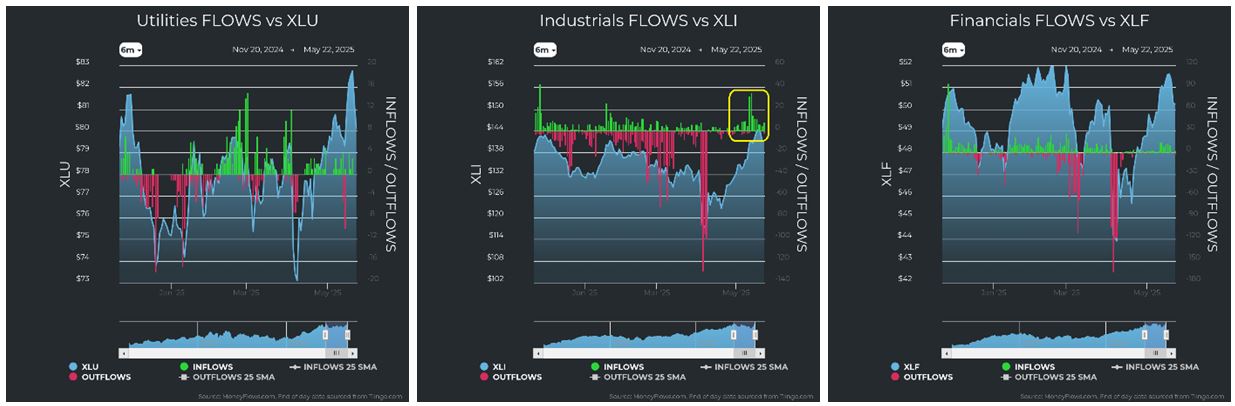
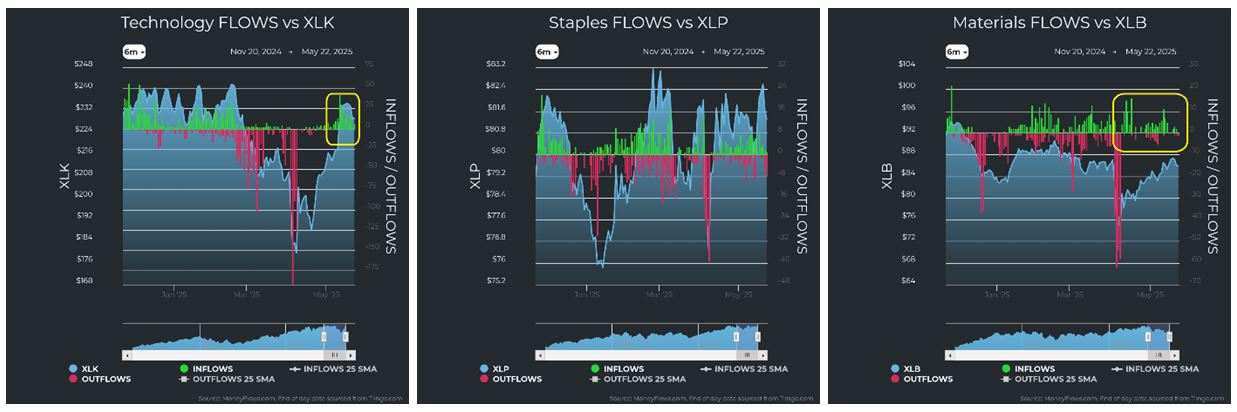
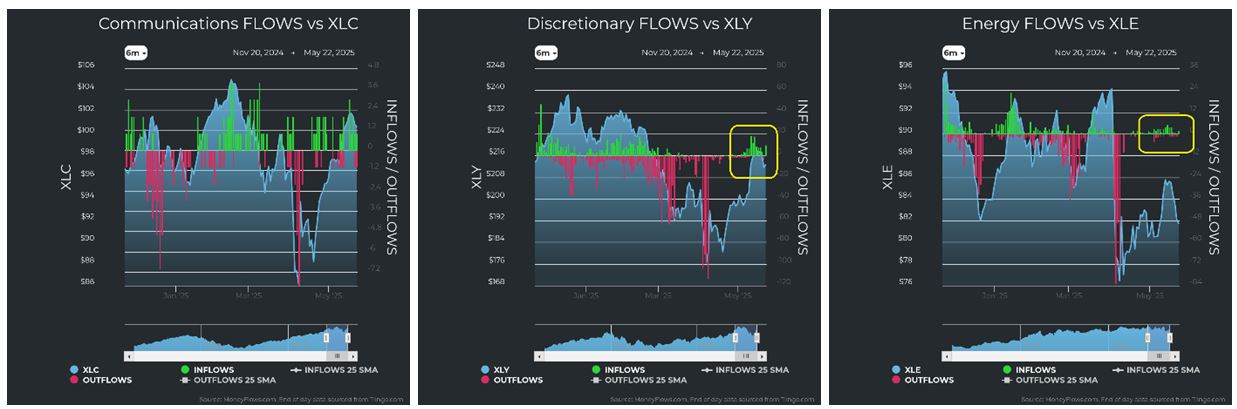
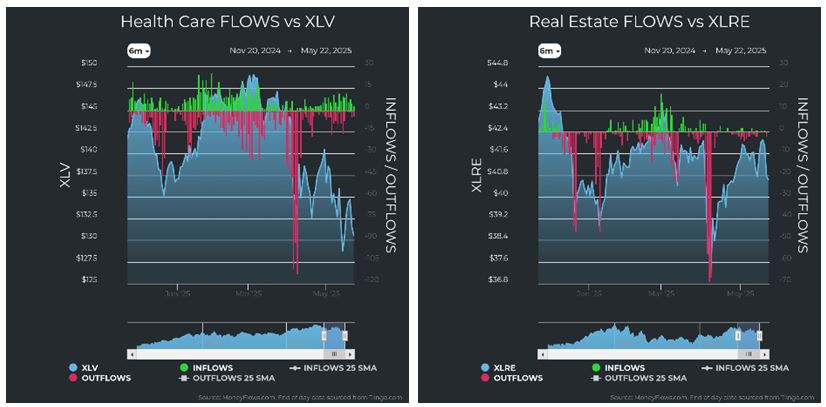
Graphs are for illustrative and discussion purposes only. Please read important disclosures at the end of this commentary.
This is very positive data.
Want some more good news? Earnings are working well. According to FactSet, For Q1 2025 (with 96% of S&P 500 companies reporting actual results), 78% of S&P 500 companies beat EPS and 63% beat revenue. This is, of course, fantastic, but it also reconciles with the multi-year trend:
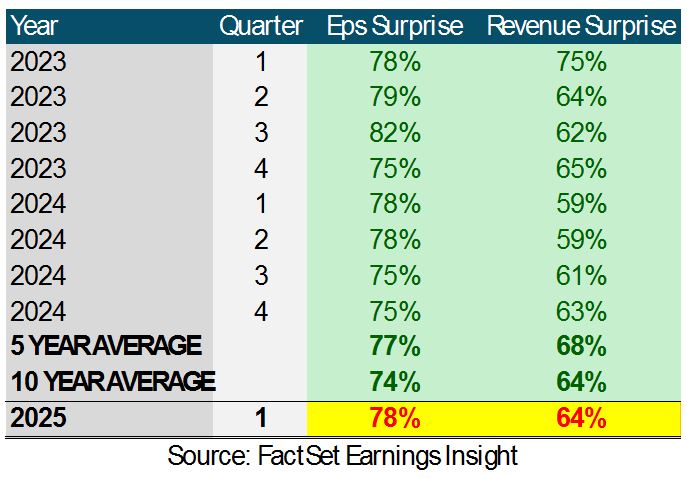
Graphs are for illustrative and discussion purposes only. Please read important disclosures at the end of this commentary.
The bad news is that guidance for some companies is proving to be a challenge, what with unknown tariffs on foreign trade inputs. Some companies reported earnings and sales above estimates but then lowered guidance. Some companies even pulled their full-year guidance as they struggle to see the future potential impacts of uncertain trade policy and how it might affect their businesses. When companies are uncertain, Wall Street is uncertain. If there is one thing Wall Street hates, it is uncertainty.
But these momentary assaults of bad news don’t seem to have much of a heavy effect on stocks. Just 12-days ago, Moody’s downgraded U.S. debt. That ominous headline surely should have sent stocks reeling, but the market shrugged it off. Trump attacked Apple, threatening possible tariffs if they don’t make their phones domestically. Stocks gapped-down on the news, but they were bought back throughout the day. The news tries to keep us engaged, using fear and doubt as their addictive agent. But when we separate fact from fiction, and logic from emotion, we see a clearer picture. I believe it is still a good overall time to buy equities. I believe these trade issues will be resolved. I believe the tax bill will pass. I believe interest rates will fall, and I believe this will all happen before mid-term election campaigning begins.
A century of stock returns tells us to buy on the dips – however fearsome they may be. The Great Financial Crisis low of 2008-09 saw SPY close at $50.33 on March 9th of 2009. Today the SPY is at $583.09, or 1,059% higher. And that was during the midst of a non-stop onslaught of negative news.
Don’t lose the forest through the trees. Focus on what is, not the worst of what could be.
““Your problem isn’t external things. The real problem is the assessment you make of them.”
– Marcus Aurelius
Navellier & Associates; own Apple Inc. (AAPL), in managed accounts. Jason Bodner does not Apple Inc. (AAPL), personally.
All content above represents the opinion of Jason Bodner of Navellier & Associates, Inc.
Also In This Issue
A Look Ahead by Louis Navellier
The Press (and Investors) No Longer Fear Tariffs, But the Fed Still Does
Income Mail by Bryan Perry
The Aerospace Defense Sector is Looking Bullet Proof
Growth Mail by Gary Alexander
Saluting Some Great Heroes of Economic Freedom…on Flag Day
Global Mail by Ivan Martchev
A Trillion Dollar Tweet – or Two
Sector Spotlight by Jason Bodner
Ignore the News Feed, For Your Psychological (and Financial) Health
View Full Archive
Read Past Issues Here

Jason Bodner
MARKETMAIL EDITOR FOR SECTOR SPOTLIGHT
Jason Bodner writes Sector Spotlight in the weekly Marketmail publication and has authored several white papers for the company. He is also Co-Founder of Macro Analytics for Professionals which produces proprietary equity accumulation and distribution research for its clients. Previously, Mr. Bodner served as Director of European Equity Derivatives for Cantor Fitzgerald Europe in London, then moved to the role of Head of Equity Derivatives North America for the same company in New York. He also served as S.V.P. Equity Derivatives for Jefferies, LLC. He received a B.S. in business administration in 1996, with honors, from Skidmore College as a member of the Periclean Honors Society. All content of “Sector Spotlight” represents the opinion of Jason Bodner
Important Disclosures:
Jason Bodner is a co-founder and co-owner of Mapsignals. Mr. Bodner is an independent contractor who is occasionally hired by Navellier & Associates to write an article and or provide opinions for possible use in articles that appear in Navellier & Associates weekly Market Mail. Mr. Bodner is not employed or affiliated with Louis Navellier, Navellier & Associates, Inc., or any other Navellier owned entity. The opinions and statements made here are those of Mr. Bodner and not necessarily those of any other persons or entities. This is not an endorsement, or solicitation or testimonial or investment advice regarding the BMI Index or any statements or recommendations or analysis in the article or the BMI Index or Mapsignals or its products or strategies.
Although information in these reports has been obtained from and is based upon sources that Navellier believes to be reliable, Navellier does not guarantee its accuracy and it may be incomplete or condensed. All opinions and estimates constitute Navellier’s judgment as of the date the report was created and are subject to change without notice. These reports are for informational purposes only and are not a solicitation for the purchase or sale of a security. Any decision to purchase securities mentioned in these reports must take into account existing public information on such securities or any registered prospectus.To the extent permitted by law, neither Navellier & Associates, Inc., nor any of its affiliates, agents, or service providers assumes any liability or responsibility nor owes any duty of care for any consequences of any person acting or refraining to act in reliance on the information contained in this communication or for any decision based on it.
Past performance is no indication of future results. Investment in securities involves significant risk and has the potential for partial or complete loss of funds invested. It should not be assumed that any securities recommendations made by Navellier. in the future will be profitable or equal the performance of securities made in this report. Dividend payments are not guaranteed. The amount of a dividend payment, if any, can vary over time and issuers may reduce dividends paid on securities in the event of a recession or adverse event affecting a specific industry or issuer.
None of the stock information, data, and company information presented herein constitutes a recommendation by Navellier or a solicitation to buy or sell any securities. Any specific securities identified and described do not represent all of the securities purchased, sold, or recommended for advisory clients. The holdings identified do not represent all of the securities purchased, sold, or recommended for advisory clients and the reader should not assume that investments in the securities identified and discussed were or will be profitable.
Information presented is general information that does not take into account your individual circumstances, financial situation, or needs, nor does it present a personalized recommendation to you. Individual stocks presented may not be suitable for every investor. Investment in securities involves significant risk and has the potential for partial or complete loss of funds invested. Investment in fixed income securities has the potential for the investment return and principal value of an investment to fluctuate so that an investor’s holdings, when redeemed, may be worth less than their original cost.
One cannot invest directly in an index. Index is unmanaged and index performance does not reflect deduction of fees, expenses, or taxes. Presentation of Index data does not reflect a belief by Navellier that any stock index constitutes an investment alternative to any Navellier equity strategy or is necessarily comparable to such strategies. Among the most important differences between the Indices and Navellier strategies are that the Navellier equity strategies may (1) incur material management fees, (2) concentrate its investments in relatively few stocks, industries, or sectors, (3) have significantly greater trading activity and related costs, and (4) be significantly more or less volatile than the Indices.
ETF Risk: We may invest in exchange traded funds (“ETFs”) and some of our investment strategies are generally fully invested in ETFs. Like traditional mutual funds, ETFs charge asset-based fees, but they generally do not charge initial sales charges or redemption fees and investors typically pay only customary brokerage fees to buy and sell ETF shares. The fees and costs charged by ETFs held in client accounts will not be deducted from the compensation the client pays Navellier. ETF prices can fluctuate up or down, and a client account could lose money investing in an ETF if the prices of the securities owned by the ETF go down. ETFs are subject to additional risks:
- ETF shares may trade above or below their net asset value;
- An active trading market for an ETF’s shares may not develop or be maintained;
- The value of an ETF may be more volatile than the underlying portfolio of securities the ETF is designed to track;
- The cost of owning shares of the ETF may exceed those a client would incur by directly investing in the underlying securities and;
- Trading of an ETF’s shares may be halted if the listing exchange’s officials deem it appropriate, the shares are delisted from the exchange, or the activation of market-wide “circuit breakers” (which are tied to large decreases in stock prices) halts stock trading generally.
Grader Disclosures: Investment in equity strategies involves substantial risk and has the potential for partial or complete loss of funds invested. The sample portfolio and any accompanying charts are for informational purposes only and are not to be construed as a solicitation to buy or sell any financial instrument and should not be relied upon as the sole factor in an investment making decision. As a matter of normal and important disclosures to you, as a potential investor, please consider the following: The performance presented is not based on any actual securities trading, portfolio, or accounts, and the reported performance of the A, B, C, D, and F portfolios (collectively the “model portfolios”) should be considered mere “paper” or pro forma performance results based on Navellier’s research.
Investors evaluating any of Navellier & Associates, Inc.’s, (or its affiliates’) Investment Products must not use any information presented here, including the performance figures of the model portfolios, in their evaluation of any Navellier Investment Products. Navellier Investment Products include the firm’s mutual funds and managed accounts. The model portfolios, charts, and other information presented do not represent actual funded trades and are not actual funded portfolios. There are material differences between Navellier Investment Products’ portfolios and the model portfolios, research, and performance figures presented here. The model portfolios and the research results (1) may contain stocks or ETFs that are illiquid and difficult to trade; (2) may contain stock or ETF holdings materially different from actual funded Navellier Investment Product portfolios; (3) include the reinvestment of all dividends and other earnings, estimated trading costs, commissions, or management fees; and, (4) may not reflect prices obtained in an actual funded Navellier Investment Product portfolio. For these and other reasons, the reported performances of model portfolios do not reflect the performance results of Navellier’s actually funded and traded Investment Products. In most cases, Navellier’s Investment Products have materially lower performance results than the performances of the model portfolios presented.
This report contains statements that are, or may be considered to be, forward-looking statements. All statements that are not historical facts, including statements about our beliefs or expectations, are “forward-looking statements” within the meaning of The U.S. Private Securities Litigation Reform Act of 1995. These statements may be identified by such forward-looking terminology as “expect,” “estimate,” “plan,” “intend,” “believe,” “anticipate,” “may,” “will,” “should,” “could,” “continue,” “project,” or similar statements or variations of such terms. Our forward-looking statements are based on a series of expectations, assumptions, and projections, are not guarantees of future results or performance, and involve substantial risks and uncertainty as described in Form ADV Part 2A of our filing with the Securities and Exchange Commission (SEC), which is available at www.adviserinfo.sec.gov or by requesting a copy by emailing info@navellier.com. All of our forward-looking statements are as of the date of this report only. We can give no assurance that such expectations or forward-looking statements will prove to be correct. Actual results may differ materially. You are urged to carefully consider all such factors.
FEDERAL TAX ADVICE DISCLAIMER: As required by U.S. Treasury Regulations, you are informed that, to the extent this presentation includes any federal tax advice, the presentation is not written by Navellier to be used, and cannot be used, for the purpose of avoiding federal tax penalties. Navellier does not advise on any income tax requirements or issues. Use of any information presented by Navellier is for general information only and does not represent tax advice either express or implied. You are encouraged to seek professional tax advice for income tax questions and assistance.
IMPORTANT NEWSLETTER DISCLOSURE:The hypothetical performance results for investment newsletters that are authored or edited by Louis Navellier, including Louis Navellier’s Growth Investor, Louis Navellier’s Breakthrough Stocks, Louis Navellier’s Accelerated Profits, and Louis Navellier’s Platinum Club, are not based on any actual securities trading, portfolio, or accounts, and the newsletters’ reported hypothetical performances should be considered mere “paper” or proforma hypothetical performance results and are not actual performance of real world trades. Navellier & Associates, Inc. does not have any relation to or affiliation with the owner of these newsletters. There are material differences between Navellier Investment Products’ portfolios and the InvestorPlace Media, LLC newsletter portfolios authored by Louis Navellier. The InvestorPlace Media, LLC newsletters contain hypothetical performance that do not include transaction costs, advisory fees, or other fees a client might incur if actual investments and trades were being made by an investor. As a result, newsletter performance should not be used to evaluate Navellier Investment services which are separate and different from the newsletters. The owner of the newsletters is InvestorPlace Media, LLC and any questions concerning the newsletters, including any newsletter advertising or hypothetical Newsletter performance claims, (which are calculated solely by Investor Place Media and not Navellier) should be referred to InvestorPlace Media, LLC at (800) 718-8289.
Please note that Navellier & Associates and the Navellier Private Client Group are managed completely independent of the newsletters owned and published by InvestorPlace Media, LLC and written and edited by Louis Navellier, and investment performance of the newsletters should in no way be considered indicative of potential future investment performance for any Navellier & Associates separately managed account portfolio. Potential investors should consult with their financial advisor before investing in any Navellier Investment Product.
Navellier claims compliance with Global Investment Performance Standards (GIPS). To receive a complete list and descriptions of Navellier’s composites and/or a presentation that adheres to the GIPS standards, please contact Navellier or click here. It should not be assumed that any securities recommendations made by Navellier & Associates, Inc. in the future will be profitable or equal the performance of securities made in this report.
FactSet Disclosure: Navellier does not independently calculate the statistical information included in the attached report. The calculation and the information are provided by FactSet, a company not related to Navellier. Although information contained in the report has been obtained from FactSet and is based on sources Navellier believes to be reliable, Navellier does not guarantee its accuracy, and it may be incomplete or condensed. The report and the related FactSet sourced information are provided on an “as is” basis. The user assumes the entire risk of any use made of this information. Investors should consider the report as only a single factor in making their investment decision. The report is for informational purposes only and is not intended as an offer or solicitation for the purchase or sale of a security. FactSet sourced information is the exclusive property of FactSet. Without prior written permission of FactSet, this information may not be reproduced, disseminated or used to create any financial products. All indices are unmanaged and performance of the indices include reinvestment of dividends and interest income, unless otherwise noted, are not illustrative of any particular investment and an investment cannot be made in any index. Past performance is no guarantee of future results.