by Jason Bodner
May 14, 2024
Why do I think the market is about to rally? I see it in the data – the unusual buying by Big Money, so a more appropriate question may be: “What is this ‘Unusual Buying’ and why does that matter to you?
More on that in a minute. First let’s talk about anomalies. In everyday life, anomalies catch our attention and cause us to wonder, sometimes even question our perceptions of reality. Take for instance, Namibian fairy circles that appear in the middle of the desert. Seen from above, they seem like polka dots on earth. Another fascinating anomaly is just outside Buffalo, where there is an eternal flame inside a waterfall.

There are countless other anomalies out there. But when it comes to markets, anomalies can happen well out of plain sight. To me, these market anomalies are more meaningful than anything.
OK, enough bizarre science mysteries. Now, why should you care about “unusual buying”?
Think of it this way: When a big institution trades stocks “abnormally” or “unusually,” we can formulate some expectations about what may happen in the future, since when a large institutional investor comes to buy stock, they don’t do it like you or me. They might take weeks to accumulate that stock.
Why do they do that? Well, it’s more why they must do it that way. Billion-dollar funds must invest large sums of money to take a meaningful position. Sometimes that takes time, in order not to disrupt the market. They don’t want to broadcast to the world what they are doing – so they try to accumulate as much volume as they can as quietly as they can. That means buying stock without disturbing the price too much. Trust me, as a former professional trader, I’ve seen them pay brokerage firms big bucks to do that.
But if they cover their tracks – how do we see those tracks?
That’s where the term “unusual buying” comes in, and that’s why it’s so crucial to identify the stocks that might rise significantly thereafter. In our world, unusual buying looks like these green bars:
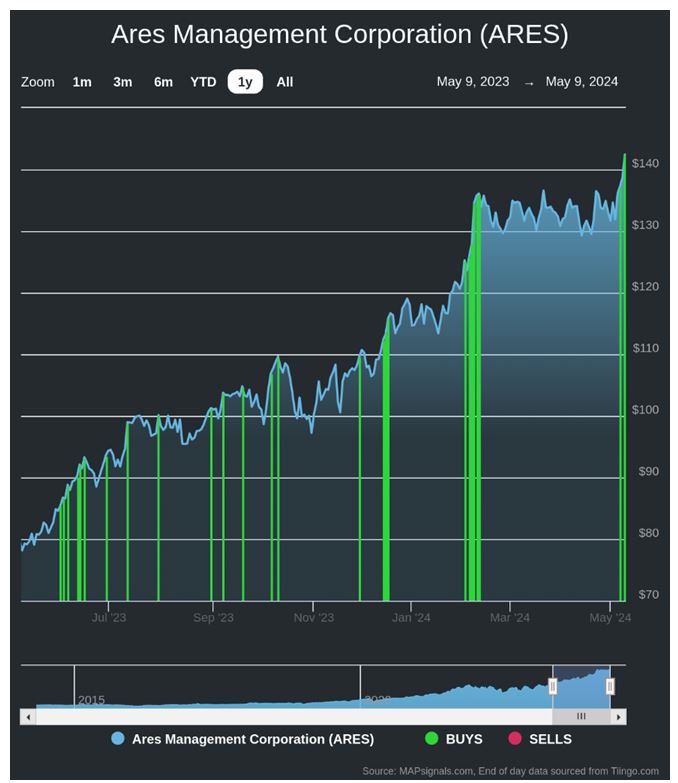
Graphs are for illustrative and discussion purposes only. Please read important disclosures at the end of this commentary.
Except for the green bars, the chart looks normal, but each green bar is like an x-ray showing us some “unusual buying” happening right here! Focus on how the price of the stock lifts as more green bars show up. This is why unusual institutional buying matters so much. Not only does it help indicate when a stock might zoom, but in the aggregate, it can give you hints at the future possible direction of the stock market.
This matters because I noticed unusual buying has returned. The past six days delivered significantly more buying than usual. There were six consecutive days in which buying outnumbered selling by 60% or more. In other words, out of 10 unusual volume signals, six or more were buys for six consecutive days.
In the chart below, we see the SPY ETF with green and red bars. (Green represents the aggregate unusual buying and selling on a particular day).
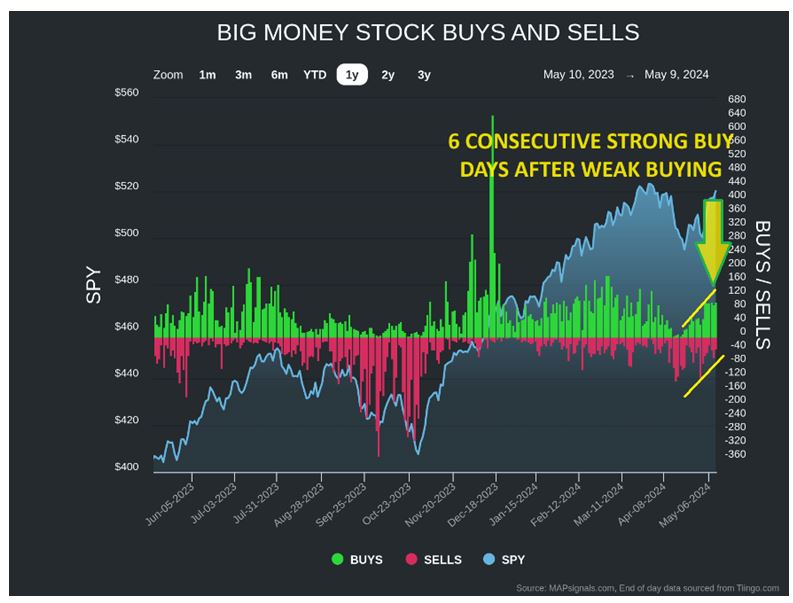
Graphs are for illustrative and discussion purposes only. Please read important disclosures at the end of this commentary.
Out of thousands of stocks, only about 100 or so show unusual buy or sell signals on an average day. To ensure we are looking at meaningful data, the average daily count of all signals for the past six days is a healthy 143.7. This is substantially higher (69% higher) than the 34.5-year average of 85.1 per day.
In other words, this is real buying, not just a low volume bounce after a rough patch in April.
To contextualize what we are witnessing, I went back from 1990 until now, and looked at all the other times when we had six consecutive days of buying. Believe it or not, it’s fairly common, happening about 28% of the time. What we see in the table below is that it foreshadows strong forward market returns:
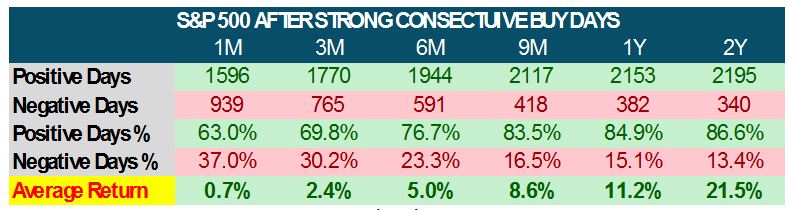
Source: MAPsignals.com, FactSet
Graphs are for illustrative and discussion purposes only. Please read important disclosures at the end of this commentary.
What sets this time apart from those other previous 2,535 instances is that the buying appeared from a vacuum of buying. As you saw in the Big Money Stock Buys and Sells chart above, that green just started appearing from “nowhere,” from a prior period of little buying.
So, what does history tell us about similar times like that? The return profile is similar, but even better:
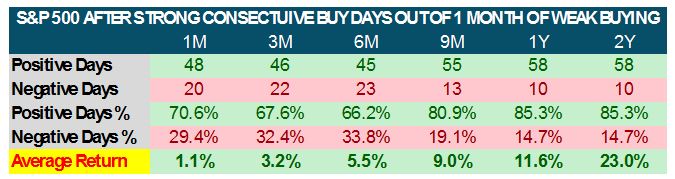
Source: MAPsignals.com, FactSet
Graphs are for illustrative and discussion purposes only. Please read important disclosures at the end of this commentary.
Interestingly, times that dragged down returns were not the Great Financial Crisis of 2008. Instead, it was 2000-2001 and 2022. Either way, six consecutive days of buying is bullish for stocks.
To add to the promise borne out by unusual buying, seasonality comes into play as well. In the chart below, we see the four major indexes in their performance average broken down by month. Notice that May and June are strong months, historically speaking. (Beware of the late summer months, however).
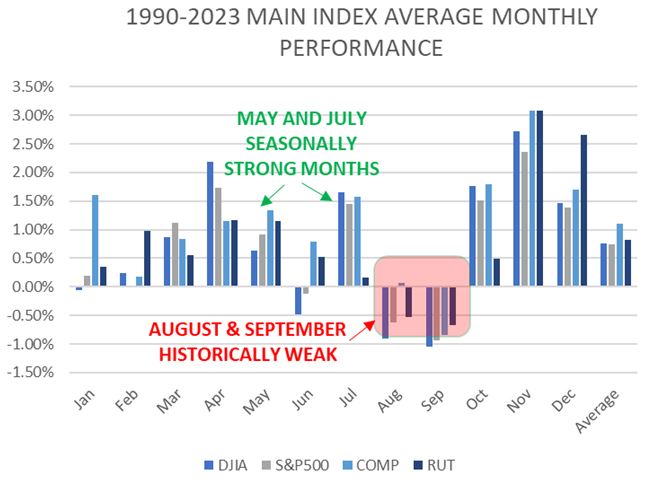
Source: MAPsignals.com, FactSet
Graphs are for illustrative and discussion purposes only. Please read important disclosures at the end of this commentary.
To drill down further, according to our research, we are coming off a seasonally weaker short-term period:
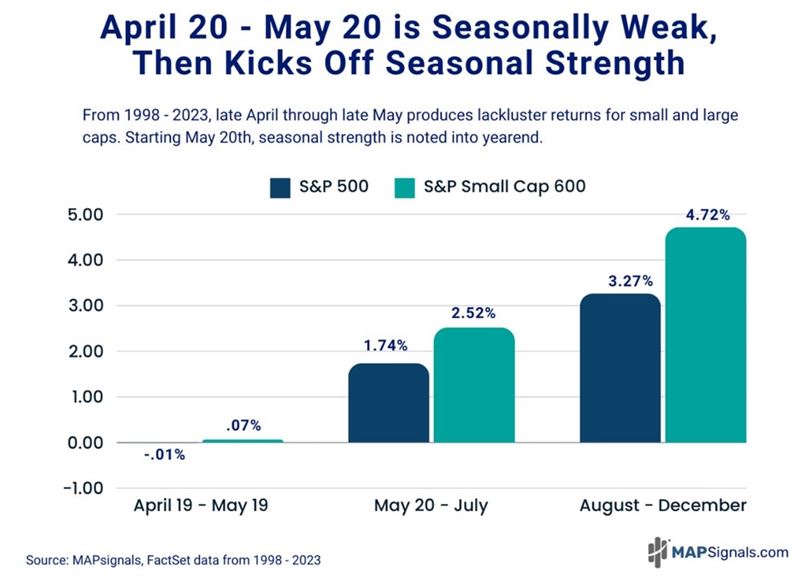
Graphs are for illustrative and discussion purposes only. Please read important disclosures at the end of this commentary.
So, it looks as though stocks could possibly soar again, and soon. Now, we want to know where to find some leaders. Looking at sectors, we see continued strength in Energy, Industrials, and Financials:
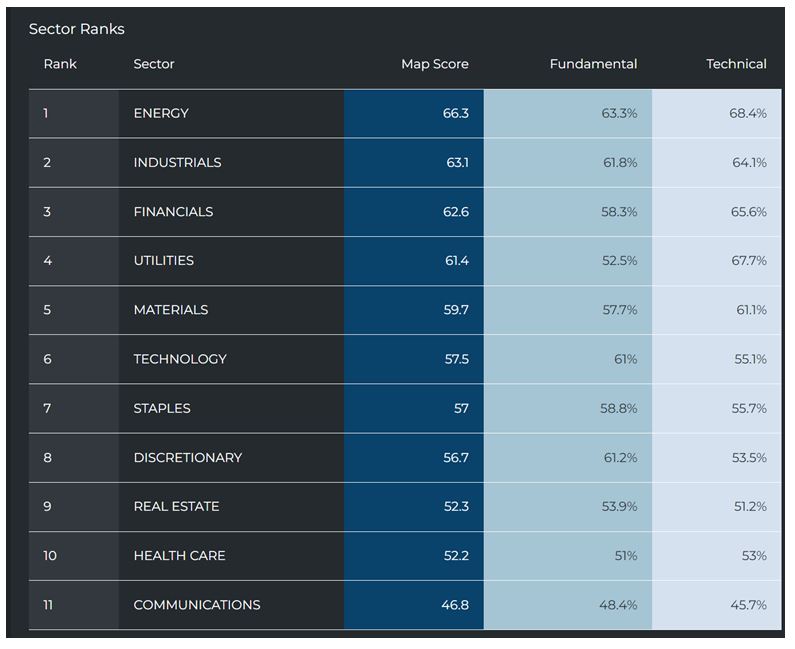
Graphs are for illustrative and discussion purposes only. Please read important disclosures at the end of this commentary.
Utilities have rallied parabolically in recent weeks. We see a ton of unusual accumulation in the Utility Sector:
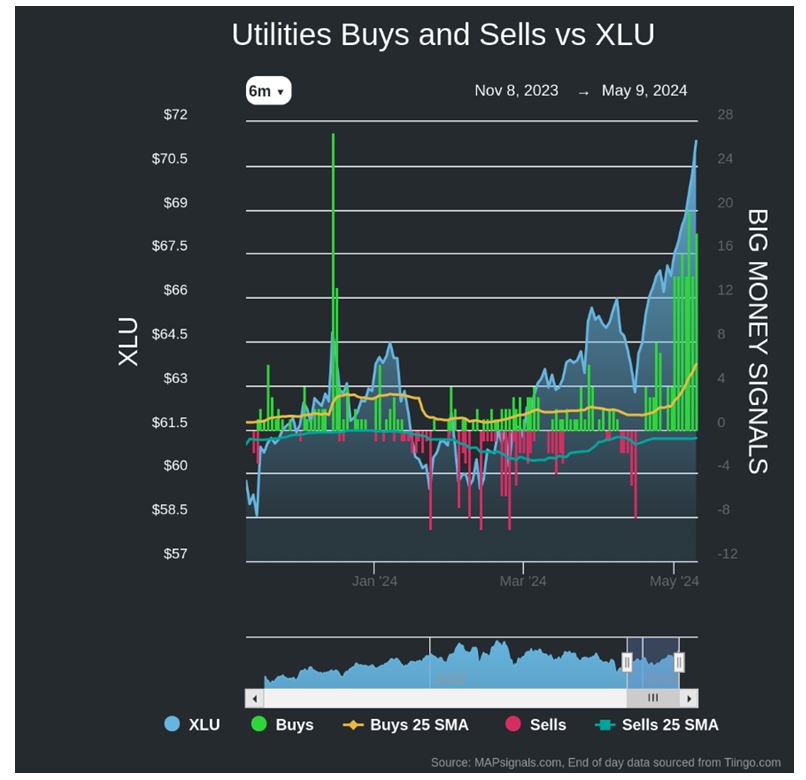
Graphs are for illustrative and discussion purposes only. Please read important disclosures at the end of this commentary.
I’d be careful here, as the recent narrative fueling the buying seems driven by the notion that AI demand will translate to immense demand for energy delivered by these Utility companies. It has the hallmarks of a trend that can quickly reverse. I prefer finding trends based on companies with solid fundamentals and institutional support. Looking back at the past six days, we see evenly distributed buying across sectors:
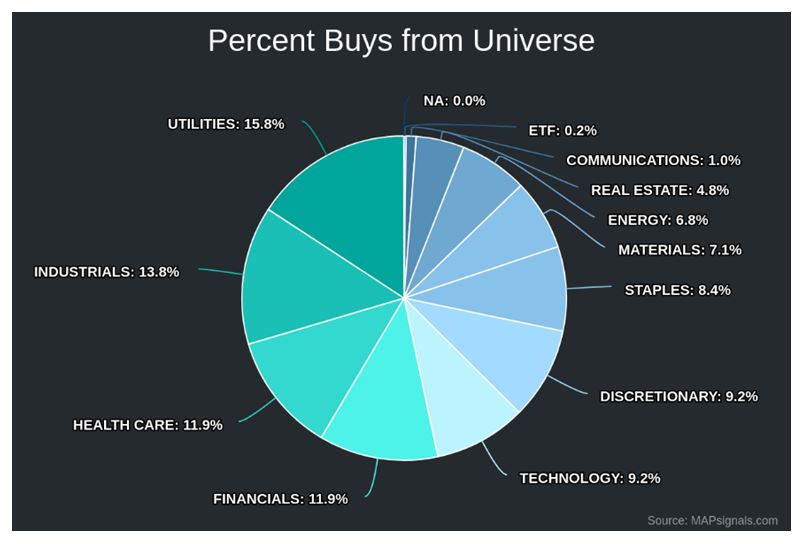
Graphs are for illustrative and discussion purposes only. Please read important disclosures at the end of this commentary.
I’m seeing a lot of new names getting bought, but also a bunch of familiar high-quality names, too.
Anomalies in nature attract attention. Anomalies in the market can be hidden. Being able to see them when no one else does can deliver major insights. Ignoring them can leave our destiny unfulfilled.
As Shakespeare wrote in Julius Caesar, “It is not in the stars to hold our destiny but in ourselves.”
Navellier & Associates does not own ARES Management Corp (ARES) in managed accounts Jason Bodner does not own ARES Management Corp (ARES) personally.
All content above represents the opinion of Jason Bodner of Navellier & Associates, Inc.
Also In This Issue
A Look Ahead by Louis Navellier
The Fed Should Cut Rates Before a Credit Crisis Forces Their Hand
Income Mail by Bryan Perry
Why this High-Tech Consumer Driven Economy is About to Hit “Pause”
Growth Mail by Gary Alexander
It’s Time for Trade-Offs More Than Solutions
Global Mail by Ivan Martchev
The Big Inflation Week Starts Today
Sector Spotlight by Jason Bodner
Why I Think the Market is About to Rally
View Full Archive
Read Past Issues Here

Jason Bodner
MARKETMAIL EDITOR FOR SECTOR SPOTLIGHT
Jason Bodner writes Sector Spotlight in the weekly Marketmail publication and has authored several white papers for the company. He is also Co-Founder of Macro Analytics for Professionals which produces proprietary equity accumulation/distribution research for its clients. Previously, Mr. Bodner served as Director of European Equity Derivatives for Cantor Fitzgerald Europe in London, then moved to the role of Head of Equity Derivatives North America for the same company in New York. He also served as S.V.P. Equity Derivatives for Jefferies, LLC. He received a B.S. in business administration in 1996, with honors, from Skidmore College as a member of the Periclean Honors Society. All content of “Sector Spotlight” represents the opinion of Jason Bodner
Important Disclosures:
Jason Bodner is a co-founder and co-owner of Mapsignals. Mr. Bodner is an independent contractor who is occasionally hired by Navellier & Associates to write an article and or provide opinions for possible use in articles that appear in Navellier & Associates weekly Market Mail. Mr. Bodner is not employed or affiliated with Louis Navellier, Navellier & Associates, Inc., or any other Navellier owned entity. The opinions and statements made here are those of Mr. Bodner and not necessarily those of any other persons or entities. This is not an endorsement, or solicitation or testimonial or investment advice regarding the BMI Index or any statements or recommendations or analysis in the article or the BMI Index or Mapsignals or its products or strategies.
Although information in these reports has been obtained from and is based upon sources that Navellier believes to be reliable, Navellier does not guarantee its accuracy and it may be incomplete or condensed. All opinions and estimates constitute Navellier’s judgment as of the date the report was created and are subject to change without notice. These reports are for informational purposes only and are not a solicitation for the purchase or sale of a security. Any decision to purchase securities mentioned in these reports must take into account existing public information on such securities or any registered prospectus.To the extent permitted by law, neither Navellier & Associates, Inc., nor any of its affiliates, agents, or service providers assumes any liability or responsibility nor owes any duty of care for any consequences of any person acting or refraining to act in reliance on the information contained in this communication or for any decision based on it.
Past performance is no indication of future results. Investment in securities involves significant risk and has the potential for partial or complete loss of funds invested. It should not be assumed that any securities recommendations made by Navellier. in the future will be profitable or equal the performance of securities made in this report. Dividend payments are not guaranteed. The amount of a dividend payment, if any, can vary over time and issuers may reduce dividends paid on securities in the event of a recession or adverse event affecting a specific industry or issuer.
None of the stock information, data, and company information presented herein constitutes a recommendation by Navellier or a solicitation to buy or sell any securities. Any specific securities identified and described do not represent all of the securities purchased, sold, or recommended for advisory clients. The holdings identified do not represent all of the securities purchased, sold, or recommended for advisory clients and the reader should not assume that investments in the securities identified and discussed were or will be profitable.
Information presented is general information that does not take into account your individual circumstances, financial situation, or needs, nor does it present a personalized recommendation to you. Individual stocks presented may not be suitable for every investor. Investment in securities involves significant risk and has the potential for partial or complete loss of funds invested. Investment in fixed income securities has the potential for the investment return and principal value of an investment to fluctuate so that an investor’s holdings, when redeemed, may be worth less than their original cost.
One cannot invest directly in an index. Index is unmanaged and index performance does not reflect deduction of fees, expenses, or taxes. Presentation of Index data does not reflect a belief by Navellier that any stock index constitutes an investment alternative to any Navellier equity strategy or is necessarily comparable to such strategies. Among the most important differences between the Indices and Navellier strategies are that the Navellier equity strategies may (1) incur material management fees, (2) concentrate its investments in relatively few stocks, industries, or sectors, (3) have significantly greater trading activity and related costs, and (4) be significantly more or less volatile than the Indices.
ETF Risk: We may invest in exchange traded funds (“ETFs”) and some of our investment strategies are generally fully invested in ETFs. Like traditional mutual funds, ETFs charge asset-based fees, but they generally do not charge initial sales charges or redemption fees and investors typically pay only customary brokerage fees to buy and sell ETF shares. The fees and costs charged by ETFs held in client accounts will not be deducted from the compensation the client pays Navellier. ETF prices can fluctuate up or down, and a client account could lose money investing in an ETF if the prices of the securities owned by the ETF go down. ETFs are subject to additional risks:
- ETF shares may trade above or below their net asset value;
- An active trading market for an ETF’s shares may not develop or be maintained;
- The value of an ETF may be more volatile than the underlying portfolio of securities the ETF is designed to track;
- The cost of owning shares of the ETF may exceed those a client would incur by directly investing in the underlying securities; and
- Trading of an ETF’s shares may be halted if the listing exchange’s officials deem it appropriate, the shares are delisted from the exchange, or the activation of market-wide “circuit breakers” (which are tied to large decreases in stock prices) halts stock trading generally.
Grader Disclosures: Investment in equity strategies involves substantial risk and has the potential for partial or complete loss of funds invested. The sample portfolio and any accompanying charts are for informational purposes only and are not to be construed as a solicitation to buy or sell any financial instrument and should not be relied upon as the sole factor in an investment making decision. As a matter of normal and important disclosures to you, as a potential investor, please consider the following: The performance presented is not based on any actual securities trading, portfolio, or accounts, and the reported performance of the A, B, C, D, and F portfolios (collectively the “model portfolios”) should be considered mere “paper” or pro forma performance results based on Navellier’s research.
Investors evaluating any of Navellier & Associates, Inc.’s, (or its affiliates’) Investment Products must not use any information presented here, including the performance figures of the model portfolios, in their evaluation of any Navellier Investment Products. Navellier Investment Products include the firm’s mutual funds and managed accounts. The model portfolios, charts, and other information presented do not represent actual funded trades and are not actual funded portfolios. There are material differences between Navellier Investment Products’ portfolios and the model portfolios, research, and performance figures presented here. The model portfolios and the research results (1) may contain stocks or ETFs that are illiquid and difficult to trade; (2) may contain stock or ETF holdings materially different from actual funded Navellier Investment Product portfolios; (3) include the reinvestment of all dividends and other earnings, estimated trading costs, commissions, or management fees; and, (4) may not reflect prices obtained in an actual funded Navellier Investment Product portfolio. For these and other reasons, the reported performances of model portfolios do not reflect the performance results of Navellier’s actually funded and traded Investment Products. In most cases, Navellier’s Investment Products have materially lower performance results than the performances of the model portfolios presented.
This report contains statements that are, or may be considered to be, forward-looking statements. All statements that are not historical facts, including statements about our beliefs or expectations, are “forward-looking statements” within the meaning of The U.S. Private Securities Litigation Reform Act of 1995. These statements may be identified by such forward-looking terminology as “expect,” “estimate,” “plan,” “intend,” “believe,” “anticipate,” “may,” “will,” “should,” “could,” “continue,” “project,” or similar statements or variations of such terms. Our forward-looking statements are based on a series of expectations, assumptions, and projections, are not guarantees of future results or performance, and involve substantial risks and uncertainty as described in Form ADV Part 2A of our filing with the Securities and Exchange Commission (SEC), which is available at www.adviserinfo.sec.gov or by requesting a copy by emailing info@navellier.com. All of our forward-looking statements are as of the date of this report only. We can give no assurance that such expectations or forward-looking statements will prove to be correct. Actual results may differ materially. You are urged to carefully consider all such factors.
FEDERAL TAX ADVICE DISCLAIMER: As required by U.S. Treasury Regulations, you are informed that, to the extent this presentation includes any federal tax advice, the presentation is not written by Navellier to be used, and cannot be used, for the purpose of avoiding federal tax penalties. Navellier does not advise on any income tax requirements or issues. Use of any information presented by Navellier is for general information only and does not represent tax advice either express or implied. You are encouraged to seek professional tax advice for income tax questions and assistance.
IMPORTANT NEWSLETTER DISCLOSURE:The hypothetical performance results for investment newsletters that are authored or edited by Louis Navellier, including Louis Navellier’s Growth Investor, Louis Navellier’s Breakthrough Stocks, Louis Navellier’s Accelerated Profits, and Louis Navellier’s Platinum Club, are not based on any actual securities trading, portfolio, or accounts, and the newsletters’ reported hypothetical performances should be considered mere “paper” or proforma hypothetical performance results and are not actual performance of real world trades. Navellier & Associates, Inc. does not have any relation to or affiliation with the owner of these newsletters. There are material differences between Navellier Investment Products’ portfolios and the InvestorPlace Media, LLC newsletter portfolios authored by Louis Navellier. The InvestorPlace Media, LLC newsletters contain hypothetical performance that do not include transaction costs, advisory fees, or other fees a client might incur if actual investments and trades were being made by an investor. As a result, newsletter performance should not be used to evaluate Navellier Investment services which are separate and different from the newsletters. The owner of the newsletters is InvestorPlace Media, LLC and any questions concerning the newsletters, including any newsletter advertising or hypothetical Newsletter performance claims, (which are calculated solely by Investor Place Media and not Navellier) should be referred to InvestorPlace Media, LLC at (800) 718-8289.
Please note that Navellier & Associates and the Navellier Private Client Group are managed completely independent of the newsletters owned and published by InvestorPlace Media, LLC and written and edited by Louis Navellier, and investment performance of the newsletters should in no way be considered indicative of potential future investment performance for any Navellier & Associates separately managed account portfolio. Potential investors should consult with their financial advisor before investing in any Navellier Investment Product.
Navellier claims compliance with Global Investment Performance Standards (GIPS). To receive a complete list and descriptions of Navellier’s composites and/or a presentation that adheres to the GIPS standards, please contact Navellier or click here. It should not be assumed that any securities recommendations made by Navellier & Associates, Inc. in the future will be profitable or equal the performance of securities made in this report.
FactSet Disclosure: Navellier does not independently calculate the statistical information included in the attached report. The calculation and the information are provided by FactSet, a company not related to Navellier. Although information contained in the report has been obtained from FactSet and is based on sources Navellier believes to be reliable, Navellier does not guarantee its accuracy, and it may be incomplete or condensed. The report and the related FactSet sourced information are provided on an “as is” basis. The user assumes the entire risk of any use made of this information. Investors should consider the report as only a single factor in making their investment decision. The report is for informational purposes only and is not intended as an offer or solicitation for the purchase or sale of a security. FactSet sourced information is the exclusive property of FactSet. Without prior written permission of FactSet, this information may not be reproduced, disseminated or used to create any financial products. All indices are unmanaged and performance of the indices include reinvestment of dividends and interest income, unless otherwise noted, are not illustrative of any particular investment and an investment cannot be made in any index. Past performance is no guarantee of future results.