by Bryan Perry
April 29, 2025
The market enjoyed a much-needed snap-back last week. In order to build on this nascent rebound, more progress on tariffs, inflation and earnings need to cross the tape – like oxygen to a mountain climber.
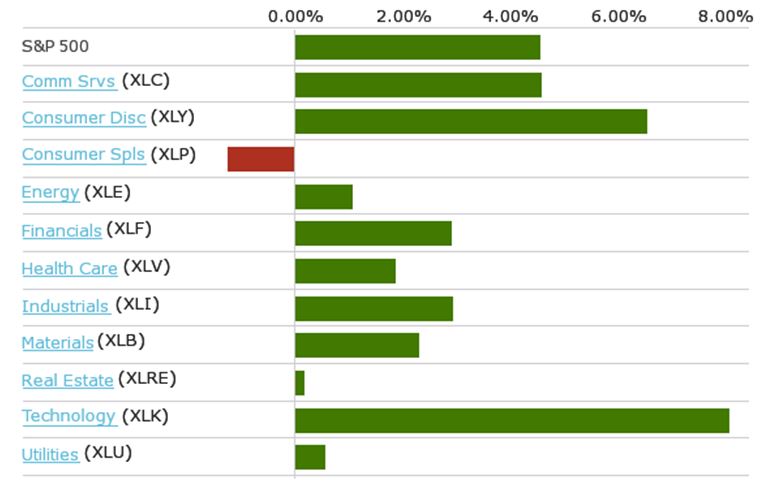
Technology stocks were the real bright spot (up 8.1% last week), as confidence returned to the AI trade after waning for several weeks under the weight of extreme tariffs levied by both the U.S. and China.
Graphs are for illustrative and discussion purposes only. Please read important disclosures at the end of this commentary.
According to FactSet, as of April 25, 36% of the companies in the S&P 500 have reported actual results for the first quarter so far. Of these companies, 73% have reported actual EPS above estimates, which is slightly below the 5-year average of 77% and the 10-year average of 75%, but in aggregate, companies are reporting earnings that are 10% above those estimates, and that beats the 5-year average of 8.8% and is well above the 10-year average of 6.9%. (Note: These historical averages reflect actual results from all 500 companies, not the actual results from the percentage of companies that have reported so far).
This week will provide us with some key insights to the labor market, with the release of JOLTS (Job Openings and Labor Turnover Survey) data for March, ADP Employment Data for April, Weekly Jobless Claims for the week ending April 26, Continuing Claims, Non-Farm Payrolls and Unemployment Rate for April. The latest consensus estimate is that the economy added 125,000 jobs in April, considerably fewer than the prior consensus estimate of 228,000. The jobs data is key, at this point, because recent consumer sentiment surveys show widespread fear that a wave of layoffs is coming due to government funding cutbacks, plus AI and automation replacing some workers, and fear of an economic downturn.
There are some early signs that the labor market is going to endure some tighter conditions. According to a Newsweek article published on April 1, 2025, “Employees at more than 110 companies can expect layoffs in April, according to recent WARN notices. The Worker Adjustment and Retraining Notification [WARN] Act requires companies to provide notice before implementing mass layoffs, and many employers have sent out alerts that they plan to let employees go this month.”
Some other signs of a slowing economy are showing up in the hard data. Existing home sales in the U.S. experienced a significant decline in March 2025, dropping by 5.9% to a seasonally adjusted annual rate of 4.02 million units, the lowest level since the 2008 financial crisis, reflecting high mortgage rates and affordability issues. Inventory levels have increased, but most barriers are due to higher borrowing costs.
Additionally, the Conference Board’s Leading Economic Index (LEI) for the U.S. has been turning down lately. In March 2025, the LEI declined by 0.7%, its third consecutive monthly drop. This decline reflects weakening consumer expectations, falling stock prices, and softer new manufacturing orders. In the past six months, the LEI has contracted by 1.2%, indicating slowing economic activity ahead. These indicators often provide early warnings of economic downturns, but they do not yet suggest an imminent recession.
The 10-components of The Conference Board Leading Economic Index are: (1) Average weekly hours in manufacturing; (2) Average weekly initial claims for unemployment insurance; (3) Manufacturers’ new orders for consumer goods and materials; (4) ISM Index of New Orders; (5) Manufacturers’ new orders for non-defense capital goods, excluding aircraft orders; (6) Building permits for new private housing units; (7) S&P 500® Index of Stock Prices; (8) Leading Credit Index; (9) Interest rate-spread (10-year Treasury bonds less federal funds rate); and (10) Average consumer expectations for business conditions.
This is a forward-looking predictive index that anticipates turning points in the business cycle by around seven months. Ideally, the Federal Reserve would get in front of these warning signs and early trends and stop worrying about how the tariffs are going to trigger widespread inflation on 11% of total U.S. GDP.
In contrast to our Fed, the European Central Bank (ECB) has wasted no time getting in front of the current global economic slowdown. The ECB has cut interest rates seven times in the last year.
These rate cuts are part of the ECB’s strategy to support the euro-zone economy amid challenges like trade-related uncertainties and subdued growth. The most recent euro cut lowered the deposit facility rate to 2.25%. Now that inflation has fallen, growth worries have taken center stage. The economy in the 20 euro-zone countries grew by a modest 0.2% in the final quarter of 2024, and inflation was 2.2% in March.
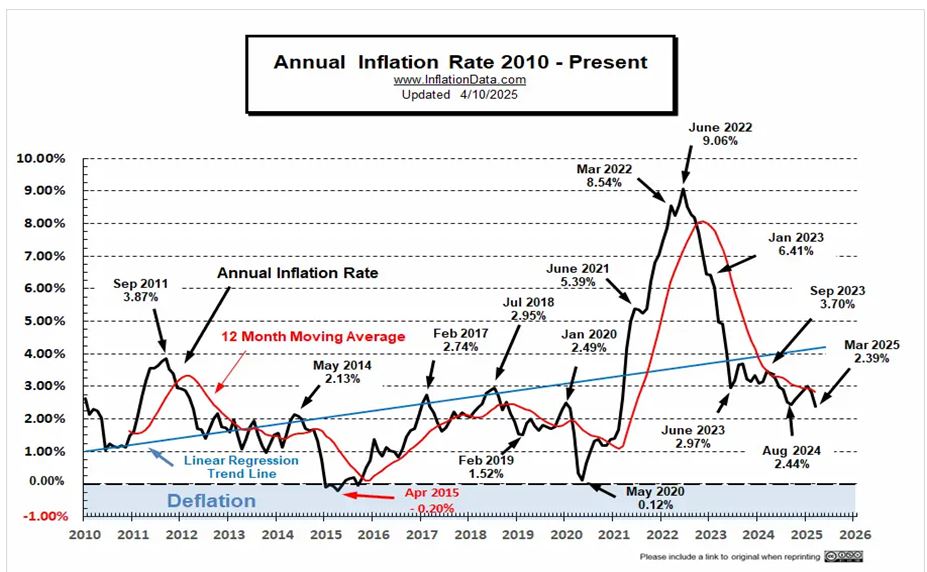
The current rate of inflation in the U.S. is 2.4%, amid a clearly cautious atmosphere of consumer sentiment in a consumer driven economy. The Atlanta Fed GDPNow model’s estimate for real GDP growth (seasonally adjusted annual rate) in the first quarter of 2025 was -2.5 percent as of April 24, down from -2.2 percent on April 17, yet the CME FedWatch Tool shows an 89.6% probability the Fed holding the Fed Fund Rate at 4.25%-4.50% next week. There seems to be a disconnect between where a rate cut seems to be a no-brainer to cushion consumer and business confidence at the May 7th FOMC meeting.
Graphs are for illustrative and discussion purposes only. Please read important disclosures at the end of this commentary.
Looking at the current situation, it would serve consumer confidence and markets well to know that the Fed is taking preventative action next week instead of their usual reactionary measures when it comes to monetary policy. A quarter-point cut is not going to move the needle much in terms of borrowing costs for both businesses and individuals. What it will provide, however, is clarity, confidence, and leadership.
All content above represents the opinion of Bryan Perry of Navellier & Associates, Inc.
Also In This Issue
A Look Ahead by Louis Navellier
Tariffs Are Melting Away, But China Remains Stubborn
Income Mail by Bryan Perry
The Fed Should Act Next Week, With a Preemptive Rate Cut
Growth Mail by Gary Alexander
Downbeat Sentiment (and Magazine Covers) are Contrarian Buy Signals
Global Mail by Ivan Martchev
The Stock Market is Sniffing Out More Trade Deals
Sector Spotlight by Jason Bodner
Survival Techniques in a Confusing Market Year
View Full Archive
Read Past Issues Here

Bryan Perry
SENIOR DIRECTOR
Bryan Perry is a Senior Director with Navellier Private Client Group, advising and facilitating high net worth investors in the pursuit of their financial goals.
Bryan’s financial services career spanning the past three decades includes over 20-years of wealth management experience with Wall Street firms that include Bear Stearns, Lehman Brothers and Paine Webber, working with both retail and institutional clients. Bryan earned a B.A. in Political Science from Virginia Polytechnic Institute & State University and currently holds a Series 65 license. All content of “Income Mail” represents the opinion of Bryan Perry
Important Disclosures:
Although information in these reports has been obtained from and is based upon sources that Navellier believes to be reliable, Navellier does not guarantee its accuracy and it may be incomplete or condensed. All opinions and estimates constitute Navellier’s judgment as of the date the report was created and are subject to change without notice. These reports are for informational purposes only and are not a solicitation for the purchase or sale of a security. Any decision to purchase securities mentioned in these reports must take into account existing public information on such securities or any registered prospectus.To the extent permitted by law, neither Navellier & Associates, Inc., nor any of its affiliates, agents, or service providers assumes any liability or responsibility nor owes any duty of care for any consequences of any person acting or refraining to act in reliance on the information contained in this communication or for any decision based on it.
Past performance is no indication of future results. Investment in securities involves significant risk and has the potential for partial or complete loss of funds invested. It should not be assumed that any securities recommendations made by Navellier. in the future will be profitable or equal the performance of securities made in this report. Dividend payments are not guaranteed. The amount of a dividend payment, if any, can vary over time and issuers may reduce dividends paid on securities in the event of a recession or adverse event affecting a specific industry or issuer.
None of the stock information, data, and company information presented herein constitutes a recommendation by Navellier or a solicitation to buy or sell any securities. Any specific securities identified and described do not represent all of the securities purchased, sold, or recommended for advisory clients. The holdings identified do not represent all of the securities purchased, sold, or recommended for advisory clients and the reader should not assume that investments in the securities identified and discussed were or will be profitable.
Information presented is general information that does not take into account your individual circumstances, financial situation, or needs, nor does it present a personalized recommendation to you. Individual stocks presented may not be suitable for every investor. Investment in securities involves significant risk and has the potential for partial or complete loss of funds invested. Investment in fixed income securities has the potential for the investment return and principal value of an investment to fluctuate so that an investor’s holdings, when redeemed, may be worth less than their original cost.
One cannot invest directly in an index. Index is unmanaged and index performance does not reflect deduction of fees, expenses, or taxes. Presentation of Index data does not reflect a belief by Navellier that any stock index constitutes an investment alternative to any Navellier equity strategy or is necessarily comparable to such strategies. Among the most important differences between the Indices and Navellier strategies are that the Navellier equity strategies may (1) incur material management fees, (2) concentrate its investments in relatively few stocks, industries, or sectors, (3) have significantly greater trading activity and related costs, and (4) be significantly more or less volatile than the Indices.
ETF Risk: We may invest in exchange traded funds (“ETFs”) and some of our investment strategies are generally fully invested in ETFs. Like traditional mutual funds, ETFs charge asset-based fees, but they generally do not charge initial sales charges or redemption fees and investors typically pay only customary brokerage fees to buy and sell ETF shares. The fees and costs charged by ETFs held in client accounts will not be deducted from the compensation the client pays Navellier. ETF prices can fluctuate up or down, and a client account could lose money investing in an ETF if the prices of the securities owned by the ETF go down. ETFs are subject to additional risks:
- ETF shares may trade above or below their net asset value;
- An active trading market for an ETF’s shares may not develop or be maintained;
- The value of an ETF may be more volatile than the underlying portfolio of securities the ETF is designed to track;
- The cost of owning shares of the ETF may exceed those a client would incur by directly investing in the underlying securities; and
- Trading of an ETF’s shares may be halted if the listing exchange’s officials deem it appropriate, the shares are delisted from the exchange, or the activation of market-wide “circuit breakers” (which are tied to large decreases in stock prices) halts stock trading generally.
Grader Disclosures: Investment in equity strategies involves substantial risk and has the potential for partial or complete loss of funds invested. The sample portfolio and any accompanying charts are for informational purposes only and are not to be construed as a solicitation to buy or sell any financial instrument and should not be relied upon as the sole factor in an investment making decision. As a matter of normal and important disclosures to you, as a potential investor, please consider the following: The performance presented is not based on any actual securities trading, portfolio, or accounts, and the reported performance of the A, B, C, D, and F portfolios (collectively the “model portfolios”) should be considered mere “paper” or pro forma performance results based on Navellier’s research.
Investors evaluating any of Navellier & Associates, Inc.’s, (or its affiliates’) Investment Products must not use any information presented here, including the performance figures of the model portfolios, in their evaluation of any Navellier Investment Products. Navellier Investment Products include the firm’s mutual funds and managed accounts. The model portfolios, charts, and other information presented do not represent actual funded trades and are not actual funded portfolios. There are material differences between Navellier Investment Products’ portfolios and the model portfolios, research, and performance figures presented here. The model portfolios and the research results (1) may contain stocks or ETFs that are illiquid and difficult to trade; (2) may contain stock or ETF holdings materially different from actual funded Navellier Investment Product portfolios; (3) include the reinvestment of all dividends and other earnings, estimated trading costs, commissions, or management fees; and, (4) may not reflect prices obtained in an actual funded Navellier Investment Product portfolio. For these and other reasons, the reported performances of model portfolios do not reflect the performance results of Navellier’s actually funded and traded Investment Products. In most cases, Navellier’s Investment Products have materially lower performance results than the performances of the model portfolios presented.
This report contains statements that are, or may be considered to be, forward-looking statements. All statements that are not historical facts, including statements about our beliefs or expectations, are “forward-looking statements” within the meaning of The U.S. Private Securities Litigation Reform Act of 1995. These statements may be identified by such forward-looking terminology as “expect,” “estimate,” “plan,” “intend,” “believe,” “anticipate,” “may,” “will,” “should,” “could,” “continue,” “project,” or similar statements or variations of such terms. Our forward-looking statements are based on a series of expectations, assumptions, and projections, are not guarantees of future results or performance, and involve substantial risks and uncertainty as described in Form ADV Part 2A of our filing with the Securities and Exchange Commission (SEC), which is available at www.adviserinfo.sec.gov or by requesting a copy by emailing info@navellier.com. All of our forward-looking statements are as of the date of this report only. We can give no assurance that such expectations or forward-looking statements will prove to be correct. Actual results may differ materially. You are urged to carefully consider all such factors.
FEDERAL TAX ADVICE DISCLAIMER: As required by U.S. Treasury Regulations, you are informed that, to the extent this presentation includes any federal tax advice, the presentation is not written by Navellier to be used, and cannot be used, for the purpose of avoiding federal tax penalties. Navellier does not advise on any income tax requirements or issues. Use of any information presented by Navellier is for general information only and does not represent tax advice either express or implied. You are encouraged to seek professional tax advice for income tax questions and assistance.
IMPORTANT NEWSLETTER DISCLOSURE:The hypothetical performance results for investment newsletters that are authored or edited by Louis Navellier, including Louis Navellier’s Growth Investor, Louis Navellier’s Breakthrough Stocks, Louis Navellier’s Accelerated Profits, and Louis Navellier’s Platinum Club, are not based on any actual securities trading, portfolio, or accounts, and the newsletters’ reported hypothetical performances should be considered mere “paper” or proforma hypothetical performance results and are not actual performance of real world trades. Navellier & Associates, Inc. does not have any relation to or affiliation with the owner of these newsletters. There are material differences between Navellier Investment Products’ portfolios and the InvestorPlace Media, LLC newsletter portfolios authored by Louis Navellier. The InvestorPlace Media, LLC newsletters contain hypothetical performance that do not include transaction costs, advisory fees, or other fees a client might incur if actual investments and trades were being made by an investor. As a result, newsletter performance should not be used to evaluate Navellier Investment services which are separate and different from the newsletters. The owner of the newsletters is InvestorPlace Media, LLC and any questions concerning the newsletters, including any newsletter advertising or hypothetical Newsletter performance claims, (which are calculated solely by Investor Place Media and not Navellier) should be referred to InvestorPlace Media, LLC at (800) 718-8289.
Please note that Navellier & Associates and the Navellier Private Client Group are managed completely independent of the newsletters owned and published by InvestorPlace Media, LLC and written and edited by Louis Navellier, and investment performance of the newsletters should in no way be considered indicative of potential future investment performance for any Navellier & Associates separately managed account portfolio. Potential investors should consult with their financial advisor before investing in any Navellier Investment Product.
Navellier claims compliance with Global Investment Performance Standards (GIPS). To receive a complete list and descriptions of Navellier’s composites and/or a presentation that adheres to the GIPS standards, please contact Navellier or click here. It should not be assumed that any securities recommendations made by Navellier & Associates, Inc. in the future will be profitable or equal the performance of securities made in this report.
FactSet Disclosure: Navellier does not independently calculate the statistical information included in the attached report. The calculation and the information are provided by FactSet, a company not related to Navellier. Although information contained in the report has been obtained from FactSet and is based on sources Navellier believes to be reliable, Navellier does not guarantee its accuracy, and it may be incomplete or condensed. The report and the related FactSet sourced information are provided on an “as is” basis. The user assumes the entire risk of any use made of this information. Investors should consider the report as only a single factor in making their investment decision. The report is for informational purposes only and is not intended as an offer or solicitation for the purchase or sale of a security. FactSet sourced information is the exclusive property of FactSet. Without prior written permission of FactSet, this information may not be reproduced, disseminated or used to create any financial products. All indices are unmanaged and performance of the indices include reinvestment of dividends and interest income, unless otherwise noted, are not illustrative of any particular investment and an investment cannot be made in any index. Past performance is no guarantee of future results.