by Gary Alexander
April 29, 2025
“Be fearful when others are greedy and be greedy when others are fearful.”
– Warren Buffett
Investor sentiment is way down since late February – and that’s great news (to us contrarians).
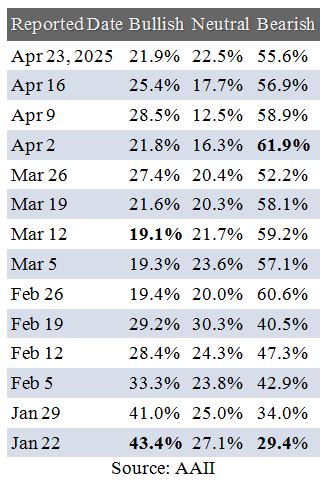
Today is Donald Trump’s 100th day in office. It certainly has been a wild ride, but is it profitable? No, not yet. Will it reward us later on? That’s a smarter question. First, let’s review those 100 days of swings in sentiment. In the week when Donald Trump took the oath of office, the percentage of negative bears in the weekly American Association of Individual Investors (AAII) was only 29.4% (table, below), but:
- Five weeks later, the percentage of bears was up to 60.6%, with only 19.4% bulls, a 3+-to-1 ratio.
- 10-weeks after Trump’s Inauguration, the percentage of bears reached a two-year high of 61.9%.
- This is unusual. The historical AAII average is 37.5% bullish, 31.0% bears and 31.5% neutral.
Graphs are for illustrative and discussion purposes only. Please read important disclosures at the end of this commentary.
Bear in mind that these surveys are taken over a week’s time frame, so the most recent April 23 poll is taken from midnight at the start of Thursday, April 17 to midnight at the end of April 23, so it reflected investors’ moods during a generally rising market, but these investors are still suspicious of this recovery.
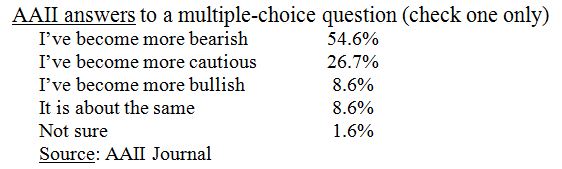
In the latest AAII poll, investors were asked: “How has your sentiment toward the stock market changed since the start of the year?” The majority were bearish, and over 80% were at least “more cautious”:
The S&P has obviously been extremely volatile in Trump’s first 100-days, as reflected in these wide poll swings. The S&P first meandered up 6% from January 10 to an all-time high on February 19, then it fell 21.3% to its post-Liberation Day “tariff tantrum” low on April 7th, followed by a +14.3% recovery as of Friday, April 25. In this poll, the widest bear/bull spread (3.12 to 1) came in the first week of its decline, February 20-26. Bear in mind that these are sophisticated private investors – those who follow the markets daily, so their answers reflect the mood of that segment of the private market likely to trade stocks – not those who focus on other interests – a real life – and tend to let their portfolios rise or fall.
Is the AAII survey a contrary indicator? In market extremes, the historic answer seems to be yes. In the worst market disaster of this century, the Great Financial Crisis of 2008, the number of bearish investors in the survey spiked above 60% in the final months of that crash, when stocks plunged about 30% from mid-October 2008 to mid-March 2009 – but then stocks soared by over 60% in the next 12-months.
Extreme Magazine Covers Are Also a Great Contrarian Indicator
Extreme magazine covers are a more popular and obvious indicator of contrarian mass delusions.
Ever since Business Week’s cover, “The Death of Equities,” in 1979 – published right before a decade of massive stock gains in the 1980s – extreme magazine covers have been noted for reflecting the mood of the mob at its extreme levels of maximum pessimism at market bottoms, or euphoria near market peaks.
The 2008 Financial Crisis was born out of a long-developing real estate bubble, which built from the late 1990s to a peak in 2005, fueled by kinky derivatives of various “tranches” of real estate debt, much of it rated “AAA” when those debts were in fact based on very shaky credit risks encouraged by politicians wanting every American to participate in the Great American Dream of owning their own home, whether they could afford it or not. Many buyers signed on for adjustable-rate mortgages (ARMs). As rates rose in the 2001-05 Fed rate-raising cycle, many found themselves facing crippling monthly payments, so they began walking away from their homes, leaving banks holding their keys and their bloated mortgages.
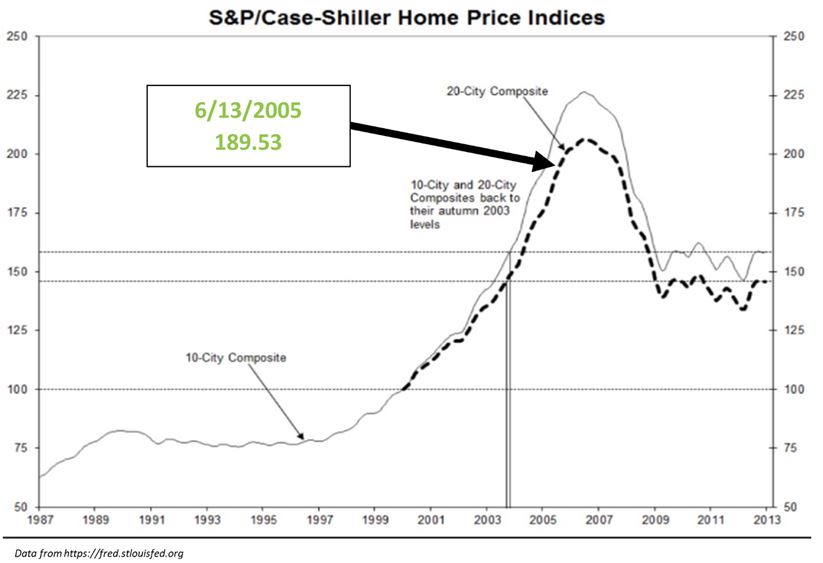
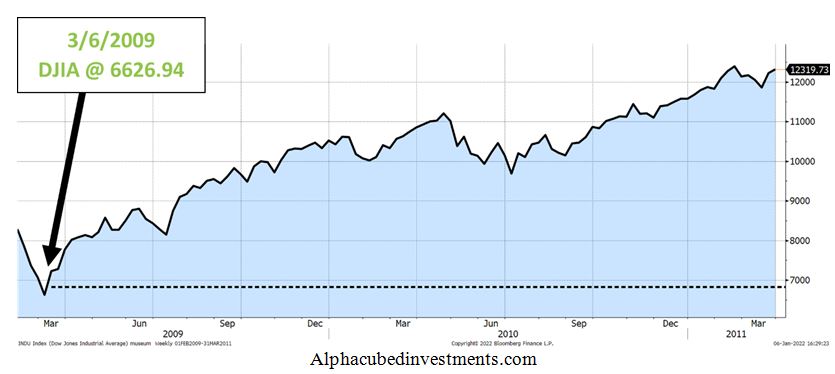
Here are two TIME covers which straddled that crisis – the first from 2005, near the peak of the real estate bubble, and the second heralding the collapse of the stock market the day it bottomed out in 2009:

Personally, we sold our Virginia home “too soon” in 2004, but better too soon than too late. Our friends who sold later couldn’t find buyers in 2006 and beyond. As the chart (below) shows, the 2005 situation in real estate markets – as reflected in the Case-Shiller index – was that home prices were already over-inflated and near their peak, so these 2005 TIME covers reflect mob bias, not truth. They mirrored group ignorance, not factual content. Their true intent was to sell more issues to satisfy or attract advertisers, so their goal was to reflect the fears of the masses most accurately, not to report the news more accurately.
Here is a time map of the true situation in real estate and stocks on the date those covers were published:
Graphs are for illustrative and discussion purposes only. Please read important disclosures at the end of this commentary.
The Wall Street Journal was also fooled. On March 9, 2009, the day the stock market turned around, the Wall Street Journal asked, “Just how low can stocks go?” The Dow Jones Industrials had just fallen below 7,000 for the first time in 12-years, and the S&P 500 was below 700 for the first time since 1996. Goldman Sachs warned that the S&P could fall as low as 400, so the Journal asked, “Dow 5000? There’s a Case for That.” But the chart above showed the Dow gained 66% to reach 11,000 by April 2010.
The Strange Case of Five Straight Negative Covers in The Economist (April 2025)
Now we turn to the current market and the 2025 outlook. Reflecting the negative AAII polls, we see four or five negative covers on Donald Trump’s handling of the economy (five, if you count Elon Musk).
Here are all four April 2025 Economist covers and their key editorial summaries from their inside pages:


This negative string of covers could go back further, to March 29, if you include another wounded eagle – this time under the Musk name – and then to an early March cover picturing Trump as a dollar arsonist.

Why is this important?
According to Wikipedia, Gregory Marks and Brent Donnelly of Citigroup examined covers of the British magazine The Economist and “selected 44-cover images from between 1998 and 2016 that seemed to make an optimistic or pessimistic point.” Their survey found that 30 of the 44-covers (68%) turned out to be contrarian – pointing in the opposite direction – after one year. If this study has any merit, then it looks like the market in the rest of 2025 and early 2026 could stage a recovery, since the last five Economist covers have been almost comically anti-Trump, fully laden with doomsday rhetoric about the dollar, stocks, bonds, the economy, government spending cuts under DOGE and U.S. leadership – all failing.
Sometimes bad news is good news, especially when the bad news seems so extreme and all-pervasive.
We should also bear in mind that The Economist has been edited by an anti-Trump zealot for 10-years, since February 2015, right before Trump first declared his candidacy, and her covers and editorials have been consistently against Trump’s policies for a decade, as in this comic art cover from September 2015:

But the Dow had different ideas after Trump’s first victory – and we may turn out OK in Trump 2.0, too:

Graphs are for illustrative and discussion purposes only. Please read important disclosures at the end of this commentary.
All content above represents the opinion of Gary Alexander of Navellier & Associates, Inc.
Also In This Issue
A Look Ahead by Louis Navellier
Tariffs Are Melting Away, But China Remains Stubborn
Income Mail by Bryan Perry
The Fed Should Act Next Week, With a Preemptive Rate Cut
Growth Mail by Gary Alexander
Downbeat Sentiment (and Magazine Covers) are Contrarian Buy Signals
Global Mail by Ivan Martchev
The Stock Market is Sniffing Out More Trade Deals
Sector Spotlight by Jason Bodner
Survival Techniques in a Confusing Market Year
View Full Archive
Read Past Issues Here
About The Author

Gary Alexander
SENIOR EDITOR
Gary Alexander has been Senior Writer at Navellier since 2009. He edits Navellier’s weekly Marketmail and writes a weekly Growth Mail column, in which he uses market history to support the case for growth stocks. For the previous 20-years before joining Navellier, he was Senior Executive Editor at InvestorPlace Media (formerly Phillips Publishing), where he worked with several leading investment analysts, including Louis Navellier (since 1997), helping launch Louis Navellier’s Blue Chip Growth and Global Growth newsletters.
Prior to that, Gary edited Wealth Magazine and Gold Newsletter and wrote various investment research reports for Jefferson Financial in New Orleans in the 1980s. He began his financial newsletter career with KCI Communications in 1980, where he served as consulting editor for Personal Finance newsletter while serving as general manager of KCI’s Alexandria House book division. Before that, he covered the economics beat for news magazines. All content of “Growth Mail” represents the opinion of Gary Alexander
Important Disclosures:
Although information in these reports has been obtained from and is based upon sources that Navellier believes to be reliable, Navellier does not guarantee its accuracy and it may be incomplete or condensed. All opinions and estimates constitute Navellier’s judgment as of the date the report was created and are subject to change without notice. These reports are for informational purposes only and are not a solicitation for the purchase or sale of a security. Any decision to purchase securities mentioned in these reports must take into account existing public information on such securities or any registered prospectus.To the extent permitted by law, neither Navellier & Associates, Inc., nor any of its affiliates, agents, or service providers assumes any liability or responsibility nor owes any duty of care for any consequences of any person acting or refraining to act in reliance on the information contained in this communication or for any decision based on it.
Past performance is no indication of future results. Investment in securities involves significant risk and has the potential for partial or complete loss of funds invested. It should not be assumed that any securities recommendations made by Navellier. in the future will be profitable or equal the performance of securities made in this report. Dividend payments are not guaranteed. The amount of a dividend payment, if any, can vary over time and issuers may reduce dividends paid on securities in the event of a recession or adverse event affecting a specific industry or issuer.
None of the stock information, data, and company information presented herein constitutes a recommendation by Navellier or a solicitation to buy or sell any securities. Any specific securities identified and described do not represent all of the securities purchased, sold, or recommended for advisory clients. The holdings identified do not represent all of the securities purchased, sold, or recommended for advisory clients and the reader should not assume that investments in the securities identified and discussed were or will be profitable.
Information presented is general information that does not take into account your individual circumstances, financial situation, or needs, nor does it present a personalized recommendation to you. Individual stocks presented may not be suitable for every investor. Investment in securities involves significant risk and has the potential for partial or complete loss of funds invested. Investment in fixed income securities has the potential for the investment return and principal value of an investment to fluctuate so that an investor’s holdings, when redeemed, may be worth less than their original cost.
One cannot invest directly in an index. Index is unmanaged and index performance does not reflect deduction of fees, expenses, or taxes. Presentation of Index data does not reflect a belief by Navellier that any stock index constitutes an investment alternative to any Navellier equity strategy or is necessarily comparable to such strategies. Among the most important differences between the Indices and Navellier strategies are that the Navellier equity strategies may (1) incur material management fees, (2) concentrate its investments in relatively few stocks, industries, or sectors, (3) have significantly greater trading activity and related costs, and (4) be significantly more or less volatile than the Indices.
ETF Risk: We may invest in exchange traded funds (“ETFs”) and some of our investment strategies are generally fully invested in ETFs. Like traditional mutual funds, ETFs charge asset-based fees, but they generally do not charge initial sales charges or redemption fees and investors typically pay only customary brokerage fees to buy and sell ETF shares. The fees and costs charged by ETFs held in client accounts will not be deducted from the compensation the client pays Navellier. ETF prices can fluctuate up or down, and a client account could lose money investing in an ETF if the prices of the securities owned by the ETF go down. ETFs are subject to additional risks:
- ETF shares may trade above or below their net asset value;
- An active trading market for an ETF’s shares may not develop or be maintained;
- The value of an ETF may be more volatile than the underlying portfolio of securities the ETF is designed to track;
- The cost of owning shares of the ETF may exceed those a client would incur by directly investing in the underlying securities; and
- Trading of an ETF’s shares may be halted if the listing exchange’s officials deem it appropriate, the shares are delisted from the exchange, or the activation of market-wide “circuit breakers” (which are tied to large decreases in stock prices) halts stock trading generally.
Grader Disclosures: Investment in equity strategies involves substantial risk and has the potential for partial or complete loss of funds invested. The sample portfolio and any accompanying charts are for informational purposes only and are not to be construed as a solicitation to buy or sell any financial instrument and should not be relied upon as the sole factor in an investment making decision. As a matter of normal and important disclosures to you, as a potential investor, please consider the following: The performance presented is not based on any actual securities trading, portfolio, or accounts, and the reported performance of the A, B, C, D, and F portfolios (collectively the “model portfolios”) should be considered mere “paper” or pro forma performance results based on Navellier’s research.
Investors evaluating any of Navellier & Associates, Inc.’s, (or its affiliates’) Investment Products must not use any information presented here, including the performance figures of the model portfolios, in their evaluation of any Navellier Investment Products. Navellier Investment Products include the firm’s mutual funds and managed accounts. The model portfolios, charts, and other information presented do not represent actual funded trades and are not actual funded portfolios. There are material differences between Navellier Investment Products’ portfolios and the model portfolios, research, and performance figures presented here. The model portfolios and the research results (1) may contain stocks or ETFs that are illiquid and difficult to trade; (2) may contain stock or ETF holdings materially different from actual funded Navellier Investment Product portfolios; (3) include the reinvestment of all dividends and other earnings, estimated trading costs, commissions, or management fees; and, (4) may not reflect prices obtained in an actual funded Navellier Investment Product portfolio. For these and other reasons, the reported performances of model portfolios do not reflect the performance results of Navellier’s actually funded and traded Investment Products. In most cases, Navellier’s Investment Products have materially lower performance results than the performances of the model portfolios presented.
This report contains statements that are, or may be considered to be, forward-looking statements. All statements that are not historical facts, including statements about our beliefs or expectations, are “forward-looking statements” within the meaning of The U.S. Private Securities Litigation Reform Act of 1995. These statements may be identified by such forward-looking terminology as “expect,” “estimate,” “plan,” “intend,” “believe,” “anticipate,” “may,” “will,” “should,” “could,” “continue,” “project,” or similar statements or variations of such terms. Our forward-looking statements are based on a series of expectations, assumptions, and projections, are not guarantees of future results or performance, and involve substantial risks and uncertainty as described in Form ADV Part 2A of our filing with the Securities and Exchange Commission (SEC), which is available at www.adviserinfo.sec.gov or by requesting a copy by emailing info@navellier.com. All of our forward-looking statements are as of the date of this report only. We can give no assurance that such expectations or forward-looking statements will prove to be correct. Actual results may differ materially. You are urged to carefully consider all such factors.
FEDERAL TAX ADVICE DISCLAIMER: As required by U.S. Treasury Regulations, you are informed that, to the extent this presentation includes any federal tax advice, the presentation is not written by Navellier to be used, and cannot be used, for the purpose of avoiding federal tax penalties. Navellier does not advise on any income tax requirements or issues. Use of any information presented by Navellier is for general information only and does not represent tax advice either express or implied. You are encouraged to seek professional tax advice for income tax questions and assistance.
IMPORTANT NEWSLETTER DISCLOSURE:The hypothetical performance results for investment newsletters that are authored or edited by Louis Navellier, including Louis Navellier’s Growth Investor, Louis Navellier’s Breakthrough Stocks, Louis Navellier’s Accelerated Profits, and Louis Navellier’s Platinum Club, are not based on any actual securities trading, portfolio, or accounts, and the newsletters’ reported hypothetical performances should be considered mere “paper” or proforma hypothetical performance results and are not actual performance of real world trades. Navellier & Associates, Inc. does not have any relation to or affiliation with the owner of these newsletters. There are material differences between Navellier Investment Products’ portfolios and the InvestorPlace Media, LLC newsletter portfolios authored by Louis Navellier. The InvestorPlace Media, LLC newsletters contain hypothetical performance that do not include transaction costs, advisory fees, or other fees a client might incur if actual investments and trades were being made by an investor. As a result, newsletter performance should not be used to evaluate Navellier Investment services which are separate and different from the newsletters. The owner of the newsletters is InvestorPlace Media, LLC and any questions concerning the newsletters, including any newsletter advertising or hypothetical Newsletter performance claims, (which are calculated solely by Investor Place Media and not Navellier) should be referred to InvestorPlace Media, LLC at (800) 718-8289.
Please note that Navellier & Associates and the Navellier Private Client Group are managed completely independent of the newsletters owned and published by InvestorPlace Media, LLC and written and edited by Louis Navellier, and investment performance of the newsletters should in no way be considered indicative of potential future investment performance for any Navellier & Associates separately managed account portfolio. Potential investors should consult with their financial advisor before investing in any Navellier Investment Product.
Navellier claims compliance with Global Investment Performance Standards (GIPS). To receive a complete list and descriptions of Navellier’s composites and/or a presentation that adheres to the GIPS standards, please contact Navellier or click here. It should not be assumed that any securities recommendations made by Navellier & Associates, Inc. in the future will be profitable or equal the performance of securities made in this report.
FactSet Disclosure: Navellier does not independently calculate the statistical information included in the attached report. The calculation and the information are provided by FactSet, a company not related to Navellier. Although information contained in the report has been obtained from FactSet and is based on sources Navellier believes to be reliable, Navellier does not guarantee its accuracy, and it may be incomplete or condensed. The report and the related FactSet sourced information are provided on an “as is” basis. The user assumes the entire risk of any use made of this information. Investors should consider the report as only a single factor in making their investment decision. The report is for informational purposes only and is not intended as an offer or solicitation for the purchase or sale of a security. FactSet sourced information is the exclusive property of FactSet. Without prior written permission of FactSet, this information may not be reproduced, disseminated or used to create any financial products. All indices are unmanaged and performance of the indices include reinvestment of dividends and interest income, unless otherwise noted, are not illustrative of any particular investment and an investment cannot be made in any index. Past performance is no guarantee of future results.