By Bryan Perry
March 25, 2025
The level of uncertainty for both the domestic economy and global economy is about as high as I can recall. The April 2nd tariff deadline looms, along with what that means to potential inflation, while the DOGE job cuts have met with the expected resistance, and proposed ceasefires between Ukraine and Russia, or between Israel and Gaza, are met with either mistrust, broken promises or more attacks. The Fed remains uncommitted to targeted rate cuts, while weak soft data fails to corroborate the healthier hard data and earnings forecasts are more guarded, with the dirty word “stagflation” being thrown around.
Heading into the end of the quarter next Monday, the analyst community still sounds very upbeat on U.S. companies’ sales and earnings prospects, despite the financial media embracing the recession narrative.
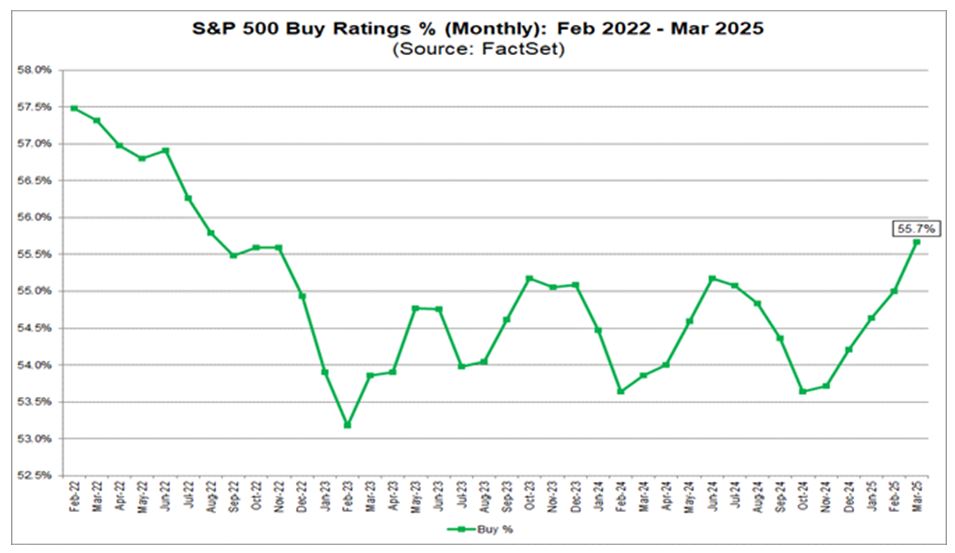
According to the latest research by FactSet, there are 12,320 ratings on S&P 500 stocks. Of these ratings, 55.7% are Buys, 38.7% are Holds, and only 5.6% are Sells. For comparison purposes, the five-year month-end average of Buy ratings is 55.0%. The average percentage of Hold ratings is 39.1% and the average percentage of Sell ratings is 5.9%, so all are fairly close to the current rating percentages.
Graphs are for illustrative and discussion purposes only. Please read important disclosures at the end of this commentary.
The trend of Buys is up: After falling to 53.6% at the end of October 2024, the percentage of Buy ratings for the S&P 500 has increased over the past five months to 55.7% today. If 55.7% is the final percentage of Buy ratings for the month of March, it will mark the highest (month-end) percentage of Buy ratings for the index since August 2022 (55.8%) – not quite the stuff of a pending recession. By sector, the highest percentage of buy ratings are in the energy, information technology and communications services sectors.
As I have mentioned before, the amount of goods at risk of being tariff-impacts only about 11% of total U.S. GDP and that is probably why the analyst community isn’t as bearish on U.S. business prospects as some of the talking heads at the media outlets would have us believe. If you look at a list of the top 10 stocks with the highest percentage of Buy ratings, three of the stocks are travel and leisure companies.
Investor Sentiment Just Set a Record Low
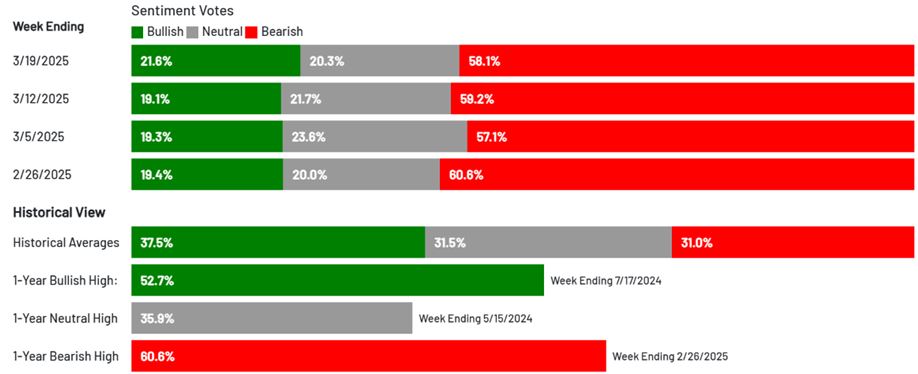
The American Association of Individual Investors (AAII) conducts a weekly seminar of its members, asking if they are bullish, bearish or neutral on the stock market over the next six months. The latest AAII survey is decidedly negative, but it experienced a slight uptick in the latest week. Bearish sentiment is unusually high and is above its historical average of 31% for the 16th time in 18 weeks. This is the first time in the history of the AAII survey that bearish sentiment exceeded 57% for four consecutive weeks.
Graphs are for illustrative and discussion purposes only. Please read important disclosures at the end of this commentary.
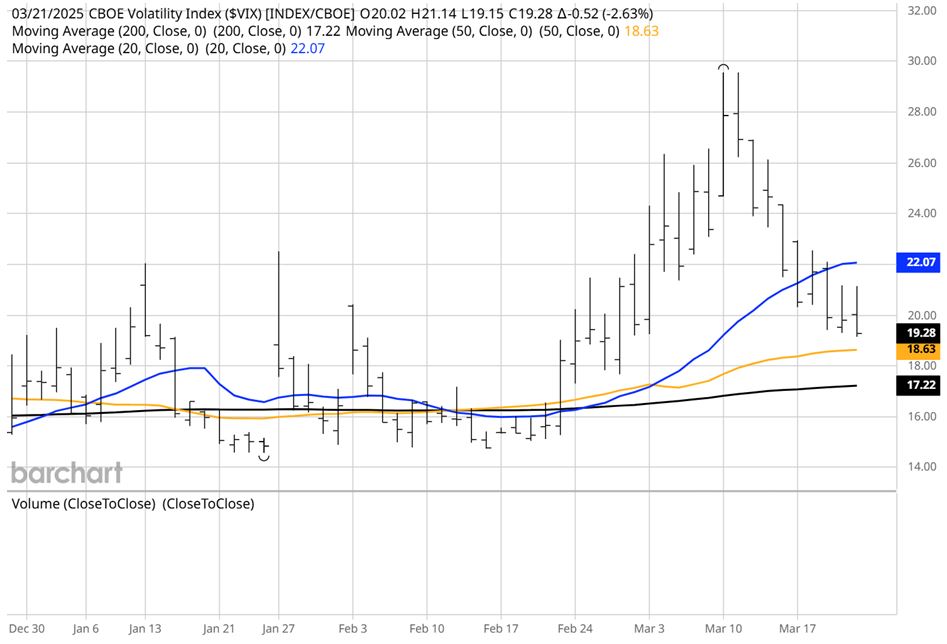
The AAII survey is noted for its role as a contrarian indicator – a signal to buy (when sentiment is ultra-bearish) or to sell (when their sentiment is super-bullish). When bullish sentiment is above 45%, the market is historically overbought. When the bearish sentiment is above 45% the market is historically oversold. For bearish sentiment to be above 57% for four straight weeks is starkly negative and telegraphs the same level of fear seen in the CBOE Volatility Index (VIX) that peaked at 29.56 on March 11 and now stands at a still-elevated 19.26. If past is prologue, the AAII survey is flashing a strong buy signal.
Graphs are for illustrative and discussion purposes only. Please read important disclosures at the end of this commentary.
The mood among monetary policymakers at the Fed is the same, one of caution, with most voting members adopting a wait-and-see stance toward tariffs and trade policy, which has fostered what Fed Chair Jerome Powell called “unusually elevated” uncertainty. When the Fed is unsure of the situation, markets trade lower, yet last week there were signs of bargain hunting emerging in beaten down sectors.
It is clear that this correction is the product of not just uncertainty and a decline in investor confidence but also the deleveraging by institutional and retail investors that came into 2025 locked and loaded for big market gains. This great unwind of leverage and related margin calls now seems to have run its course.
Last week, both Citigroup and Morgan Stanley reiterated their year-end targets for the S&P to hit 6,500, representing 15% upside from where the index currently trades. This would imply that the AI trade is still very much alive and well since the Magnificent 7 represents 35% of the S&P 500’s total weighting. As of this writing, only one of the Mag-7 is trading above its 200-day moving average, and only barely so.
There has been broad technical damage exacted among the majority of stocks within the S&P 500 with a lot of wood to chop for the market to reach 6,500 in just nine months until year-end. While I’m not holding my breath for 6,500, there is a sense that some leading stocks have appropriately recalibrated their valuations to reflect the thick fog bank the market was in. But while every fog bank greatly reduces our visibility, fogs are often localized, covering small areas, like patches along a great highway.
For now, investors should keep their fog lights on and drive with a sense of cautious optimism.
All content above represents the opinion of Bryan Perry of Navellier & Associates, Inc.
Also In This Issue
A Look Ahead by Louis Navellier
The “Dot Plot Thickens” at the Latest FOMC Meeting
Income Mail by Bryan Perry
There is a Major Disconnect Between Current Perception and Reality
Growth Mail by Gary Alexander
Is This a Mini-Correction or the Start of a Lost Decade?
Global Mail by Ivan Martchev
Some Bottoming Action in the Stock Market is Clearly Evident
Sector Spotlight by Jason Bodner
Some Good News and Bad News About This Correction
View Full Archive
Read Past Issues Here

Bryan Perry
SENIOR DIRECTOR
Bryan Perry is a Senior Director with Navellier Private Client Group, advising and facilitating high net worth investors in the pursuit of their financial goals.
Bryan’s financial services career spanning the past three decades includes over 20-years of wealth management experience with Wall Street firms that include Bear Stearns, Lehman Brothers and Paine Webber, working with both retail and institutional clients. Bryan earned a B.A. in Political Science from Virginia Polytechnic Institute & State University and currently holds a Series 65 license. All content of “Income Mail” represents the opinion of Bryan Perry
Important Disclosures:
Although information in these reports has been obtained from and is based upon sources that Navellier believes to be reliable, Navellier does not guarantee its accuracy and it may be incomplete or condensed. All opinions and estimates constitute Navellier’s judgment as of the date the report was created and are subject to change without notice. These reports are for informational purposes only and are not a solicitation for the purchase or sale of a security. Any decision to purchase securities mentioned in these reports must take into account existing public information on such securities or any registered prospectus.To the extent permitted by law, neither Navellier & Associates, Inc., nor any of its affiliates, agents, or service providers assumes any liability or responsibility nor owes any duty of care for any consequences of any person acting or refraining to act in reliance on the information contained in this communication or for any decision based on it.
Past performance is no indication of future results. Investment in securities involves significant risk and has the potential for partial or complete loss of funds invested. It should not be assumed that any securities recommendations made by Navellier. in the future will be profitable or equal the performance of securities made in this report. Dividend payments are not guaranteed. The amount of a dividend payment, if any, can vary over time and issuers may reduce dividends paid on securities in the event of a recession or adverse event affecting a specific industry or issuer.
None of the stock information, data, and company information presented herein constitutes a recommendation by Navellier or a solicitation to buy or sell any securities. Any specific securities identified and described do not represent all of the securities purchased, sold, or recommended for advisory clients. The holdings identified do not represent all of the securities purchased, sold, or recommended for advisory clients and the reader should not assume that investments in the securities identified and discussed were or will be profitable.
Information presented is general information that does not take into account your individual circumstances, financial situation, or needs, nor does it present a personalized recommendation to you. Individual stocks presented may not be suitable for every investor. Investment in securities involves significant risk and has the potential for partial or complete loss of funds invested. Investment in fixed income securities has the potential for the investment return and principal value of an investment to fluctuate so that an investor’s holdings, when redeemed, may be worth less than their original cost.
One cannot invest directly in an index. Index is unmanaged and index performance does not reflect deduction of fees, expenses, or taxes. Presentation of Index data does not reflect a belief by Navellier that any stock index constitutes an investment alternative to any Navellier equity strategy or is necessarily comparable to such strategies. Among the most important differences between the Indices and Navellier strategies are that the Navellier equity strategies may (1) incur material management fees, (2) concentrate its investments in relatively few stocks, industries, or sectors, (3) have significantly greater trading activity and related costs, and (4) be significantly more or less volatile than the Indices.
ETF Risk: We may invest in exchange traded funds (“ETFs”) and some of our investment strategies are generally fully invested in ETFs. Like traditional mutual funds, ETFs charge asset-based fees, but they generally do not charge initial sales charges or redemption fees and investors typically pay only customary brokerage fees to buy and sell ETF shares. The fees and costs charged by ETFs held in client accounts will not be deducted from the compensation the client pays Navellier. ETF prices can fluctuate up or down, and a client account could lose money investing in an ETF if the prices of the securities owned by the ETF go down. ETFs are subject to additional risks:
- ETF shares may trade above or below their net asset value;
- An active trading market for an ETF’s shares may not develop or be maintained;
- The value of an ETF may be more volatile than the underlying portfolio of securities the ETF is designed to track;
- The cost of owning shares of the ETF may exceed those a client would incur by directly investing in the underlying securities; and
- Trading of an ETF’s shares may be halted if the listing exchange’s officials deem it appropriate, the shares are delisted from the exchange, or the activation of market-wide “circuit breakers” (which are tied to large decreases in stock prices) halts stock trading generally.
Grader Disclosures: Investment in equity strategies involves substantial risk and has the potential for partial or complete loss of funds invested. The sample portfolio and any accompanying charts are for informational purposes only and are not to be construed as a solicitation to buy or sell any financial instrument and should not be relied upon as the sole factor in an investment making decision. As a matter of normal and important disclosures to you, as a potential investor, please consider the following: The performance presented is not based on any actual securities trading, portfolio, or accounts, and the reported performance of the A, B, C, D, and F portfolios (collectively the “model portfolios”) should be considered mere “paper” or pro forma performance results based on Navellier’s research.
Investors evaluating any of Navellier & Associates, Inc.’s, (or its affiliates’) Investment Products must not use any information presented here, including the performance figures of the model portfolios, in their evaluation of any Navellier Investment Products. Navellier Investment Products include the firm’s mutual funds and managed accounts. The model portfolios, charts, and other information presented do not represent actual funded trades and are not actual funded portfolios. There are material differences between Navellier Investment Products’ portfolios and the model portfolios, research, and performance figures presented here. The model portfolios and the research results (1) may contain stocks or ETFs that are illiquid and difficult to trade; (2) may contain stock or ETF holdings materially different from actual funded Navellier Investment Product portfolios; (3) include the reinvestment of all dividends and other earnings, estimated trading costs, commissions, or management fees; and, (4) may not reflect prices obtained in an actual funded Navellier Investment Product portfolio. For these and other reasons, the reported performances of model portfolios do not reflect the performance results of Navellier’s actually funded and traded Investment Products. In most cases, Navellier’s Investment Products have materially lower performance results than the performances of the model portfolios presented.
This report contains statements that are, or may be considered to be, forward-looking statements. All statements that are not historical facts, including statements about our beliefs or expectations, are “forward-looking statements” within the meaning of The U.S. Private Securities Litigation Reform Act of 1995. These statements may be identified by such forward-looking terminology as “expect,” “estimate,” “plan,” “intend,” “believe,” “anticipate,” “may,” “will,” “should,” “could,” “continue,” “project,” or similar statements or variations of such terms. Our forward-looking statements are based on a series of expectations, assumptions, and projections, are not guarantees of future results or performance, and involve substantial risks and uncertainty as described in Form ADV Part 2A of our filing with the Securities and Exchange Commission (SEC), which is available at www.adviserinfo.sec.gov or by requesting a copy by emailing info@navellier.com. All of our forward-looking statements are as of the date of this report only. We can give no assurance that such expectations or forward-looking statements will prove to be correct. Actual results may differ materially. You are urged to carefully consider all such factors.
FEDERAL TAX ADVICE DISCLAIMER: As required by U.S. Treasury Regulations, you are informed that, to the extent this presentation includes any federal tax advice, the presentation is not written by Navellier to be used, and cannot be used, for the purpose of avoiding federal tax penalties. Navellier does not advise on any income tax requirements or issues. Use of any information presented by Navellier is for general information only and does not represent tax advice either express or implied. You are encouraged to seek professional tax advice for income tax questions and assistance.
IMPORTANT NEWSLETTER DISCLOSURE:The hypothetical performance results for investment newsletters that are authored or edited by Louis Navellier, including Louis Navellier’s Growth Investor, Louis Navellier’s Breakthrough Stocks, Louis Navellier’s Accelerated Profits, and Louis Navellier’s Platinum Club, are not based on any actual securities trading, portfolio, or accounts, and the newsletters’ reported hypothetical performances should be considered mere “paper” or proforma hypothetical performance results and are not actual performance of real world trades. Navellier & Associates, Inc. does not have any relation to or affiliation with the owner of these newsletters. There are material differences between Navellier Investment Products’ portfolios and the InvestorPlace Media, LLC newsletter portfolios authored by Louis Navellier. The InvestorPlace Media, LLC newsletters contain hypothetical performance that do not include transaction costs, advisory fees, or other fees a client might incur if actual investments and trades were being made by an investor. As a result, newsletter performance should not be used to evaluate Navellier Investment services which are separate and different from the newsletters. The owner of the newsletters is InvestorPlace Media, LLC and any questions concerning the newsletters, including any newsletter advertising or hypothetical Newsletter performance claims, (which are calculated solely by Investor Place Media and not Navellier) should be referred to InvestorPlace Media, LLC at (800) 718-8289.
Please note that Navellier & Associates and the Navellier Private Client Group are managed completely independent of the newsletters owned and published by InvestorPlace Media, LLC and written and edited by Louis Navellier, and investment performance of the newsletters should in no way be considered indicative of potential future investment performance for any Navellier & Associates separately managed account portfolio. Potential investors should consult with their financial advisor before investing in any Navellier Investment Product.
Navellier claims compliance with Global Investment Performance Standards (GIPS). To receive a complete list and descriptions of Navellier’s composites and/or a presentation that adheres to the GIPS standards, please contact Navellier or click here. It should not be assumed that any securities recommendations made by Navellier & Associates, Inc. in the future will be profitable or equal the performance of securities made in this report.
FactSet Disclosure: Navellier does not independently calculate the statistical information included in the attached report. The calculation and the information are provided by FactSet, a company not related to Navellier. Although information contained in the report has been obtained from FactSet and is based on sources Navellier believes to be reliable, Navellier does not guarantee its accuracy, and it may be incomplete or condensed. The report and the related FactSet sourced information are provided on an “as is” basis. The user assumes the entire risk of any use made of this information. Investors should consider the report as only a single factor in making their investment decision. The report is for informational purposes only and is not intended as an offer or solicitation for the purchase or sale of a security. FactSet sourced information is the exclusive property of FactSet. Without prior written permission of FactSet, this information may not be reproduced, disseminated or used to create any financial products. All indices are unmanaged and performance of the indices include reinvestment of dividends and interest income, unless otherwise noted, are not illustrative of any particular investment and an investment cannot be made in any index. Past performance is no guarantee of future results.