by Jason Bodner
March 25, 2025
A kid says to his mom: “Ma? I have some good news and bad news.”
Mom says: “Give me the bad news first.”
Kid: “I took the wrong medicine.”
Mom: “What’s the good news?”
Kid: “I’m protected from fleas and ticks for the next month!”
It’s a good thing we humans don’t need to worry too much about fleas. Although, if you get them for some reason, you should know just flicking them off doesn’t do any good. That’s because an adult flea can jump 150 times its height. That’s impressive if you imagine that an average 5’9” adult male would be able to jump from the ground to the top of the Trump World Tower (870 feet) to match the same leap.
Well, I have some good news and some bad news for you this week – and it’s not about fleas.
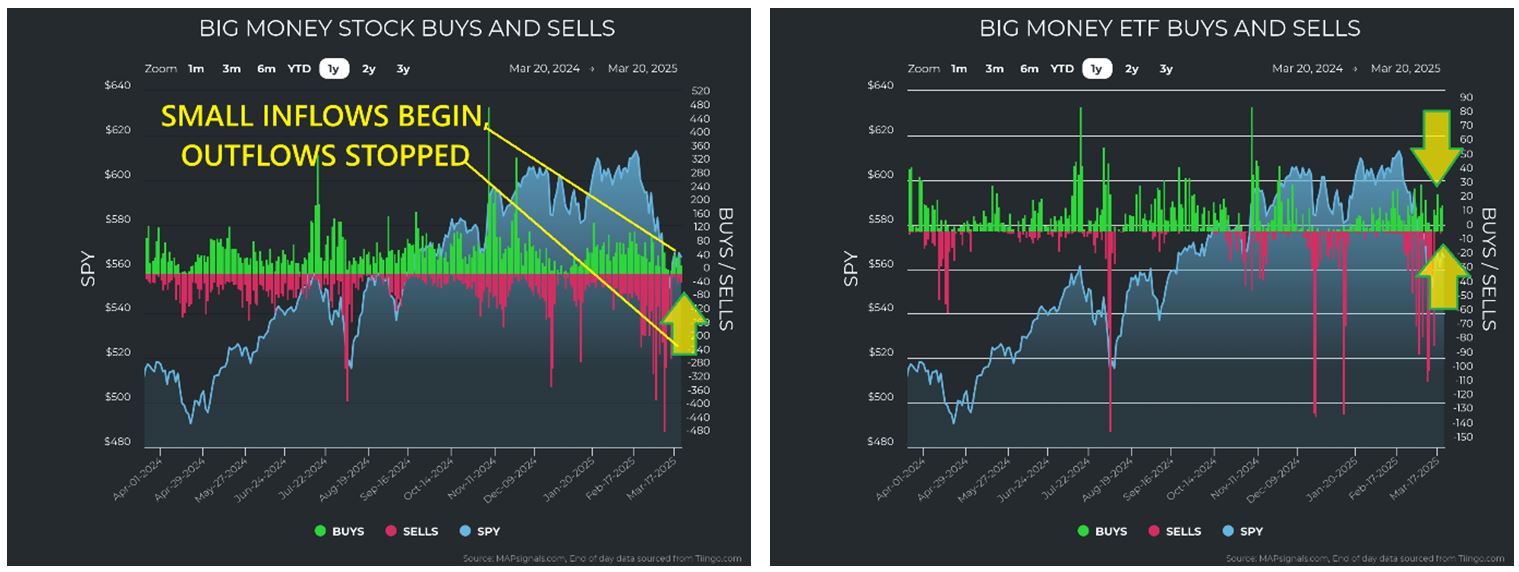
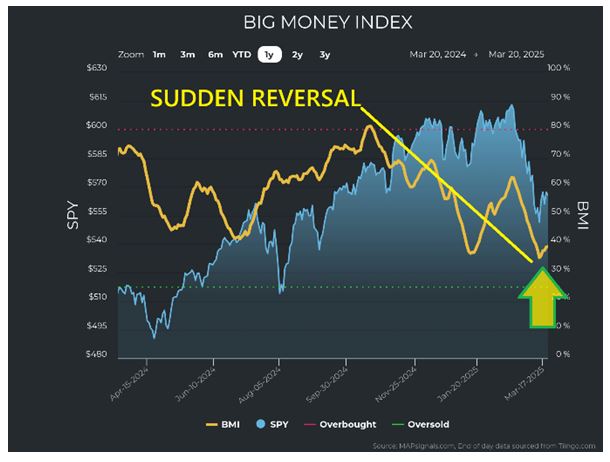
The good news is that we are not going oversold on the Big Money Index today, or this week, like I originally predicted. That’s also the bad news. It’s good, because (for now) it looks like the malicious selling for both stocks and ETFs has stopped abruptly, and we even see some emerging buying:
Graphs are for illustrative and discussion purposes only. Please read important disclosures at the end of this commentary.
This buying is reinforced with unusual flow volumes, too. This means that whoever had to sell is done selling for now. This sudden vanishing of outflows coupled with small buying reversed the BMI free-fall:
Graphs are for illustrative and discussion purposes only. Please read important disclosures at the end of this commentary.
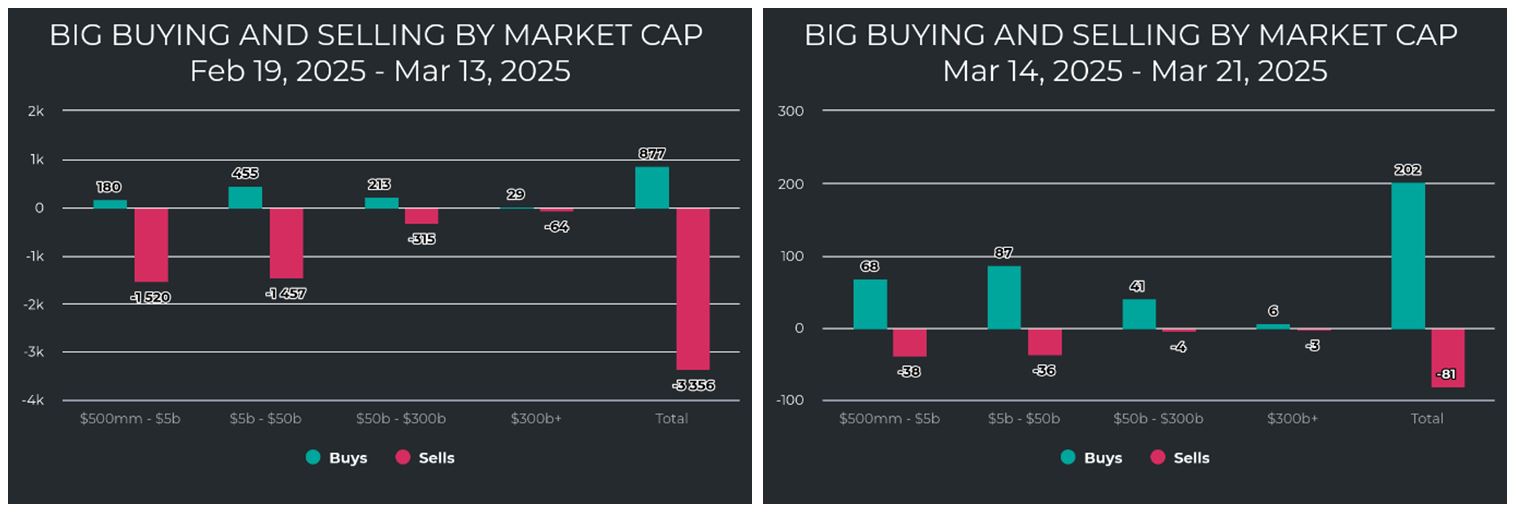
For further confirmation, let’s look at the flow data by market cap from the latest market peak on February 19th, through the low on March 13th, and then the market flow since the 13th:
Graphs are for illustrative and discussion purposes only. Please read important disclosures at the end of this commentary.
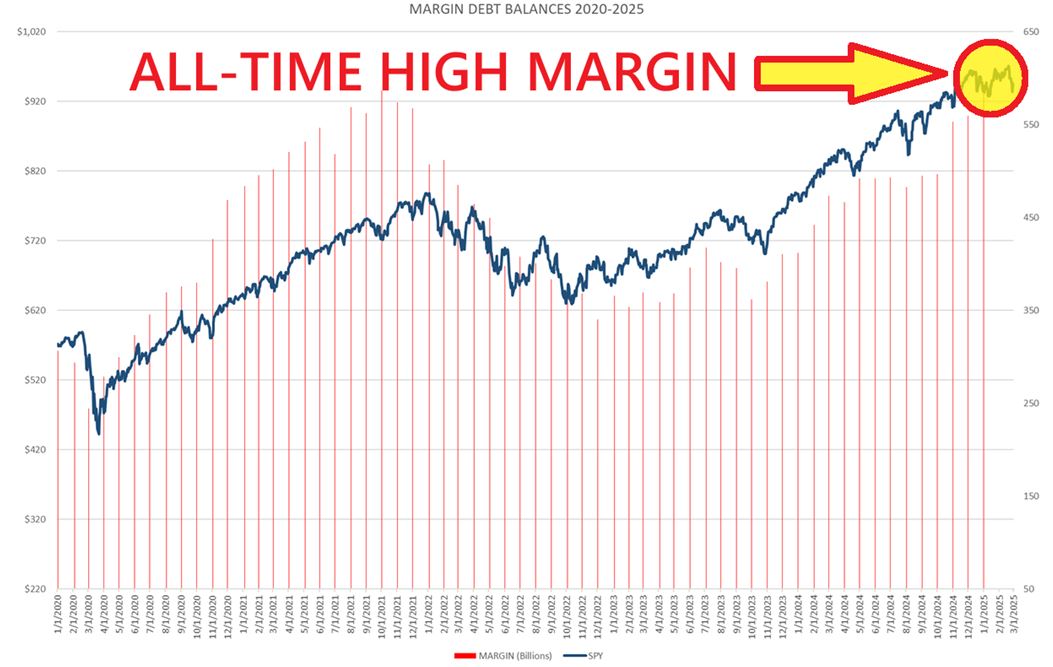
You can see a tale of two markets here. This reinforces the theory I proposed last week, that much of this selling was forced selling. When professional investors use leverage in an effort to beat a hot market, they can get caught flat-footed rather quickly. When stocks suddenly reverse sharply lower after a catalyst – say the threat of tariffs – investors need to take down their leverage quickly. And if they don’t, they will be forced to do so when margin calls come. And let’s not forget that margin debt balances, as reported by FINRA, reached epic all-time heights of $937 billion as of January 2025, up 33% from the year prior:
Graphs are for illustrative and discussion purposes only. Please read important disclosures at the end of this commentary.
I am highly confident that we will see a fall-off of these margin debt balances when the new statistics are updated in the coming weeks. I would also not be surprised to hear of some hedge fund blowups as this high percentage of leverage can do some nasty things to even longstanding firms.
Why use so much leverage? A look at the chart above shows a clear correlation between market prices and leverage. Money managers get paid high fees to beat the market. When a bull market runs long and strong, it is hard to beat. The incentive to leverage capital grows, but a sharp reversal can spell disaster.
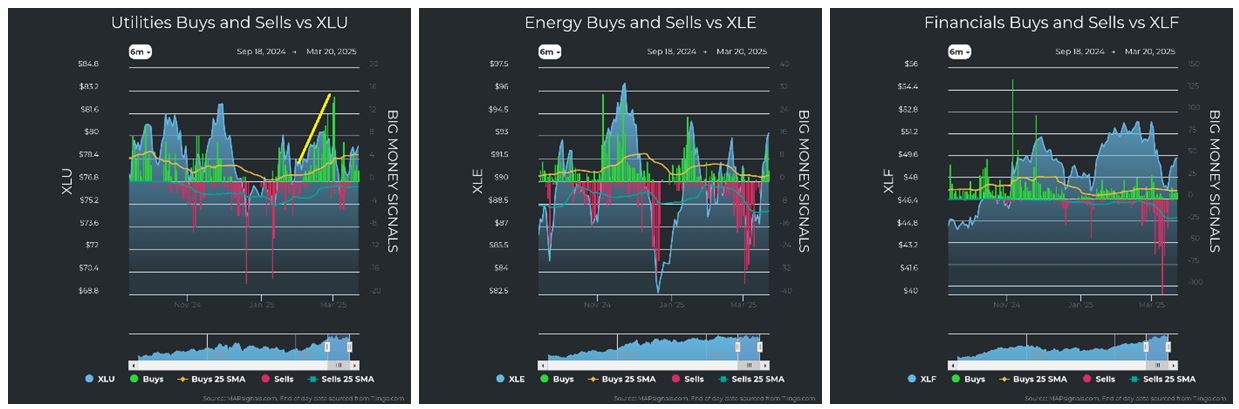
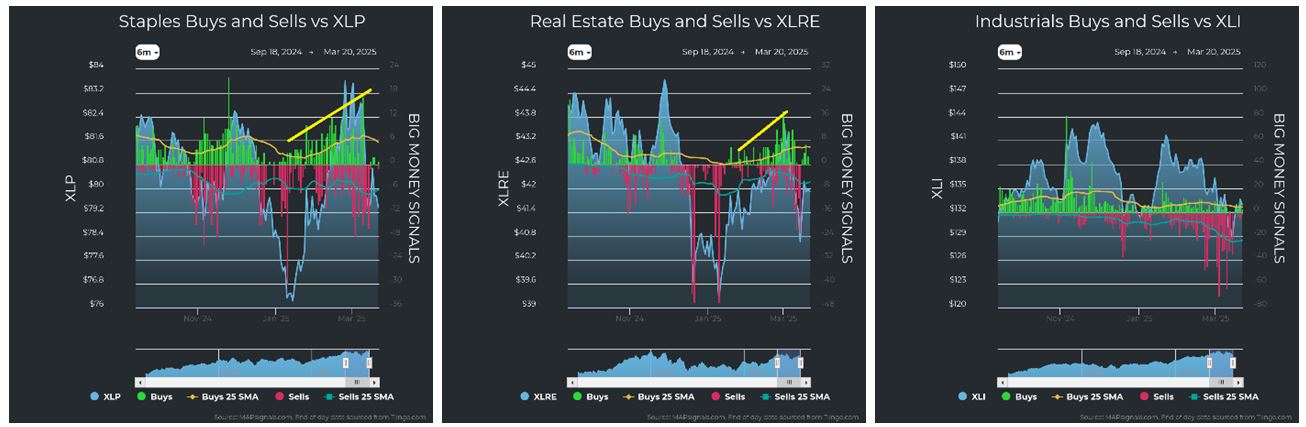
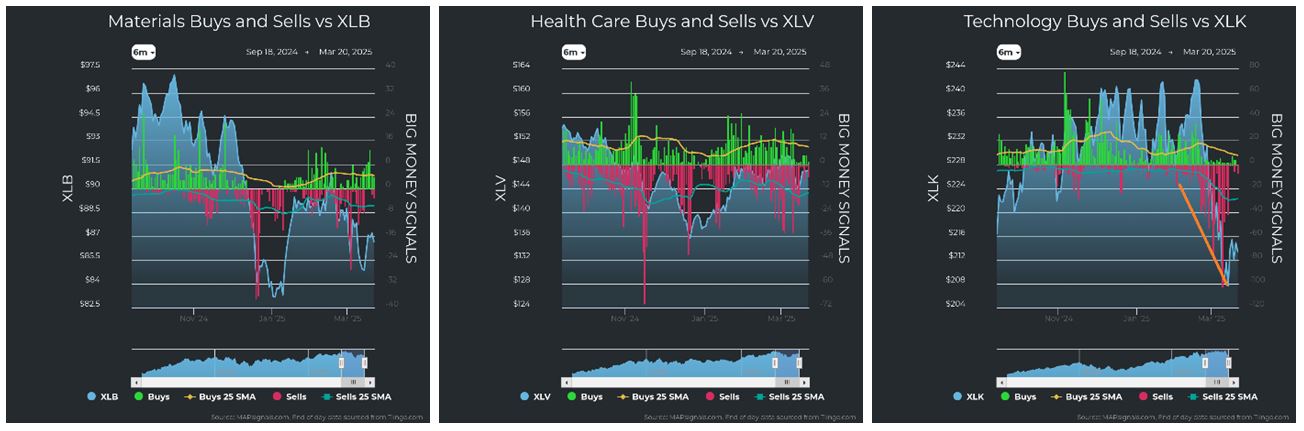
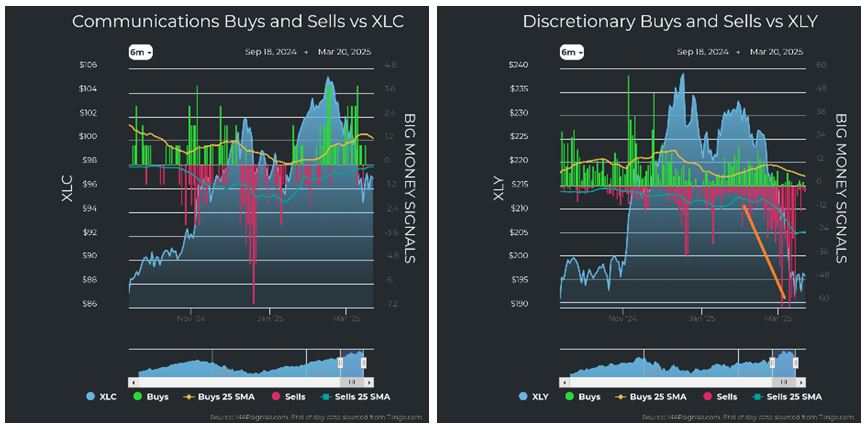
It appears, at least for now, that some leverage came out of the system in the form of forced selling, which heavily pressured stock prices. This action has also caused a major realignment of sector strengths and weaknesses. As investors rushed out of growth sectors, they clamored for safety in defensive sectors. This pushed Utilities and Staples up in rank, while growth sectors plummeted, like technology and discretionary:
![]()
Graphs are for illustrative and discussion purposes only. Please read important disclosures at the end of this commentary.
When we monitor inflows and outflows at the sector level in these 11 charts each week, we notice that Utilities and Real Estate saw inflows. Technology, Discretionary and Industrials saw outflows:
Graphs are for illustrative and discussion purposes only. Please read important disclosures at the end of this commentary.
So, the good news this week is that I was wrong last week! The market may not go oversold in the near-term. That averts the pain of a market free-fall. The bad news is that bargains won’t fall from the sky like they do during an oversold market. In investing, cheap stocks often masquerade as the apocalypse.
You know it’s true. I can’t count how many times I have heard: “I wish I had more money to buy during the Financial Crisis.” The same applies to the COVID-19 crash. It is a cycle that happens over and over again. Just look at this random list of some of the major and minor market crashes in history:
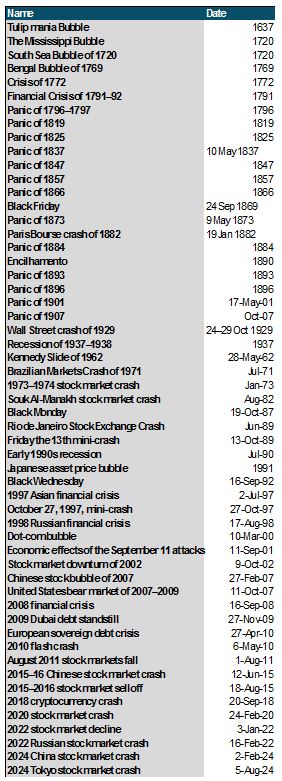
Graphs are for illustrative and discussion purposes only. Please read important disclosures at the end of this commentary.
And just since 2010, we’ve seen great profits from buying into false panic fears. This is a graphic from 2022, but it still rings true, with awesome returns whenever CNBC airs a “Markets in Turmoil” special.
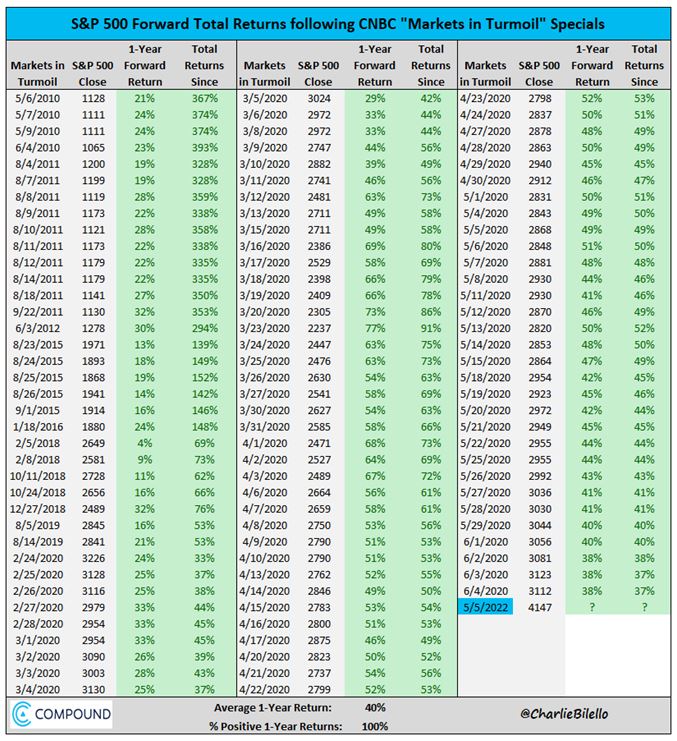
Graphs are for illustrative and discussion purposes only. Please read important disclosures at the end of this commentary.
So, a part of me was rooting for an oversold market this week or next. That’s because an oversold condition holds the key to huge asymmetrical payoffs to the upside. In other words, big scary sell-offs bring the best opportunities for buying good stocks at outrageously low prices.
While we may not get to oversold conditions this week, or next month, there is still a possibility that selling picks up again. For now, though, I think the odds are high that the low is in, so this is a great time to pick up great stocks. Remember, though, that when stocks are “cheap” it’s because no one wants them.
That means we are still betting against the crowd. Mentally, that can be tough. I still want to own NVDA, even when it is falling. (I have not sold my NVDA). In other words, going with the crowd when it is confident feels natural, but when a correction comes, it is easy to get on board the fear train.
But 150 years of rising stock prices show why fear can be expensive:
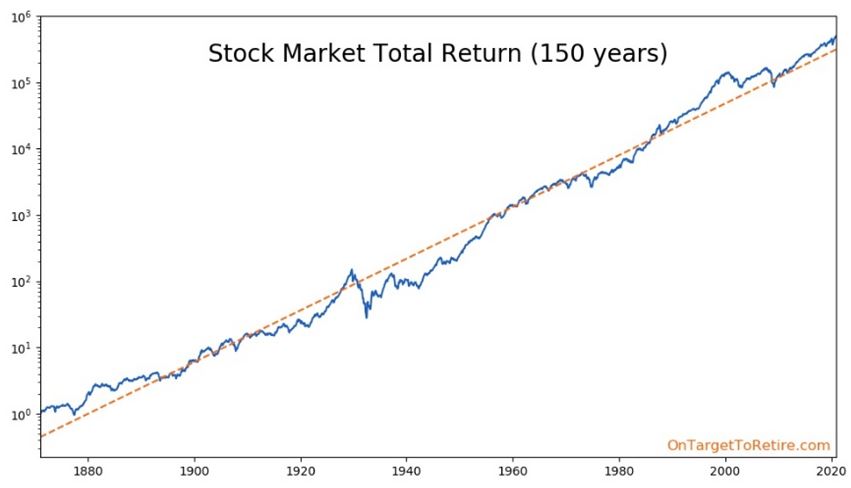
Graphs are for illustrative and discussion purposes only. Please read important disclosures at the end of this commentary.
I am betting on this 150-year trend. The long-term investor should, too. Focus on tomorrow’s promise while extracting the most today. Be ready with a list of targeted purchases if you have cash to deploy.
Confucius said: “Patience attracts happiness; it brings near that which is far.”
Navellier & Associates; own Nvidia Corp (NVDA), in managed accounts. Jason Bodner owns Nvidia Corp (NVDA), personally.
All content above represents the opinion of Jason Bodner of Navellier & Associates, Inc.
Also In This Issue
A Look Ahead by Louis Navellier
The “Dot Plot Thickens” at the Latest FOMC Meeting
Income Mail by Bryan Perry
There is a Major Disconnect Between Current Perception and Reality
Growth Mail by Gary Alexander
Is This a Mini-Correction or the Start of a Lost Decade?
Global Mail by Ivan Martchev
Some Bottoming Action in the Stock Market is Clearly Evident
Sector Spotlight by Jason Bodner
Some Good News and Bad News About This Correction
View Full Archive
Read Past Issues Here

Jason Bodner
MARKETMAIL EDITOR FOR SECTOR SPOTLIGHT
Jason Bodner writes Sector Spotlight in the weekly Marketmail publication and has authored several white papers for the company. He is also Co-Founder of Macro Analytics for Professionals which produces proprietary equity accumulation and distribution research for its clients. Previously, Mr. Bodner served as Director of European Equity Derivatives for Cantor Fitzgerald Europe in London, then moved to the role of Head of Equity Derivatives North America for the same company in New York. He also served as S.V.P. Equity Derivatives for Jefferies, LLC. He received a B.S. in business administration in 1996, with honors, from Skidmore College as a member of the Periclean Honors Society. All content of “Sector Spotlight” represents the opinion of Jason Bodner
Important Disclosures:
Jason Bodner is a co-founder and co-owner of Mapsignals. Mr. Bodner is an independent contractor who is occasionally hired by Navellier & Associates to write an article and or provide opinions for possible use in articles that appear in Navellier & Associates weekly Market Mail. Mr. Bodner is not employed or affiliated with Louis Navellier, Navellier & Associates, Inc., or any other Navellier owned entity. The opinions and statements made here are those of Mr. Bodner and not necessarily those of any other persons or entities. This is not an endorsement, or solicitation or testimonial or investment advice regarding the BMI Index or any statements or recommendations or analysis in the article or the BMI Index or Mapsignals or its products or strategies.
Although information in these reports has been obtained from and is based upon sources that Navellier believes to be reliable, Navellier does not guarantee its accuracy and it may be incomplete or condensed. All opinions and estimates constitute Navellier’s judgment as of the date the report was created and are subject to change without notice. These reports are for informational purposes only and are not a solicitation for the purchase or sale of a security. Any decision to purchase securities mentioned in these reports must take into account existing public information on such securities or any registered prospectus.To the extent permitted by law, neither Navellier & Associates, Inc., nor any of its affiliates, agents, or service providers assumes any liability or responsibility nor owes any duty of care for any consequences of any person acting or refraining to act in reliance on the information contained in this communication or for any decision based on it.
Past performance is no indication of future results. Investment in securities involves significant risk and has the potential for partial or complete loss of funds invested. It should not be assumed that any securities recommendations made by Navellier. in the future will be profitable or equal the performance of securities made in this report. Dividend payments are not guaranteed. The amount of a dividend payment, if any, can vary over time and issuers may reduce dividends paid on securities in the event of a recession or adverse event affecting a specific industry or issuer.
None of the stock information, data, and company information presented herein constitutes a recommendation by Navellier or a solicitation to buy or sell any securities. Any specific securities identified and described do not represent all of the securities purchased, sold, or recommended for advisory clients. The holdings identified do not represent all of the securities purchased, sold, or recommended for advisory clients and the reader should not assume that investments in the securities identified and discussed were or will be profitable.
Information presented is general information that does not take into account your individual circumstances, financial situation, or needs, nor does it present a personalized recommendation to you. Individual stocks presented may not be suitable for every investor. Investment in securities involves significant risk and has the potential for partial or complete loss of funds invested. Investment in fixed income securities has the potential for the investment return and principal value of an investment to fluctuate so that an investor’s holdings, when redeemed, may be worth less than their original cost.
One cannot invest directly in an index. Index is unmanaged and index performance does not reflect deduction of fees, expenses, or taxes. Presentation of Index data does not reflect a belief by Navellier that any stock index constitutes an investment alternative to any Navellier equity strategy or is necessarily comparable to such strategies. Among the most important differences between the Indices and Navellier strategies are that the Navellier equity strategies may (1) incur material management fees, (2) concentrate its investments in relatively few stocks, industries, or sectors, (3) have significantly greater trading activity and related costs, and (4) be significantly more or less volatile than the Indices.
ETF Risk: We may invest in exchange traded funds (“ETFs”) and some of our investment strategies are generally fully invested in ETFs. Like traditional mutual funds, ETFs charge asset-based fees, but they generally do not charge initial sales charges or redemption fees and investors typically pay only customary brokerage fees to buy and sell ETF shares. The fees and costs charged by ETFs held in client accounts will not be deducted from the compensation the client pays Navellier. ETF prices can fluctuate up or down, and a client account could lose money investing in an ETF if the prices of the securities owned by the ETF go down. ETFs are subject to additional risks:
- ETF shares may trade above or below their net asset value;
- An active trading market for an ETF’s shares may not develop or be maintained;
- The value of an ETF may be more volatile than the underlying portfolio of securities the ETF is designed to track;
- The cost of owning shares of the ETF may exceed those a client would incur by directly investing in the underlying securities and;
- Trading of an ETF’s shares may be halted if the listing exchange’s officials deem it appropriate, the shares are delisted from the exchange, or the activation of market-wide “circuit breakers” (which are tied to large decreases in stock prices) halts stock trading generally.
Grader Disclosures: Investment in equity strategies involves substantial risk and has the potential for partial or complete loss of funds invested. The sample portfolio and any accompanying charts are for informational purposes only and are not to be construed as a solicitation to buy or sell any financial instrument and should not be relied upon as the sole factor in an investment making decision. As a matter of normal and important disclosures to you, as a potential investor, please consider the following: The performance presented is not based on any actual securities trading, portfolio, or accounts, and the reported performance of the A, B, C, D, and F portfolios (collectively the “model portfolios”) should be considered mere “paper” or pro forma performance results based on Navellier’s research.
Investors evaluating any of Navellier & Associates, Inc.’s, (or its affiliates’) Investment Products must not use any information presented here, including the performance figures of the model portfolios, in their evaluation of any Navellier Investment Products. Navellier Investment Products include the firm’s mutual funds and managed accounts. The model portfolios, charts, and other information presented do not represent actual funded trades and are not actual funded portfolios. There are material differences between Navellier Investment Products’ portfolios and the model portfolios, research, and performance figures presented here. The model portfolios and the research results (1) may contain stocks or ETFs that are illiquid and difficult to trade; (2) may contain stock or ETF holdings materially different from actual funded Navellier Investment Product portfolios; (3) include the reinvestment of all dividends and other earnings, estimated trading costs, commissions, or management fees; and, (4) may not reflect prices obtained in an actual funded Navellier Investment Product portfolio. For these and other reasons, the reported performances of model portfolios do not reflect the performance results of Navellier’s actually funded and traded Investment Products. In most cases, Navellier’s Investment Products have materially lower performance results than the performances of the model portfolios presented.
This report contains statements that are, or may be considered to be, forward-looking statements. All statements that are not historical facts, including statements about our beliefs or expectations, are “forward-looking statements” within the meaning of The U.S. Private Securities Litigation Reform Act of 1995. These statements may be identified by such forward-looking terminology as “expect,” “estimate,” “plan,” “intend,” “believe,” “anticipate,” “may,” “will,” “should,” “could,” “continue,” “project,” or similar statements or variations of such terms. Our forward-looking statements are based on a series of expectations, assumptions, and projections, are not guarantees of future results or performance, and involve substantial risks and uncertainty as described in Form ADV Part 2A of our filing with the Securities and Exchange Commission (SEC), which is available at www.adviserinfo.sec.gov or by requesting a copy by emailing info@navellier.com. All of our forward-looking statements are as of the date of this report only. We can give no assurance that such expectations or forward-looking statements will prove to be correct. Actual results may differ materially. You are urged to carefully consider all such factors.
FEDERAL TAX ADVICE DISCLAIMER: As required by U.S. Treasury Regulations, you are informed that, to the extent this presentation includes any federal tax advice, the presentation is not written by Navellier to be used, and cannot be used, for the purpose of avoiding federal tax penalties. Navellier does not advise on any income tax requirements or issues. Use of any information presented by Navellier is for general information only and does not represent tax advice either express or implied. You are encouraged to seek professional tax advice for income tax questions and assistance.
IMPORTANT NEWSLETTER DISCLOSURE:The hypothetical performance results for investment newsletters that are authored or edited by Louis Navellier, including Louis Navellier’s Growth Investor, Louis Navellier’s Breakthrough Stocks, Louis Navellier’s Accelerated Profits, and Louis Navellier’s Platinum Club, are not based on any actual securities trading, portfolio, or accounts, and the newsletters’ reported hypothetical performances should be considered mere “paper” or proforma hypothetical performance results and are not actual performance of real world trades. Navellier & Associates, Inc. does not have any relation to or affiliation with the owner of these newsletters. There are material differences between Navellier Investment Products’ portfolios and the InvestorPlace Media, LLC newsletter portfolios authored by Louis Navellier. The InvestorPlace Media, LLC newsletters contain hypothetical performance that do not include transaction costs, advisory fees, or other fees a client might incur if actual investments and trades were being made by an investor. As a result, newsletter performance should not be used to evaluate Navellier Investment services which are separate and different from the newsletters. The owner of the newsletters is InvestorPlace Media, LLC and any questions concerning the newsletters, including any newsletter advertising or hypothetical Newsletter performance claims, (which are calculated solely by Investor Place Media and not Navellier) should be referred to InvestorPlace Media, LLC at (800) 718-8289.
Please note that Navellier & Associates and the Navellier Private Client Group are managed completely independent of the newsletters owned and published by InvestorPlace Media, LLC and written and edited by Louis Navellier, and investment performance of the newsletters should in no way be considered indicative of potential future investment performance for any Navellier & Associates separately managed account portfolio. Potential investors should consult with their financial advisor before investing in any Navellier Investment Product.
Navellier claims compliance with Global Investment Performance Standards (GIPS). To receive a complete list and descriptions of Navellier’s composites and/or a presentation that adheres to the GIPS standards, please contact Navellier or click here. It should not be assumed that any securities recommendations made by Navellier & Associates, Inc. in the future will be profitable or equal the performance of securities made in this report.
FactSet Disclosure: Navellier does not independently calculate the statistical information included in the attached report. The calculation and the information are provided by FactSet, a company not related to Navellier. Although information contained in the report has been obtained from FactSet and is based on sources Navellier believes to be reliable, Navellier does not guarantee its accuracy, and it may be incomplete or condensed. The report and the related FactSet sourced information are provided on an “as is” basis. The user assumes the entire risk of any use made of this information. Investors should consider the report as only a single factor in making their investment decision. The report is for informational purposes only and is not intended as an offer or solicitation for the purchase or sale of a security. FactSet sourced information is the exclusive property of FactSet. Without prior written permission of FactSet, this information may not be reproduced, disseminated or used to create any financial products. All indices are unmanaged and performance of the indices include reinvestment of dividends and interest income, unless otherwise noted, are not illustrative of any particular investment and an investment cannot be made in any index. Past performance is no guarantee of future results.