by Jason Bodner
March 24, 2026
A Remora is a small fish with a suction-cup on its head. Attaching itself to sharks, it feeds on scraps while the host does the heavy work. Never leading, the Remora simply joins something bigger – and thrives.
What a great investment strategy!
Big institutions – like hedge funds, pension funds, and sovereign wealth managers – move billions of dollars with intent. They try to hide their tracks but can’t erase all the evidence and their buying and selling leaves a trail – unusually large trades and persistent directional flows. This is the trail I follow.
For the past 16 weeks, that trail has been screaming two things, and most investors heard neither.
Today, I will tell you what these big buyers knew, what they know now, and what we should do next.
What the Data Told Us Last December
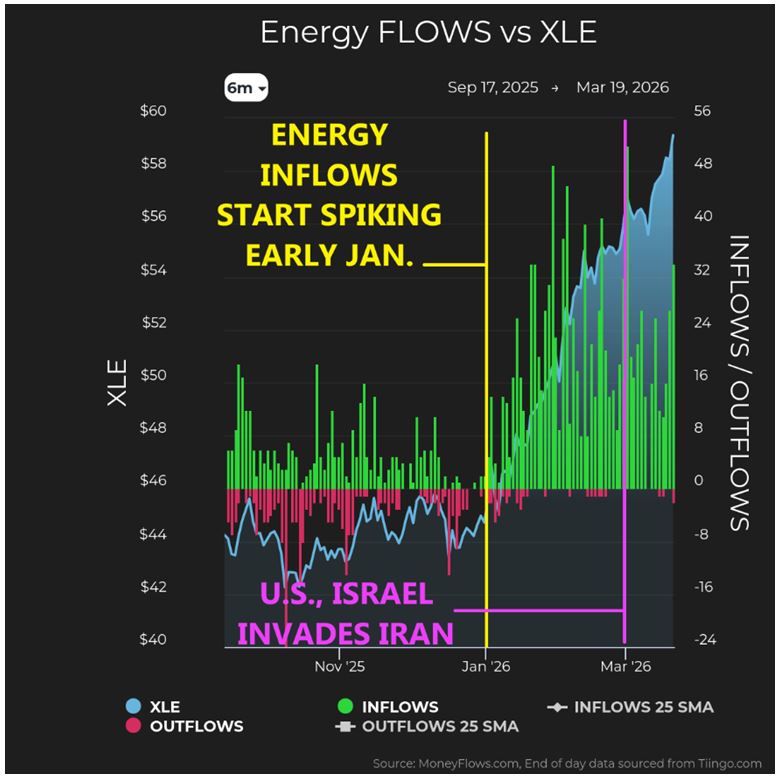
On December 1st, energy was already the #1 inflow sector, not because oil was spiking. No, Texas crude was under $60 and Brent sat quietly at $65. This was not due to any geopolitical event. Energy was a buy simply because big money was rotating in, quietly, stock by stock. By January, 370 inflow signals came from energy alone. In February, 417 more. These were not momentum chasers but position builders.
Graphs are for illustrative and discussion purposes only. Please read important disclosures at the end of this commentary.
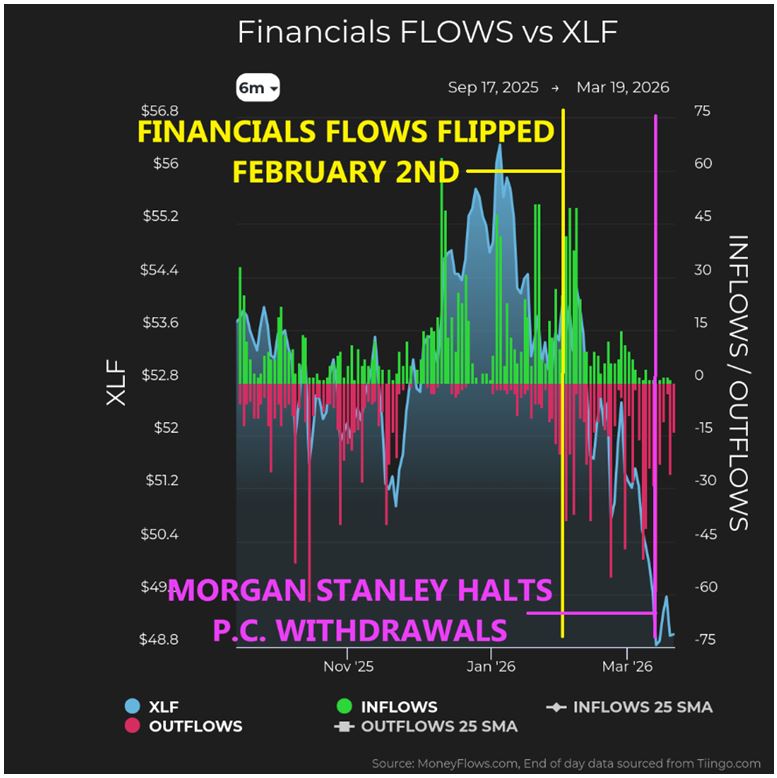
Meanwhile, financials were healthy in December and January, with strong inflow readings, but February delivered a different story. Financial sector flows flipped on February 1st. December and January saw combined net inflows of +607 but February slipped into the negative. March exploded to -286. Nine of the 10-largest private credit platforms showed systematic outflows. MoneyFlows scores across the group collapsed into the 30s and 40s.
Morgan Stanley showed four consecutive outflow signals, beginning February 23rd. Their private credit fund withdrawal halt came weeks later. This tells us, as usual, the money flows knew first.
Graphs are for illustrative and discussion purposes only. Please read important disclosures at the end of this commentary.