by Jason Bodner
March 18, 2025
If I were to use “click bait,” I could headline this piece, “WHY THE MARKET IS COLLAPSING — AND THE EXACT DAY IT WILL END, from the man who called the COVID crash low to the day.”
OK, I’m not that big on specific predictions, but I always let the data steer the way, and sometimes I get lucky. Today, I’ll use the same method that allowed me to call the precise market bottom of 2020’s COVID crash – almost exactly five years ago – to identify when I think this correction will end.
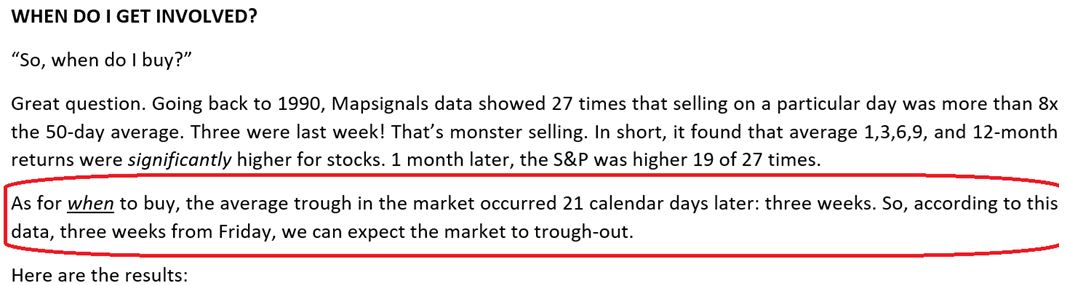
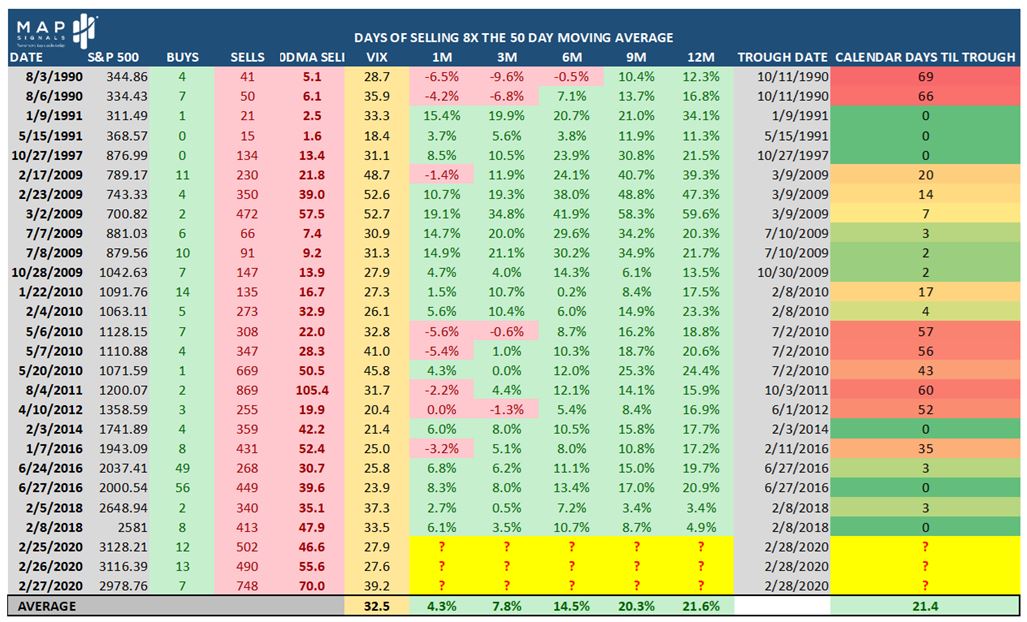
Five years ago, on March 30th, 2020, I recorded a podcast interview – of necessity from my backyard during the lock-down during COVID-19. I said that the market bottom was already in, based on my data. It was a very unpopular opinion then. Pessimism was at an all-time high. No one knew the future. Neither did I, but I looked at the data to find a possible scenario to buy stocks, and my scenario was bang-on accurate. A month before that interview, on February 28th 2020, I studied my data to predict a market low. It was published March 1st under the title “Die Cry.” Here’s what I wrote:
Graphs are for illustrative and discussion purposes only. Please read important disclosures at the end of this commentary.
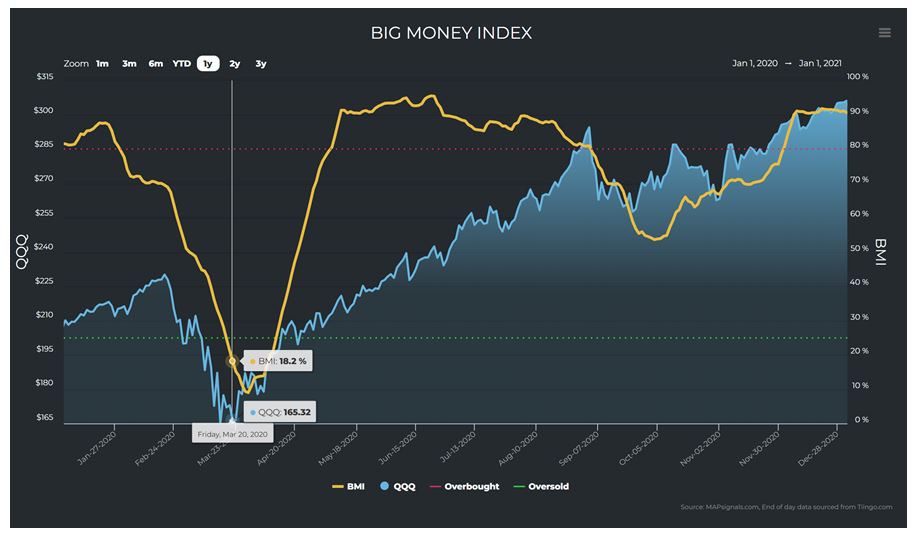
That made my market bottom prediction for Friday, March 20th which was the precise low for QQQ (the NASDAQ tracking ETF):
Graphs are for illustrative and discussion purposes only. Please read important disclosures at the end of this commentary.
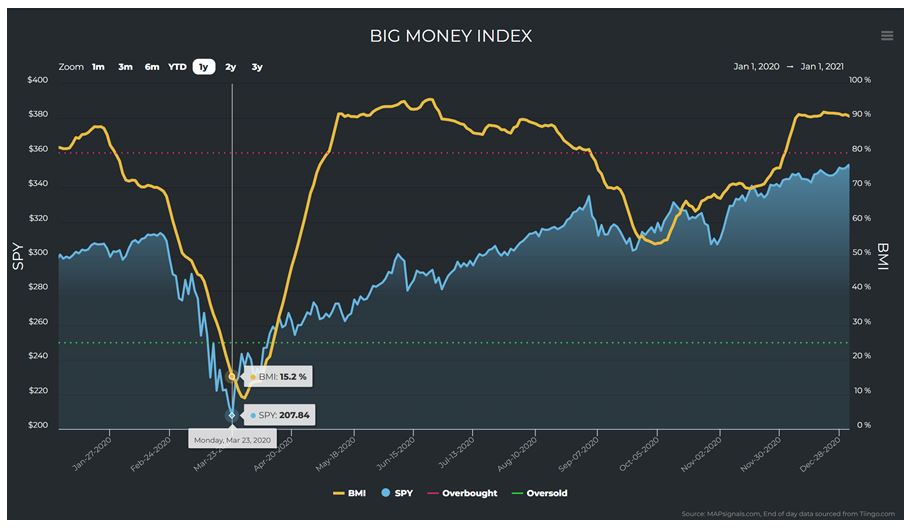
SPY (the S&P 500 tracking ETF) bottomed out the next trading day, on Monday, March 23rd.
Graphs are for illustrative and discussion purposes only. Please read important disclosures at the end of this commentary.
I’ve used the same method for the next three oversold instances since then, with strong accuracy.
OK, so what’s next? First, let’s discuss what’s happening now…
Headlines tell only part of the story. Recent news reports focus on Trump’s tariffs igniting a trade war. The fear is that these tariffs, combined with deep DOGE cuts, could bring on a recession. Last Monday, Goldman Sachs downgraded their economic outlook due to “considerably more adverse” impacts. For a while, there were threats of a government shutdown, but Congress avoided that outcome last Friday.
Maybe the bears are right, maybe not, but there is more going on here. I recently showed you how breadth has deteriorated since November in the ~5,500 stocks we score daily. Here’s a refresher of what I wrote:
- On November 29, only 35% of stocks traded below their 50-day moving average. The average P/E ratio (trailing 12 months) was 40.5 – substantially higher than the S&P 500.
- On February 19th, the day the S&P 500 reached an all-time high, significantly more (47%) of our ~5,550 stocks traded below their 50-day moving average (DMA). The average P/E ratio (TTM) was 38.3. The valuation correction had begun, even with major indexes making highs.
- On February 27th, the S&P 500 reached a year-to-date low with 4% of our universe trading below their 50-day moving average. The average P/E ratio (TTM), for our universe was 35.3.
- March 10th had 5% of stocks trading below their 50-DMA and the average P/E at 29.5 This means a valuation correction of -27% had already taken place.
As any price and P/E compression takes place, funds feel the burn first. As the 2024 bull market kept rising, so did fund leverage, so this correction has everything to do with reducing fund leverage.
Imagine I run a hedge fund. My mandate is to beat the S&P 500. My fees are 2% of your assets and 20% of profits. To maximize profits, I (the manager) am incentivized to use leverage, so I will try to leverage capital 2-to-1 and beat the S&P 500. This works very well for me in a low-volatility up-trending market.
But then we hit a bump. Trump announces tariffs and stocks immediately swoon. The S&P 500 may look great at highs – like on February 19th – but the signs of weakness were clear, below the surface.
As stocks began to fall, the risk managers stepped in, since they manage risk for the entire firm’s assets.
Remember, our fictional fund had employed leverage, often 1.5-to-1 or 2-to-1. As the market turns south, the risk manager says to his Portfolio Managers (PMs): “You need to reduce gross,” meaning “reduce gross exposure,” or leverage. The PMs are left with no choice: they must sell. At my firm, we called this “forced selling.” These stocks may be of great quality, but risk is high, so the pros are forced to sell them.
If this sounds far-fetched, I want you to look at the following charts. Brokers are legally required to report client leverage usage to FINRA. Look what happens when we plot margin in red against market index ETFs in blue. Just focus on how correlated market performance is to margin balances (leverage):
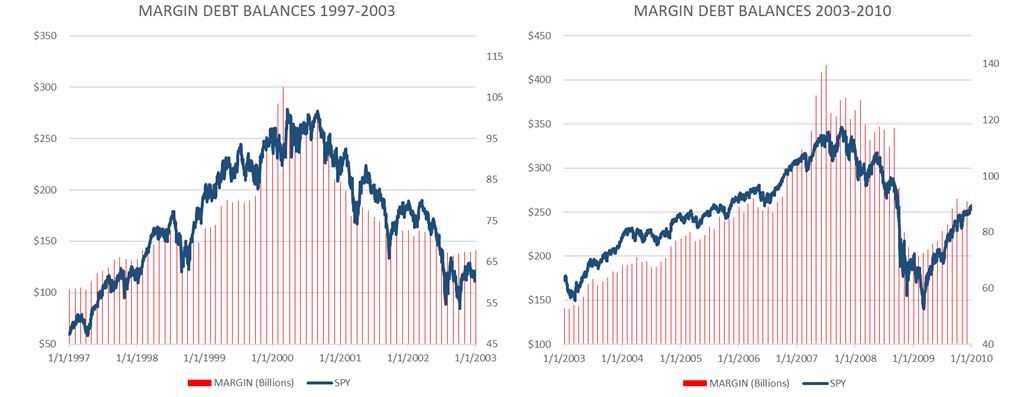
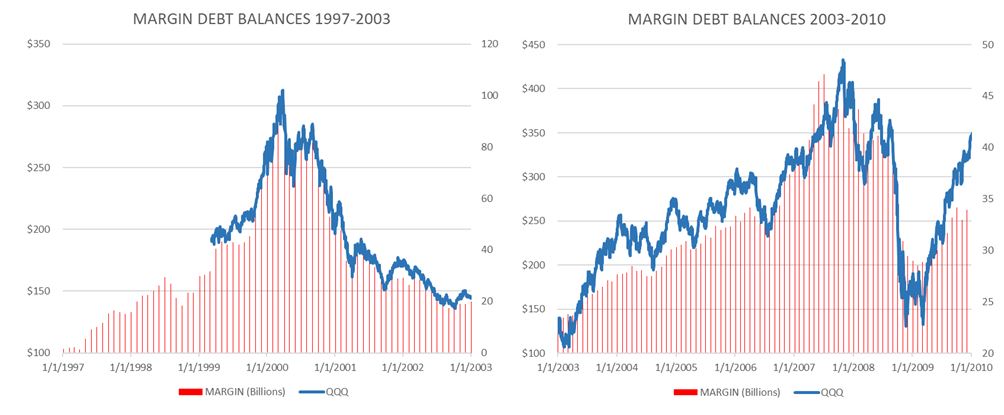
Graphs are for illustrative and discussion purposes only. Please read important disclosures at the end of this commentary.
Now look at a long-term chart:
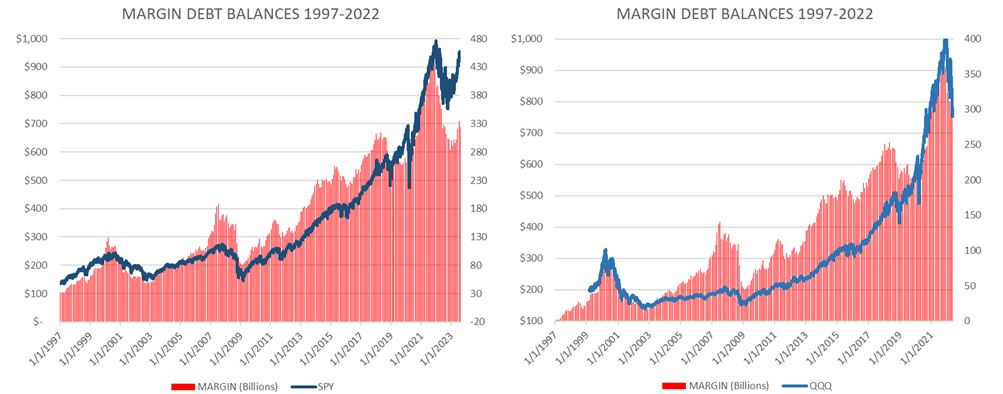
Remarkable, isn’t it? Now look at margin balances from 2020 to now:
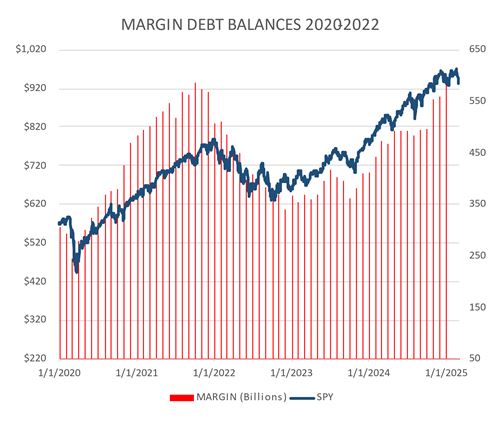
Graphs are for illustrative and discussion purposes only. Please read important disclosures at the end of this commentary.
As of January, there was $937 billion in margin balance vs. $702 billion a year ago – up 33%!
Today’s news reports may indeed sound concerning, but much of the collapse of capitalization you see is “forced-selling.” Leverage must come down and so the collapse becomes a self-fulfilling prophecy.
This must work its way through the system. But when will it end? Again, we use data for guidance.
The Big Money Index (BMI) is a great gauge of money flows. It fell from a local peak of 63.2, slicing through 45 to the latest reading of 35. On Monday, it will likely be lower; my guess is 34. I looked for when the same set-up happened in the past. Since 1990 it has happened 23 times. Here’s what I found:
- It took an average of 14.4 days to fall from 45 to oversold. That gives us a date of around March 25th when the BMI will go oversold.
- The market stayed oversold for an average of 13 days, meaning we should emerge from oversold on April 10th or so.
- The SPY had an average trough of -9.6% when the BMI fell from 45% through oversold to the BMI’s low.
- It took an average of 26 calendar days for the market to bottom after the BMI’s fall from 45% through oversold.
For context, the BMI fell from 45% on March 6th and SPY has fallen 5.4% since then. Put this together, and using history as a guide, I expect the market to go oversold on March 25th, fall an additional 4.1% to its trough which by the averages should happen on April 1st.
That may seem crazy to sit through and wait two weeks for a bottom, because – if we truly believe this will happen – why not sell now and run?
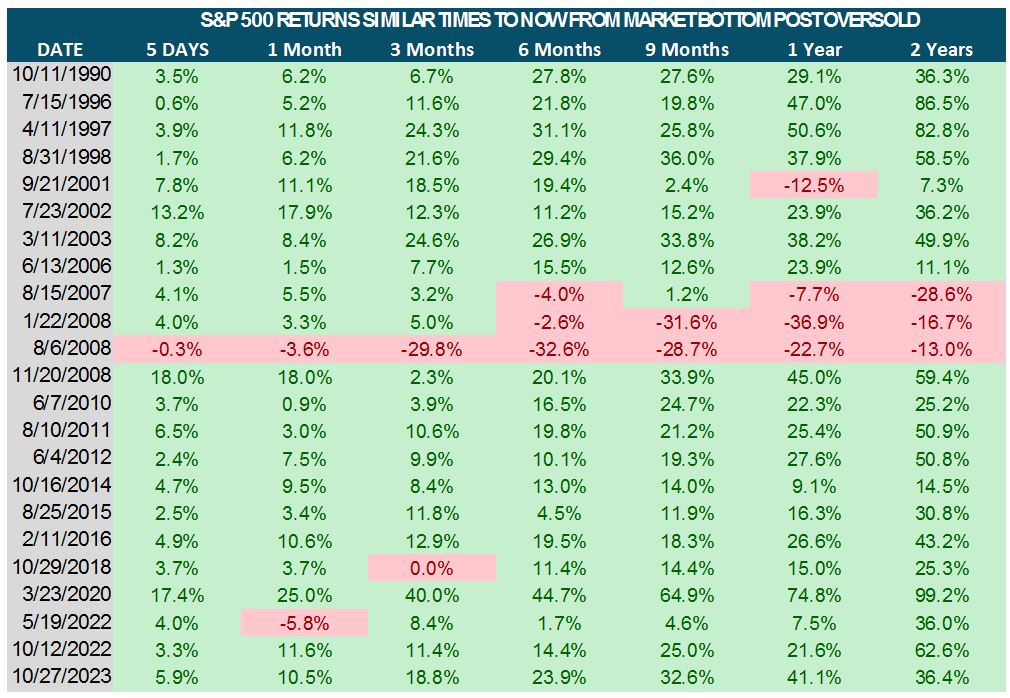
These are historical averages, not guarantees, but the most important reason to stay invested is your returns once the market finally bottoms are spectacular and can happen quickly. When the 2020 market hit bottom, the SPY rose 20% in three days! The 23 similar times since 1990 show this trend is consistent.

Graphs are for illustrative and discussion purposes only. Please read important disclosures at the end of this commentary.
As you can see, from this table, the Great Financial Crisis of 2008-09 weighs down this rare gift of a signal, so keep in mind that the average returns above include the Internet Bubble, 9/11, The Great Financial Crisis, and COVID-19. I think we can all agree that trade fears are not as bad as those crises.
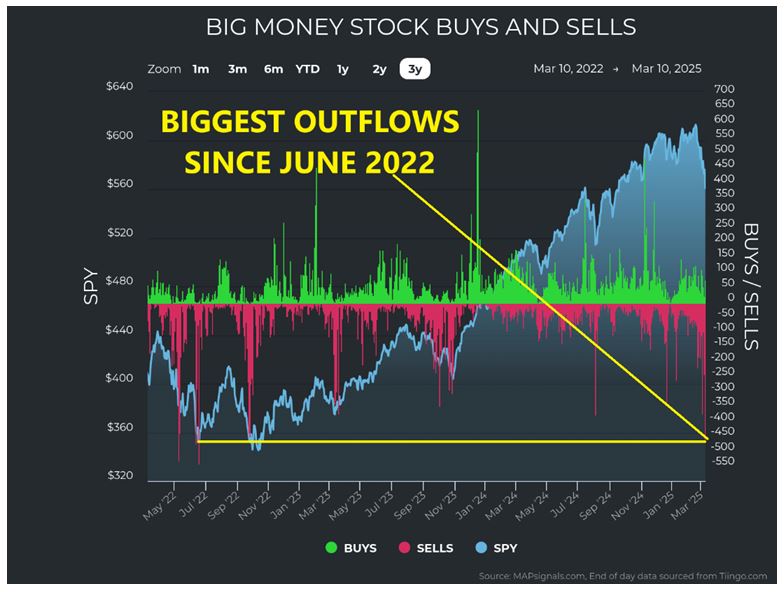
Last Thursday, March 13, felt like a bottom, as my data showed 464 outflows, meaning 464 stocks and ETFs were sold through lower lows on large volumes. This is the largest day of outflows since June 2022.
Graphs are for illustrative and discussion purposes only. Please read important disclosures at the end of this commentary.
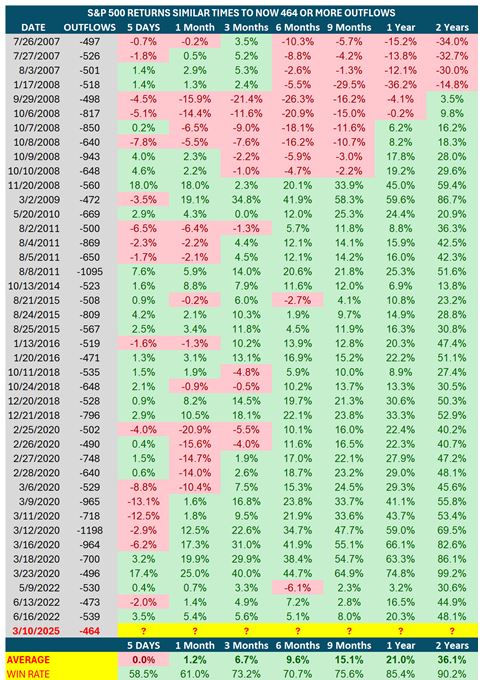
This was the 42nd instance of this happening since 1990. Keep in mind that prior to 2007, when this registered for the first time, volumes overall were lower and there were fewer stocks, meaning it was hard to register 464 outflows, so it didn’t happen often! It has happened only 41 times since 1990.
Since 2009, in such cases, stocks have risen 100% of the time 9-, 12-, and 24-months later…
Graphs are for illustrative and discussion purposes only. Please read important disclosures at the end of this commentary.
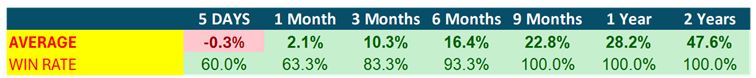
Clearly data was skewed by 2008-09, so let’s remove action prior to 2009. The 30 results look like this:
Here are additional studies which show that good times likely lay ahead:
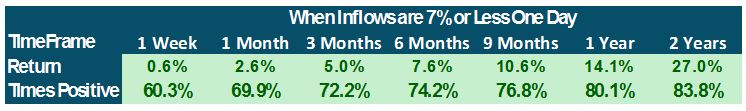
Monday March 4th saw only 6.5% inflows. That happened 335 times. In addition, that same day saw 374 outflows, plus 1,674 outflows in the previous eight days, and the S&P fell 6% in the previous six days.
Let’s take those events one at a time and see what the market did next, first when inflows are under 7%:
The market saw 374 or more outflows, 76 times since 1990:

There have been 1674 or more outflows within eight days, 177 times since 1990:

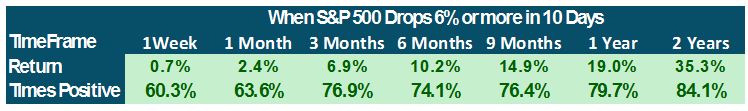
And the S&P 500 has dropped 6% within 10 days, 247 times since 1990:
Graphs are for illustrative and discussion purposes only. Please read important disclosures at the end of this commentary.
History is pretty clear – that when markets go down a lot, they most often tend to recover.
Personally, I don’t think we are headed for long-term recession, but even if we are, we can handle it.
Warren Buffett’s partner Charlie Munger, who recently died just short of age 100, said: “If I can be optimistic when I’m nearly dead, surely the rest of you can handle a little inflation.” Fair enough.
The play is to get a shopping list ready of the highest quality stocks being thrown out with the bathwater. Their time to shine again will come soon.
According to my data, not long after April 1st!
Volatility is no fun, but it is part of the investing game.
Look beyond the moment, beyond the daily noise.
All content above represents the opinion of Jason Bodner of Navellier & Associates, Inc.
Also In This Issue
A Look Ahead by Louis Navellier
Inflation Remains Flat, Despite Tariff Threats
Income Mail by Bryan Perry
Rotation Into Defensive Dividend Stocks Warranted
Growth Mail by Gary Alexander
Beware the Ides of March … What? Again?
Global Mail by Ivan Martchev
The VIX Says Buy Stocks
Sector Spotlight by Jason Bodner
When (Precisely) Will This Market Stop Collapsing?
View Full Archive
Read Past Issues Here

Jason Bodner
MARKETMAIL EDITOR FOR SECTOR SPOTLIGHT
Jason Bodner writes Sector Spotlight in the weekly Marketmail publication and has authored several white papers for the company. He is also Co-Founder of Macro Analytics for Professionals which produces proprietary equity accumulation and distribution research for its clients. Previously, Mr. Bodner served as Director of European Equity Derivatives for Cantor Fitzgerald Europe in London, then moved to the role of Head of Equity Derivatives North America for the same company in New York. He also served as S.V.P. Equity Derivatives for Jefferies, LLC. He received a B.S. in business administration in 1996, with honors, from Skidmore College as a member of the Periclean Honors Society. All content of “Sector Spotlight” represents the opinion of Jason Bodner
Important Disclosures:
Jason Bodner is a co-founder and co-owner of Mapsignals. Mr. Bodner is an independent contractor who is occasionally hired by Navellier & Associates to write an article and or provide opinions for possible use in articles that appear in Navellier & Associates weekly Market Mail. Mr. Bodner is not employed or affiliated with Louis Navellier, Navellier & Associates, Inc., or any other Navellier owned entity. The opinions and statements made here are those of Mr. Bodner and not necessarily those of any other persons or entities. This is not an endorsement, or solicitation or testimonial or investment advice regarding the BMI Index or any statements or recommendations or analysis in the article or the BMI Index or Mapsignals or its products or strategies.
Although information in these reports has been obtained from and is based upon sources that Navellier believes to be reliable, Navellier does not guarantee its accuracy and it may be incomplete or condensed. All opinions and estimates constitute Navellier’s judgment as of the date the report was created and are subject to change without notice. These reports are for informational purposes only and are not a solicitation for the purchase or sale of a security. Any decision to purchase securities mentioned in these reports must take into account existing public information on such securities or any registered prospectus.To the extent permitted by law, neither Navellier & Associates, Inc., nor any of its affiliates, agents, or service providers assumes any liability or responsibility nor owes any duty of care for any consequences of any person acting or refraining to act in reliance on the information contained in this communication or for any decision based on it.
Past performance is no indication of future results. Investment in securities involves significant risk and has the potential for partial or complete loss of funds invested. It should not be assumed that any securities recommendations made by Navellier. in the future will be profitable or equal the performance of securities made in this report. Dividend payments are not guaranteed. The amount of a dividend payment, if any, can vary over time and issuers may reduce dividends paid on securities in the event of a recession or adverse event affecting a specific industry or issuer.
None of the stock information, data, and company information presented herein constitutes a recommendation by Navellier or a solicitation to buy or sell any securities. Any specific securities identified and described do not represent all of the securities purchased, sold, or recommended for advisory clients. The holdings identified do not represent all of the securities purchased, sold, or recommended for advisory clients and the reader should not assume that investments in the securities identified and discussed were or will be profitable.
Information presented is general information that does not take into account your individual circumstances, financial situation, or needs, nor does it present a personalized recommendation to you. Individual stocks presented may not be suitable for every investor. Investment in securities involves significant risk and has the potential for partial or complete loss of funds invested. Investment in fixed income securities has the potential for the investment return and principal value of an investment to fluctuate so that an investor’s holdings, when redeemed, may be worth less than their original cost.
One cannot invest directly in an index. Index is unmanaged and index performance does not reflect deduction of fees, expenses, or taxes. Presentation of Index data does not reflect a belief by Navellier that any stock index constitutes an investment alternative to any Navellier equity strategy or is necessarily comparable to such strategies. Among the most important differences between the Indices and Navellier strategies are that the Navellier equity strategies may (1) incur material management fees, (2) concentrate its investments in relatively few stocks, industries, or sectors, (3) have significantly greater trading activity and related costs, and (4) be significantly more or less volatile than the Indices.
ETF Risk: We may invest in exchange traded funds (“ETFs”) and some of our investment strategies are generally fully invested in ETFs. Like traditional mutual funds, ETFs charge asset-based fees, but they generally do not charge initial sales charges or redemption fees and investors typically pay only customary brokerage fees to buy and sell ETF shares. The fees and costs charged by ETFs held in client accounts will not be deducted from the compensation the client pays Navellier. ETF prices can fluctuate up or down, and a client account could lose money investing in an ETF if the prices of the securities owned by the ETF go down. ETFs are subject to additional risks:
- ETF shares may trade above or below their net asset value;
- An active trading market for an ETF’s shares may not develop or be maintained;
- The value of an ETF may be more volatile than the underlying portfolio of securities the ETF is designed to track;
- The cost of owning shares of the ETF may exceed those a client would incur by directly investing in the underlying securities and;
- Trading of an ETF’s shares may be halted if the listing exchange’s officials deem it appropriate, the shares are delisted from the exchange, or the activation of market-wide “circuit breakers” (which are tied to large decreases in stock prices) halts stock trading generally.
Grader Disclosures: Investment in equity strategies involves substantial risk and has the potential for partial or complete loss of funds invested. The sample portfolio and any accompanying charts are for informational purposes only and are not to be construed as a solicitation to buy or sell any financial instrument and should not be relied upon as the sole factor in an investment making decision. As a matter of normal and important disclosures to you, as a potential investor, please consider the following: The performance presented is not based on any actual securities trading, portfolio, or accounts, and the reported performance of the A, B, C, D, and F portfolios (collectively the “model portfolios”) should be considered mere “paper” or pro forma performance results based on Navellier’s research.
Investors evaluating any of Navellier & Associates, Inc.’s, (or its affiliates’) Investment Products must not use any information presented here, including the performance figures of the model portfolios, in their evaluation of any Navellier Investment Products. Navellier Investment Products include the firm’s mutual funds and managed accounts. The model portfolios, charts, and other information presented do not represent actual funded trades and are not actual funded portfolios. There are material differences between Navellier Investment Products’ portfolios and the model portfolios, research, and performance figures presented here. The model portfolios and the research results (1) may contain stocks or ETFs that are illiquid and difficult to trade; (2) may contain stock or ETF holdings materially different from actual funded Navellier Investment Product portfolios; (3) include the reinvestment of all dividends and other earnings, estimated trading costs, commissions, or management fees; and, (4) may not reflect prices obtained in an actual funded Navellier Investment Product portfolio. For these and other reasons, the reported performances of model portfolios do not reflect the performance results of Navellier’s actually funded and traded Investment Products. In most cases, Navellier’s Investment Products have materially lower performance results than the performances of the model portfolios presented.
This report contains statements that are, or may be considered to be, forward-looking statements. All statements that are not historical facts, including statements about our beliefs or expectations, are “forward-looking statements” within the meaning of The U.S. Private Securities Litigation Reform Act of 1995. These statements may be identified by such forward-looking terminology as “expect,” “estimate,” “plan,” “intend,” “believe,” “anticipate,” “may,” “will,” “should,” “could,” “continue,” “project,” or similar statements or variations of such terms. Our forward-looking statements are based on a series of expectations, assumptions, and projections, are not guarantees of future results or performance, and involve substantial risks and uncertainty as described in Form ADV Part 2A of our filing with the Securities and Exchange Commission (SEC), which is available at www.adviserinfo.sec.gov or by requesting a copy by emailing info@navellier.com. All of our forward-looking statements are as of the date of this report only. We can give no assurance that such expectations or forward-looking statements will prove to be correct. Actual results may differ materially. You are urged to carefully consider all such factors.
FEDERAL TAX ADVICE DISCLAIMER: As required by U.S. Treasury Regulations, you are informed that, to the extent this presentation includes any federal tax advice, the presentation is not written by Navellier to be used, and cannot be used, for the purpose of avoiding federal tax penalties. Navellier does not advise on any income tax requirements or issues. Use of any information presented by Navellier is for general information only and does not represent tax advice either express or implied. You are encouraged to seek professional tax advice for income tax questions and assistance.
IMPORTANT NEWSLETTER DISCLOSURE:The hypothetical performance results for investment newsletters that are authored or edited by Louis Navellier, including Louis Navellier’s Growth Investor, Louis Navellier’s Breakthrough Stocks, Louis Navellier’s Accelerated Profits, and Louis Navellier’s Platinum Club, are not based on any actual securities trading, portfolio, or accounts, and the newsletters’ reported hypothetical performances should be considered mere “paper” or proforma hypothetical performance results and are not actual performance of real world trades. Navellier & Associates, Inc. does not have any relation to or affiliation with the owner of these newsletters. There are material differences between Navellier Investment Products’ portfolios and the InvestorPlace Media, LLC newsletter portfolios authored by Louis Navellier. The InvestorPlace Media, LLC newsletters contain hypothetical performance that do not include transaction costs, advisory fees, or other fees a client might incur if actual investments and trades were being made by an investor. As a result, newsletter performance should not be used to evaluate Navellier Investment services which are separate and different from the newsletters. The owner of the newsletters is InvestorPlace Media, LLC and any questions concerning the newsletters, including any newsletter advertising or hypothetical Newsletter performance claims, (which are calculated solely by Investor Place Media and not Navellier) should be referred to InvestorPlace Media, LLC at (800) 718-8289.
Please note that Navellier & Associates and the Navellier Private Client Group are managed completely independent of the newsletters owned and published by InvestorPlace Media, LLC and written and edited by Louis Navellier, and investment performance of the newsletters should in no way be considered indicative of potential future investment performance for any Navellier & Associates separately managed account portfolio. Potential investors should consult with their financial advisor before investing in any Navellier Investment Product.
Navellier claims compliance with Global Investment Performance Standards (GIPS). To receive a complete list and descriptions of Navellier’s composites and/or a presentation that adheres to the GIPS standards, please contact Navellier or click here. It should not be assumed that any securities recommendations made by Navellier & Associates, Inc. in the future will be profitable or equal the performance of securities made in this report.
FactSet Disclosure: Navellier does not independently calculate the statistical information included in the attached report. The calculation and the information are provided by FactSet, a company not related to Navellier. Although information contained in the report has been obtained from FactSet and is based on sources Navellier believes to be reliable, Navellier does not guarantee its accuracy, and it may be incomplete or condensed. The report and the related FactSet sourced information are provided on an “as is” basis. The user assumes the entire risk of any use made of this information. Investors should consider the report as only a single factor in making their investment decision. The report is for informational purposes only and is not intended as an offer or solicitation for the purchase or sale of a security. FactSet sourced information is the exclusive property of FactSet. Without prior written permission of FactSet, this information may not be reproduced, disseminated or used to create any financial products. All indices are unmanaged and performance of the indices include reinvestment of dividends and interest income, unless otherwise noted, are not illustrative of any particular investment and an investment cannot be made in any index. Past performance is no guarantee of future results.