by Ivan Martchev
March 18, 2025
I think the recent decline in the stock market is primarily rotational in nature, and the tariff threats by the Trump administration are mostly just an excuse for this rotation. However, President Trump would be well served to learn a phrase from one of his famous predecessors: “Speak softly and carry a big stick.”
Theodore Roosevelt used that foreign policy approach, and President Trump might achieve more by adopting it and not by scaring investors while shooting himself in the foot. I have my doubts as to whether he can change, given his behavior in his first term as president, but toning it down just a little may help. The minute he gets some wins in his drug-and-trade war, people might view tariffs differently.
Graphs are for illustrative and discussion purposes only. Please read important disclosures at the end of this commentary.
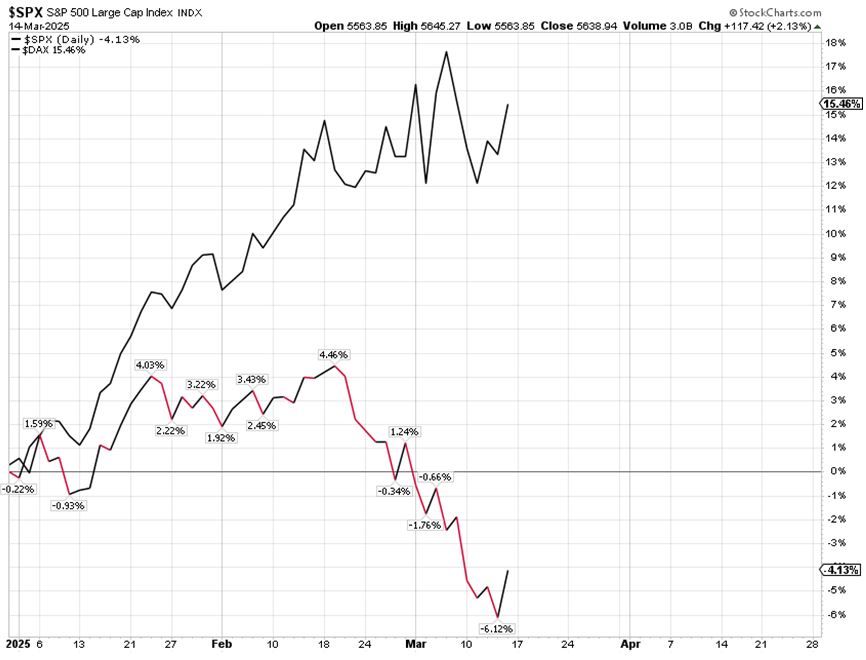
As for the recent stock rotation, the most important stock market in the EU is Germany, and that market is benefitting from a potential end of the war in Ukraine and a new German government that will soon take over, led by the CDU (a more competent political party, in my view) with a huge stimulus spending plan in the works. We will all be very happy if the German economy improves, but they have more to lose in a trade war than the U.S., as it is an export-driven country, and the U.S. is its largest export destination.
I think the U.S. market got extended to an all-time high relative to the rest of the world in terms of market capitalization and the violent rotation into Europe and many emerging markets caused this sharp sell-off.
Graphs are for illustrative and discussion purposes only. Please read important disclosures at the end of this commentary.
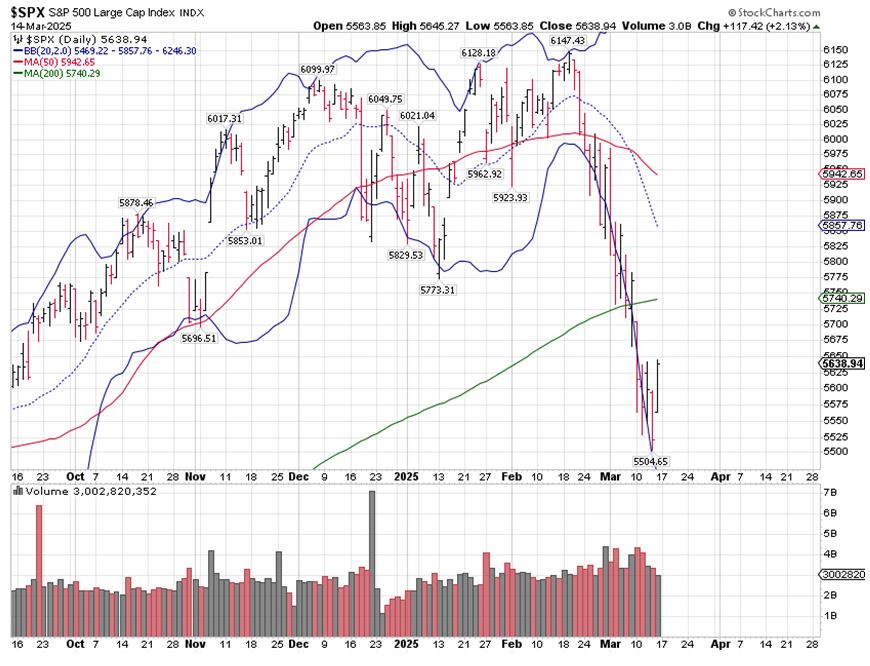
From a statistical perspective, this type of selling right after an all-time high is rare. Every single day for three weeks (except last Friday), the daily range of the S&P 500 touched or went outside the lower Bollinger band, which is set at two standard deviations away from the 20-day moving average (the dotted middle band, above). That’s 14 trading days – regardless of Presidential tweets, good economic statistics or any other kind of news. I suspect computerized trading – as computers don’t care about any of that.
Statistically, this type of action is extreme and typically comes at the end of a bear market in a waterfall sell-off and not right after an all-time high. A simple reflexive rebound to the 20-day moving average would wipe out half the decline. I think the chances that we get this rebound in the next two weeks are much better than 75%. I would say even higher, but I cannot predict Presidential tweets and geopolitical events that can come out of left field. In fact, 5800-5850 by the end of March would be a good target, or even higher based on Trump’s tweets, (lower if he starts tweeting aggressively in the middle of the night).
Graphs are for illustrative and discussion purposes only. Please read important disclosures at the end of this commentary.
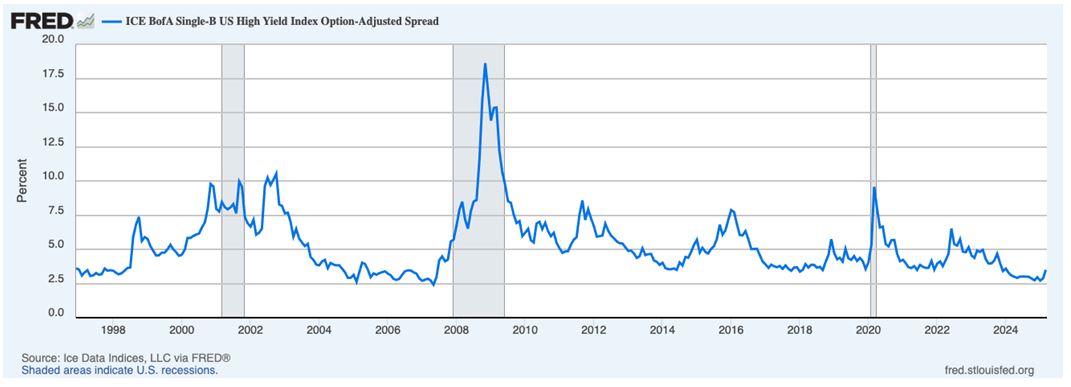
Furthermore, risky bonds or junk bonds are going well. There is some weakening in the junk bond market, but nothing like the weakening before a recession. Note: COVID was a government-mandated shutdown because of a pandemic and not a normal recession. We have had junk bond spreads at much higher levels in 2012, 2016 and 2022 without a recession, and their recent reading at 350 basis points over Treasuries is “inside 400,” which is a bond trader’s term for a relatively strong junk bond market.
Junk bonds are correlated with stocks, and right now junk bonds do not see what the stock market is seeing. Could it be that the stock market is hallucinating? It sure could.
Graphs are for illustrative and discussion purposes only. Please read important disclosures at the end of this commentary.
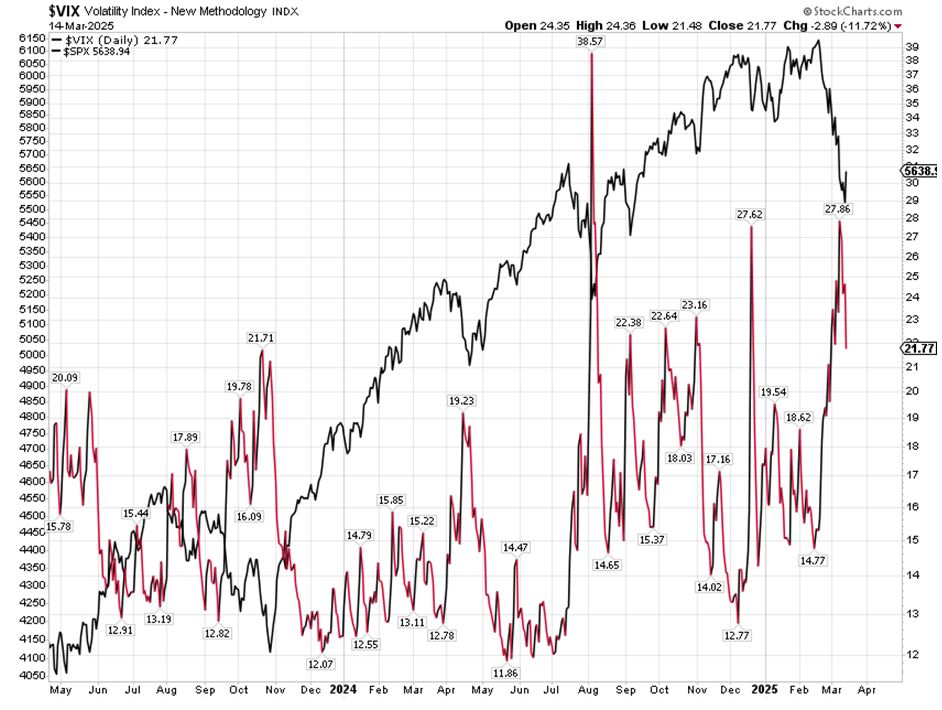
In addition to the extreme nature of the sell-off, we have an intermediate-term buy signal from the fear gauge index called the VIX, which measures implied volatility in index options. The VIX had not one but two double-digit percentage declines last week – one was -9.99% (in my book that counts as double-digit) earlier and one of -11.72% on Friday. These types of declines in the VIX after this type of sell-off would easily signify a 5% up-move in the S&P 500 in 2-4 weeks (it could be bigger). In fact, the chances that the S&P 500 makes an all-time high in the second quarter are better than ever, in my view, but I would caution that this is contingent on some wins in President Trump’s trade war, which I expect to see.
P.S., A closing note to Mr. Trump: Please read up on Teddy Roosevelt. It is in everyone’s best interest.
All content above represents the opinion of Ivan Martchev of Navellier & Associates, Inc.
Also In This Issue
A Look Ahead by Louis Navellier
Inflation Remains Flat, Despite Tariff Threats
Income Mail by Bryan Perry
Rotation Into Defensive Dividend Stocks Warranted
Growth Mail by Gary Alexander
Beware the Ides of March … What? Again?
Global Mail by Ivan Martchev
The VIX Says Buy Stocks
Sector Spotlight by Jason Bodner
When (Precisely) Will This Market Stop Collapsing?
View Full Archive
Read Past Issues Here

Ivan Martchev
INVESTMENT STRATEGIST
Ivan Martchev is an investment strategist with Navellier. Previously, Ivan served as editorial director at InvestorPlace Media. Ivan was editor of Louis Rukeyser’s Mutual Funds and associate editor of Personal Finance. Ivan is also co-author of The Silk Road to Riches (Financial Times Press). The book provided analysis of geopolitical issues and investment strategy in natural resources and emerging markets with an emphasis on Asia. The book also correctly predicted the collapse in the U.S. real estate market, the rise of precious metals, and the resulting increased investor interest in emerging markets. Ivan’s commentaries have been published by MSNBC, The Motley Fool, MarketWatch, and others. All content of “Global Mail” represents the opinion of Ivan Martchev
Important Disclosures:
Although information in these reports has been obtained from and is based upon sources that Navellier believes to be reliable, Navellier does not guarantee its accuracy and it may be incomplete or condensed. All opinions and estimates constitute Navellier’s judgment as of the date the report was created and are subject to change without notice. These reports are for informational purposes only and are not a solicitation for the purchase or sale of a security. Any decision to purchase securities mentioned in these reports must take into account existing public information on such securities or any registered prospectus.To the extent permitted by law, neither Navellier & Associates, Inc., nor any of its affiliates, agents, or service providers assumes any liability or responsibility nor owes any duty of care for any consequences of any person acting or refraining to act in reliance on the information contained in this communication or for any decision based on it.
Past performance is no indication of future results. Investment in securities involves significant risk and has the potential for partial or complete loss of funds invested. It should not be assumed that any securities recommendations made by Navellier. in the future will be profitable or equal the performance of securities made in this report. Dividend payments are not guaranteed. The amount of a dividend payment, if any, can vary over time and issuers may reduce dividends paid on securities in the event of a recession or adverse event affecting a specific industry or issuer.
None of the stock information, data, and company information presented herein constitutes a recommendation by Navellier or a solicitation to buy or sell any securities. Any specific securities identified and described do not represent all of the securities purchased, sold, or recommended for advisory clients. The holdings identified do not represent all of the securities purchased, sold, or recommended for advisory clients and the reader should not assume that investments in the securities identified and discussed were or will be profitable.
Information presented is general information that does not take into account your individual circumstances, financial situation, or needs, nor does it present a personalized recommendation to you. Individual stocks presented may not be suitable for every investor. Investment in securities involves significant risk and has the potential for partial or complete loss of funds invested. Investment in fixed income securities has the potential for the investment return and principal value of an investment to fluctuate so that an investor’s holdings, when redeemed, may be worth less than their original cost.
One cannot invest directly in an index. Index is unmanaged and index performance does not reflect deduction of fees, expenses, or taxes. Presentation of Index data does not reflect a belief by Navellier that any stock index constitutes an investment alternative to any Navellier equity strategy or is necessarily comparable to such strategies. Among the most important differences between the Indices and Navellier strategies are that the Navellier equity strategies may (1) incur material management fees, (2) concentrate its investments in relatively few stocks, industries, or sectors, (3) have significantly greater trading activity and related costs, and (4) be significantly more or less volatile than the Indices.
ETF Risk: We may invest in exchange traded funds (“ETFs”) and some of our investment strategies are generally fully invested in ETFs. Like traditional mutual funds, ETFs charge asset-based fees, but they generally do not charge initial sales charges or redemption fees and investors typically pay only customary brokerage fees to buy and sell ETF shares. The fees and costs charged by ETFs held in client accounts will not be deducted from the compensation the client pays Navellier. ETF prices can fluctuate up or down, and a client account could lose money investing in an ETF if the prices of the securities owned by the ETF go down. ETFs are subject to additional risks:
- ETF shares may trade above or below their net asset value;
- An active trading market for an ETF’s shares may not develop or be maintained;
- The value of an ETF may be more volatile than the underlying portfolio of securities the ETF is designed to track;
- The cost of owning shares of the ETF may exceed those a client would incur by directly investing in the underlying securities; and
- Trading of an ETF’s shares may be halted if the listing exchange’s officials deem it appropriate, the shares are delisted from the exchange, or the activation of market-wide “circuit breakers” (which are tied to large decreases in stock prices) halts stock trading generally.
Grader Disclosures: Investment in equity strategies involves substantial risk and has the potential for partial or complete loss of funds invested. The sample portfolio and any accompanying charts are for informational purposes only and are not to be construed as a solicitation to buy or sell any financial instrument and should not be relied upon as the sole factor in an investment making decision. As a matter of normal and important disclosures to you, as a potential investor, please consider the following: The performance presented is not based on any actual securities trading, portfolio, or accounts, and the reported performance of the A, B, C, D, and F portfolios (collectively the “model portfolios”) should be considered mere “paper” or pro forma performance results based on Navellier’s research.
Investors evaluating any of Navellier & Associates, Inc.’s, (or its affiliates’) Investment Products must not use any information presented here, including the performance figures of the model portfolios, in their evaluation of any Navellier Investment Products. Navellier Investment Products include the firm’s mutual funds and managed accounts. The model portfolios, charts, and other information presented do not represent actual funded trades and are not actual funded portfolios. There are material differences between Navellier Investment Products’ portfolios and the model portfolios, research, and performance figures presented here. The model portfolios and the research results (1) may contain stocks or ETFs that are illiquid and difficult to trade; (2) may contain stock or ETF holdings materially different from actual funded Navellier Investment Product portfolios; (3) include the reinvestment of all dividends and other earnings, estimated trading costs, commissions, or management fees; and, (4) may not reflect prices obtained in an actual funded Navellier Investment Product portfolio. For these and other reasons, the reported performances of model portfolios do not reflect the performance results of Navellier’s actually funded and traded Investment Products. In most cases, Navellier’s Investment Products have materially lower performance results than the performances of the model portfolios presented.
This report contains statements that are, or may be considered to be, forward-looking statements. All statements that are not historical facts, including statements about our beliefs or expectations, are “forward-looking statements” within the meaning of The U.S. Private Securities Litigation Reform Act of 1995. These statements may be identified by such forward-looking terminology as “expect,” “estimate,” “plan,” “intend,” “believe,” “anticipate,” “may,” “will,” “should,” “could,” “continue,” “project,” or similar statements or variations of such terms. Our forward-looking statements are based on a series of expectations, assumptions, and projections, are not guarantees of future results or performance, and involve substantial risks and uncertainty as described in Form ADV Part 2A of our filing with the Securities and Exchange Commission (SEC), which is available at www.adviserinfo.sec.gov or by requesting a copy by emailing info@navellier.com. All of our forward-looking statements are as of the date of this report only. We can give no assurance that such expectations or forward-looking statements will prove to be correct. Actual results may differ materially. You are urged to carefully consider all such factors.
FEDERAL TAX ADVICE DISCLAIMER: As required by U.S. Treasury Regulations, you are informed that, to the extent this presentation includes any federal tax advice, the presentation is not written by Navellier to be used, and cannot be used, for the purpose of avoiding federal tax penalties. Navellier does not advise on any income tax requirements or issues. Use of any information presented by Navellier is for general information only and does not represent tax advice either express or implied. You are encouraged to seek professional tax advice for income tax questions and assistance.
IMPORTANT NEWSLETTER DISCLOSURE:The hypothetical performance results for investment newsletters that are authored or edited by Louis Navellier, including Louis Navellier’s Growth Investor, Louis Navellier’s Breakthrough Stocks, Louis Navellier’s Accelerated Profits, and Louis Navellier’s Platinum Club, are not based on any actual securities trading, portfolio, or accounts, and the newsletters’ reported hypothetical performances should be considered mere “paper” or proforma hypothetical performance results and are not actual performance of real world trades. Navellier & Associates, Inc. does not have any relation to or affiliation with the owner of these newsletters. There are material differences between Navellier Investment Products’ portfolios and the InvestorPlace Media, LLC newsletter portfolios authored by Louis Navellier. The InvestorPlace Media, LLC newsletters contain hypothetical performance that do not include transaction costs, advisory fees, or other fees a client might incur if actual investments and trades were being made by an investor. As a result, newsletter performance should not be used to evaluate Navellier Investment services which are separate and different from the newsletters. The owner of the newsletters is InvestorPlace Media, LLC and any questions concerning the newsletters, including any newsletter advertising or hypothetical Newsletter performance claims, (which are calculated solely by Investor Place Media and not Navellier) should be referred to InvestorPlace Media, LLC at (800) 718-8289.
Please note that Navellier & Associates and the Navellier Private Client Group are managed completely independent of the newsletters owned and published by InvestorPlace Media, LLC and written and edited by Louis Navellier, and investment performance of the newsletters should in no way be considered indicative of potential future investment performance for any Navellier & Associates separately managed account portfolio. Potential investors should consult with their financial advisor before investing in any Navellier Investment Product.
Navellier claims compliance with Global Investment Performance Standards (GIPS). To receive a complete list and descriptions of Navellier’s composites and/or a presentation that adheres to the GIPS standards, please contact Navellier or click here. It should not be assumed that any securities recommendations made by Navellier & Associates, Inc. in the future will be profitable or equal the performance of securities made in this report.
FactSet Disclosure: Navellier does not independently calculate the statistical information included in the attached report. The calculation and the information are provided by FactSet, a company not related to Navellier. Although information contained in the report has been obtained from FactSet and is based on sources Navellier believes to be reliable, Navellier does not guarantee its accuracy, and it may be incomplete or condensed. The report and the related FactSet sourced information are provided on an “as is” basis. The user assumes the entire risk of any use made of this information. Investors should consider the report as only a single factor in making their investment decision. The report is for informational purposes only and is not intended as an offer or solicitation for the purchase or sale of a security. FactSet sourced information is the exclusive property of FactSet. Without prior written permission of FactSet, this information may not be reproduced, disseminated or used to create any financial products. All indices are unmanaged and performance of the indices include reinvestment of dividends and interest income, unless otherwise noted, are not illustrative of any particular investment and an investment cannot be made in any index. Past performance is no guarantee of future results.