by Gary Alexander
March 18, 2025
The week of March 16-20, 2020, brought us the COVID lock-down five years ago. The Fed began the week with an emergency Sunday night meeting and a full 1% rate cut, but that didn’t keep the Dow from falling 3,000 points (-13%) on Monday, March 16, with record-high volatility (an 82.69 VIX reading), as state after state announced lock-downs. The S&P fell 35% from February 19 to March 23 – dates that are eerily familiar to this year, when the S&P peaked on February 19th and was off over 10% by March 13th.
In both 2020 and 2025, President’s Day fell on February 17, and the S&P 500 peaked two days later:
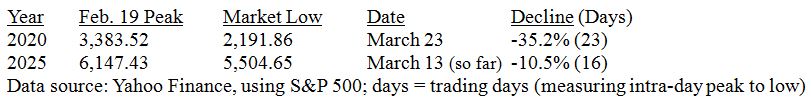
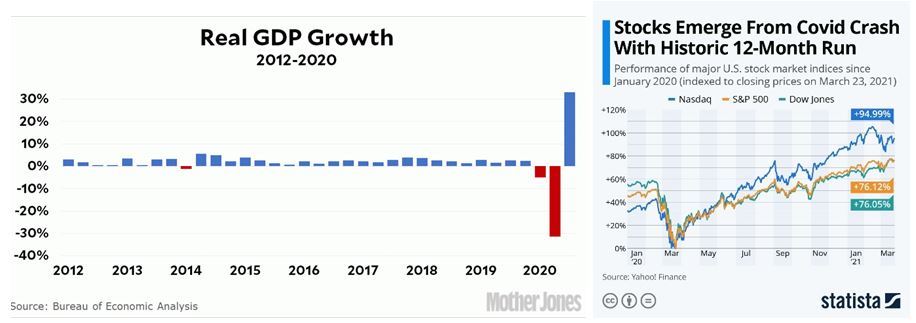
More lows are likely to come this March, but the untold COVID story is that the March market panic only lasted 23 trading days (33 calendar days), and the recovery was extremely V-shaped, with a 20% rise in just three DAYS, March 23-26, reaching old highs by August. GDP also bounced back in ultra-V-shape:
Graphs are for illustrative and discussion purposes only. Please read important disclosures at the end of this commentary.
COVID was real, and it impacted the whole world. In America, according to the U.S. Bureau of Labor Statistics, non-farm payroll employment in the United States declined by 9.4 million in 2020, the largest calendar-year decline in history, most of it due to forced closing of up to 40% of small businesses in the second quarter, of which 30% remained partly closed for most of the year. Despite that, our GDP and stock market soared in the second half of 2020. But now, the press is ginning up COVID-level panic over a few tit-for-tat trade tiffs and a few thousand job cuts in Washington, DC. It makes you wonder if the most contagious disease isn’t carried through breath or touch but through the press and internet panics.
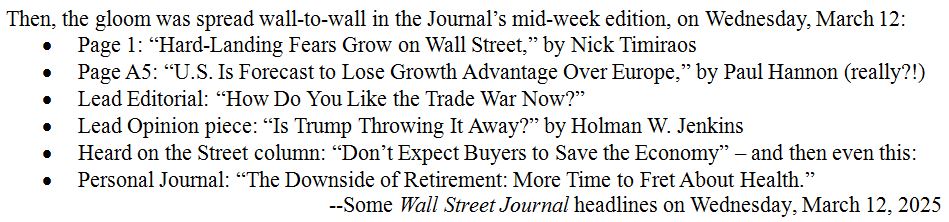
The press drumbeat has been brutal during this correction. Even the staid Wall Street Journal joined this negative chorus on March 10 with this headline: “The Mounting Case Against U.S. Stocks: Worries about a trade war, signs of flagging growth and splinters in the AI trade are pressuring U.S. shares.” Sure enough, the next day, the Journal’s headline was “NASDAQ Has Worst Day Since 2022,” down 4%. Also on Tuesday came this lead Journal editorial: “Will There be a Trump Recession?” and an Op-Ed: “The Trade War Pounds Stocks,” by Greg Jensen, co-chief investment officer at Bridgewater Associates.
So, we are to believe that consumers will not spend, the U.S. will go the way of Europe – or worse, be eclipsed by the slowest-growing continent on earth – and Trump killed global growth in just six weeks.
Fortunately, I just finished reading Nate Silver’s 2012 book, “The Signal and the Noise,” which highlights the fact that most of us get hooked on the daily noise that assaults us, mostly on TV cable talk shows, on the internet and on our increasingly stupid “smart” phones that memorize our biases and then feed them.
Ed Yardeni wrote in last Monday Morning’s briefing that “The economy’s noise-to-signal ratio (NTSR) has been rising rapidly in recent weeks. As a result, it has gotten harder to get a read on the economy lately. Washington’s rapidly increasing NTSR is also troubling.” He then referred to a previous Briefing (March 5th), titled “Trump Turmoil Raises Odds of a Recession,” about Trump tweets that torpedo stocks.
President Trump doesn’t put much of a guard rail on what he says, or how he impacts the market, so he can push stocks down a lot faster than previous presidents, but investors must also share the blame by being so easily manipulated – and impatient. When it comes to tariffs, the world’s trade system has needed rebalancing for a long time, at least since 1990, when the Cold War ended, but no recent president has addressed the problem. President Trump has stirred the pot and won’t rest until tariffs and trading fees are much lower across the board. Then we will all prosper. Investors can’t see that yet, so they panicked.
Likewise, the national debt has needed addressing for the 24 years since the last balanced budget in 2001, but none of the last four presidents (two of each party) or 12 Congresses (also evenly balanced) have even begun to address cost cutting, so Trump and Musk jumped into the problem over-eagerly and the market is thrown into an added panic over a few thousand jobs lost, or redundant departments being closed.
This is short-sighted thinking by most pundits and investors, in my view, and this is why I read more history than daily news, and why I anticipate recoveries more than fearing recessions. Even if we have a short recession, so what? We had a humdinger of a recession five years ago, in the first half of 2020, but then we saw a soaring second half of 2020 and strong market gains over the last five years as well.
In Nate Silver’s book – as well as those by two great market analysts, Ed Yardeni, and Louis Navellier, in their books profiled below – we see the benefit of authors who experienced many up and down markets so they can separate true market signals from the noise. Ed Yardeni’s “Predicting the Markets” traces his career from his economic studies at Yale through his early Wall Street experiences to hanging out his own shingle. He includes an especially valuable survey of the meaning behind most key economic indicators.
Louis Navellier follows the same basic template of sharing his early background in computer crunching data at Cal State and the Federal Reserve, then sharing his findings in award-winning newsletters, testing a wide variety of market variables to discover the secret of finding market-beating stocks with low risk.

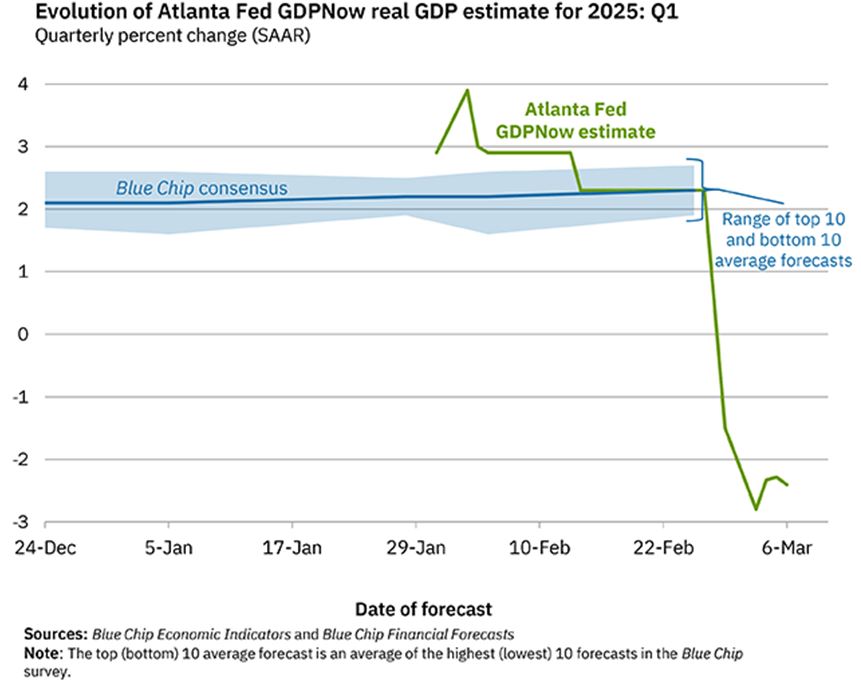
Even the Atlanta Fed’s GDPNow Model Has Broken Its Gears in a Panic Attack
During our longest bull market in history, from 2009 through 2020, economist Ed Yardeni counted 66 market “panic attacks” like we’re seeing now, many of which led to 10% or greater market corrections. That’s an average of one false panic every two months, the very definition of “noise” over knowledge.
And now, even the Atlanta Fed’s GDPNow model has panicked, blowing its gears with a record 5% GDP swing in their first-quarter GDP forecast in just five days. On Wednesday, February 26, their GDP model forecast a +2.3% gain. On Monday, March 3rd, just three business days later, their model forecast a -2.8% decline. An ocean liner can’t make a 180-degree turn within half a mile, and an economy can’t go from +2.3% to -2.8% for the same quarter within five days. The Atlanta team explained that the huge swan dive came from “a big jump in January imports,” led by a jump in gold imports on Friday, February 28. On the same Friday, January’s personal consumption declined 0.5%, but that explanation only reveals a flawed model. It takes human beings to interpret data so they won’t be jerked around by figures that can be easily explained by: (1) exporters dumping their goods before tariffs take effect, and (2) fires and bad weather.
Graphs are for illustrative and discussion purposes only. Please read important disclosures at the end of this commentary.
As for the surging gold imports – which rose from $13.2-billion in December to $32.6-billion in January –economists at the Atlanta Fed said that single data point accounted for about two percentage points in their 5-point downward revision, but that is a one-time technical problem within the London Bullion Market Association after Trump’s victory, anticipating more demand in gold in America in the Trump era, not a big factor in our GDP, but it accounted for nearly 60% of the widening of the goods trade deficit.
Once again, it’s time for some realism and historical perspective in our national economic reporting. A good place to start is in the three books pictured above, by three seasoned, market observers.
All content above represents the opinion of Gary Alexander of Navellier & Associates, Inc.
Also In This Issue
A Look Ahead by Louis Navellier
Inflation Remains Flat, Despite Tariff Threats
Income Mail by Bryan Perry
Rotation Into Defensive Dividend Stocks Warranted
Growth Mail by Gary Alexander
Beware the Ides of March … What? Again?
Global Mail by Ivan Martchev
The VIX Says Buy Stocks
Sector Spotlight by Jason Bodner
When (Precisely) Will This Market Stop Collapsing?
View Full Archive
Read Past Issues Here
About The Author

Gary Alexander
SENIOR EDITOR
Gary Alexander has been Senior Writer at Navellier since 2009. He edits Navellier’s weekly Marketmail and writes a weekly Growth Mail column, in which he uses market history to support the case for growth stocks. For the previous 20-years before joining Navellier, he was Senior Executive Editor at InvestorPlace Media (formerly Phillips Publishing), where he worked with several leading investment analysts, including Louis Navellier (since 1997), helping launch Louis Navellier’s Blue Chip Growth and Global Growth newsletters.
Prior to that, Gary edited Wealth Magazine and Gold Newsletter and wrote various investment research reports for Jefferson Financial in New Orleans in the 1980s. He began his financial newsletter career with KCI Communications in 1980, where he served as consulting editor for Personal Finance newsletter while serving as general manager of KCI’s Alexandria House book division. Before that, he covered the economics beat for news magazines. All content of “Growth Mail” represents the opinion of Gary Alexander
Important Disclosures:
Although information in these reports has been obtained from and is based upon sources that Navellier believes to be reliable, Navellier does not guarantee its accuracy and it may be incomplete or condensed. All opinions and estimates constitute Navellier’s judgment as of the date the report was created and are subject to change without notice. These reports are for informational purposes only and are not a solicitation for the purchase or sale of a security. Any decision to purchase securities mentioned in these reports must take into account existing public information on such securities or any registered prospectus.To the extent permitted by law, neither Navellier & Associates, Inc., nor any of its affiliates, agents, or service providers assumes any liability or responsibility nor owes any duty of care for any consequences of any person acting or refraining to act in reliance on the information contained in this communication or for any decision based on it.
Past performance is no indication of future results. Investment in securities involves significant risk and has the potential for partial or complete loss of funds invested. It should not be assumed that any securities recommendations made by Navellier. in the future will be profitable or equal the performance of securities made in this report. Dividend payments are not guaranteed. The amount of a dividend payment, if any, can vary over time and issuers may reduce dividends paid on securities in the event of a recession or adverse event affecting a specific industry or issuer.
None of the stock information, data, and company information presented herein constitutes a recommendation by Navellier or a solicitation to buy or sell any securities. Any specific securities identified and described do not represent all of the securities purchased, sold, or recommended for advisory clients. The holdings identified do not represent all of the securities purchased, sold, or recommended for advisory clients and the reader should not assume that investments in the securities identified and discussed were or will be profitable.
Information presented is general information that does not take into account your individual circumstances, financial situation, or needs, nor does it present a personalized recommendation to you. Individual stocks presented may not be suitable for every investor. Investment in securities involves significant risk and has the potential for partial or complete loss of funds invested. Investment in fixed income securities has the potential for the investment return and principal value of an investment to fluctuate so that an investor’s holdings, when redeemed, may be worth less than their original cost.
One cannot invest directly in an index. Index is unmanaged and index performance does not reflect deduction of fees, expenses, or taxes. Presentation of Index data does not reflect a belief by Navellier that any stock index constitutes an investment alternative to any Navellier equity strategy or is necessarily comparable to such strategies. Among the most important differences between the Indices and Navellier strategies are that the Navellier equity strategies may (1) incur material management fees, (2) concentrate its investments in relatively few stocks, industries, or sectors, (3) have significantly greater trading activity and related costs, and (4) be significantly more or less volatile than the Indices.
ETF Risk: We may invest in exchange traded funds (“ETFs”) and some of our investment strategies are generally fully invested in ETFs. Like traditional mutual funds, ETFs charge asset-based fees, but they generally do not charge initial sales charges or redemption fees and investors typically pay only customary brokerage fees to buy and sell ETF shares. The fees and costs charged by ETFs held in client accounts will not be deducted from the compensation the client pays Navellier. ETF prices can fluctuate up or down, and a client account could lose money investing in an ETF if the prices of the securities owned by the ETF go down. ETFs are subject to additional risks:
- ETF shares may trade above or below their net asset value;
- An active trading market for an ETF’s shares may not develop or be maintained;
- The value of an ETF may be more volatile than the underlying portfolio of securities the ETF is designed to track;
- The cost of owning shares of the ETF may exceed those a client would incur by directly investing in the underlying securities; and
- Trading of an ETF’s shares may be halted if the listing exchange’s officials deem it appropriate, the shares are delisted from the exchange, or the activation of market-wide “circuit breakers” (which are tied to large decreases in stock prices) halts stock trading generally.
Grader Disclosures: Investment in equity strategies involves substantial risk and has the potential for partial or complete loss of funds invested. The sample portfolio and any accompanying charts are for informational purposes only and are not to be construed as a solicitation to buy or sell any financial instrument and should not be relied upon as the sole factor in an investment making decision. As a matter of normal and important disclosures to you, as a potential investor, please consider the following: The performance presented is not based on any actual securities trading, portfolio, or accounts, and the reported performance of the A, B, C, D, and F portfolios (collectively the “model portfolios”) should be considered mere “paper” or pro forma performance results based on Navellier’s research.
Investors evaluating any of Navellier & Associates, Inc.’s, (or its affiliates’) Investment Products must not use any information presented here, including the performance figures of the model portfolios, in their evaluation of any Navellier Investment Products. Navellier Investment Products include the firm’s mutual funds and managed accounts. The model portfolios, charts, and other information presented do not represent actual funded trades and are not actual funded portfolios. There are material differences between Navellier Investment Products’ portfolios and the model portfolios, research, and performance figures presented here. The model portfolios and the research results (1) may contain stocks or ETFs that are illiquid and difficult to trade; (2) may contain stock or ETF holdings materially different from actual funded Navellier Investment Product portfolios; (3) include the reinvestment of all dividends and other earnings, estimated trading costs, commissions, or management fees; and, (4) may not reflect prices obtained in an actual funded Navellier Investment Product portfolio. For these and other reasons, the reported performances of model portfolios do not reflect the performance results of Navellier’s actually funded and traded Investment Products. In most cases, Navellier’s Investment Products have materially lower performance results than the performances of the model portfolios presented.
This report contains statements that are, or may be considered to be, forward-looking statements. All statements that are not historical facts, including statements about our beliefs or expectations, are “forward-looking statements” within the meaning of The U.S. Private Securities Litigation Reform Act of 1995. These statements may be identified by such forward-looking terminology as “expect,” “estimate,” “plan,” “intend,” “believe,” “anticipate,” “may,” “will,” “should,” “could,” “continue,” “project,” or similar statements or variations of such terms. Our forward-looking statements are based on a series of expectations, assumptions, and projections, are not guarantees of future results or performance, and involve substantial risks and uncertainty as described in Form ADV Part 2A of our filing with the Securities and Exchange Commission (SEC), which is available at www.adviserinfo.sec.gov or by requesting a copy by emailing info@navellier.com. All of our forward-looking statements are as of the date of this report only. We can give no assurance that such expectations or forward-looking statements will prove to be correct. Actual results may differ materially. You are urged to carefully consider all such factors.
FEDERAL TAX ADVICE DISCLAIMER: As required by U.S. Treasury Regulations, you are informed that, to the extent this presentation includes any federal tax advice, the presentation is not written by Navellier to be used, and cannot be used, for the purpose of avoiding federal tax penalties. Navellier does not advise on any income tax requirements or issues. Use of any information presented by Navellier is for general information only and does not represent tax advice either express or implied. You are encouraged to seek professional tax advice for income tax questions and assistance.
IMPORTANT NEWSLETTER DISCLOSURE:The hypothetical performance results for investment newsletters that are authored or edited by Louis Navellier, including Louis Navellier’s Growth Investor, Louis Navellier’s Breakthrough Stocks, Louis Navellier’s Accelerated Profits, and Louis Navellier’s Platinum Club, are not based on any actual securities trading, portfolio, or accounts, and the newsletters’ reported hypothetical performances should be considered mere “paper” or proforma hypothetical performance results and are not actual performance of real world trades. Navellier & Associates, Inc. does not have any relation to or affiliation with the owner of these newsletters. There are material differences between Navellier Investment Products’ portfolios and the InvestorPlace Media, LLC newsletter portfolios authored by Louis Navellier. The InvestorPlace Media, LLC newsletters contain hypothetical performance that do not include transaction costs, advisory fees, or other fees a client might incur if actual investments and trades were being made by an investor. As a result, newsletter performance should not be used to evaluate Navellier Investment services which are separate and different from the newsletters. The owner of the newsletters is InvestorPlace Media, LLC and any questions concerning the newsletters, including any newsletter advertising or hypothetical Newsletter performance claims, (which are calculated solely by Investor Place Media and not Navellier) should be referred to InvestorPlace Media, LLC at (800) 718-8289.
Please note that Navellier & Associates and the Navellier Private Client Group are managed completely independent of the newsletters owned and published by InvestorPlace Media, LLC and written and edited by Louis Navellier, and investment performance of the newsletters should in no way be considered indicative of potential future investment performance for any Navellier & Associates separately managed account portfolio. Potential investors should consult with their financial advisor before investing in any Navellier Investment Product.
Navellier claims compliance with Global Investment Performance Standards (GIPS). To receive a complete list and descriptions of Navellier’s composites and/or a presentation that adheres to the GIPS standards, please contact Navellier or click here. It should not be assumed that any securities recommendations made by Navellier & Associates, Inc. in the future will be profitable or equal the performance of securities made in this report.
FactSet Disclosure: Navellier does not independently calculate the statistical information included in the attached report. The calculation and the information are provided by FactSet, a company not related to Navellier. Although information contained in the report has been obtained from FactSet and is based on sources Navellier believes to be reliable, Navellier does not guarantee its accuracy, and it may be incomplete or condensed. The report and the related FactSet sourced information are provided on an “as is” basis. The user assumes the entire risk of any use made of this information. Investors should consider the report as only a single factor in making their investment decision. The report is for informational purposes only and is not intended as an offer or solicitation for the purchase or sale of a security. FactSet sourced information is the exclusive property of FactSet. Without prior written permission of FactSet, this information may not be reproduced, disseminated or used to create any financial products. All indices are unmanaged and performance of the indices include reinvestment of dividends and interest income, unless otherwise noted, are not illustrative of any particular investment and an investment cannot be made in any index. Past performance is no guarantee of future results.