by Jason Bodner
March 10, 2026
Octopi have three-hearts and blue-blood. When they get stressed, one of their hearts, stop-beating.
Recent market gyrations might make some investors feel their heart is on the verge of stopping.
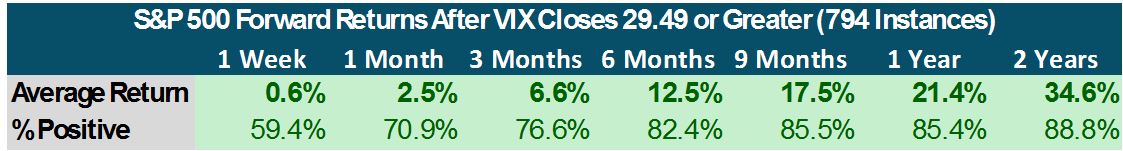
The VIX just closed at its highest level since last April (after “Liberation Day”) at 29.49.
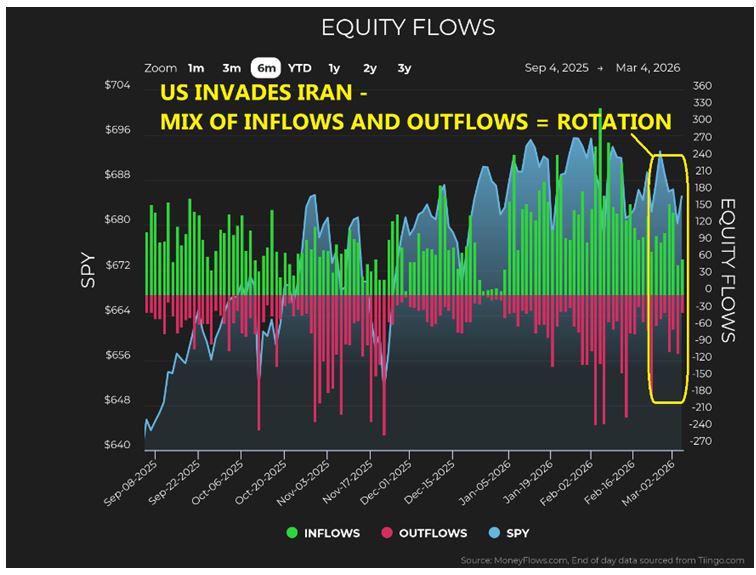
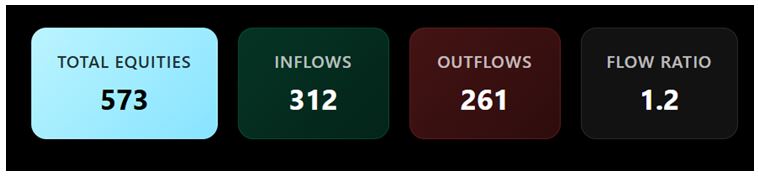
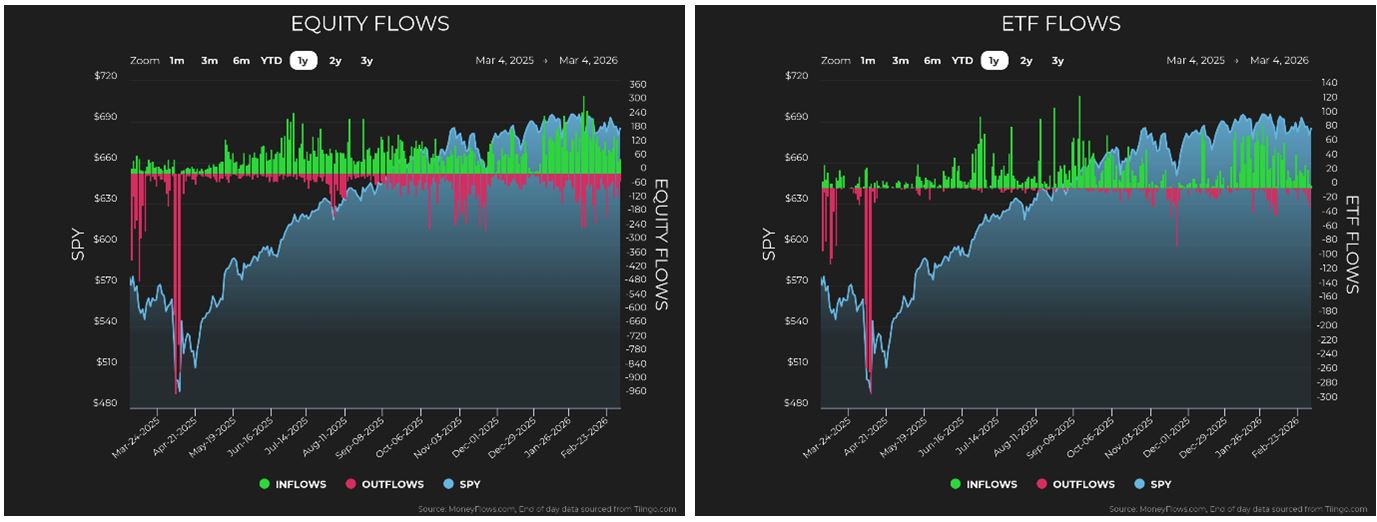
First, volatility surged after the U.S. invaded Iran. But that was volatility, not panic. The flows support that view. Recently we have seen both inflows and outflows, so risk has not been all in one direction:
Graphs are for illustrative and discussion purposes only. Please read important disclosures at the end of this commentary.
I looked back over the last 35-years to see what happened to the S&P 500 after the VIX closed at this level or higher. I’ll post it below. Would you expect disaster? You can open your eyes now… it’s not.
Stocks were higher at each duration later, and positive instances increased over the time-horizon:
Graphs are for illustrative and discussion purposes only. Please read important disclosures at the end of this commentary.
That is not the kind of disaster the headlines imply. None of this diminishes the seriousness of what is unfolding in the Middle East. The Iran conflict is real, and the risks are legitimate. But history has value when emotions run-hot. It reminds us how markets have behaved when fear takes center-stage.
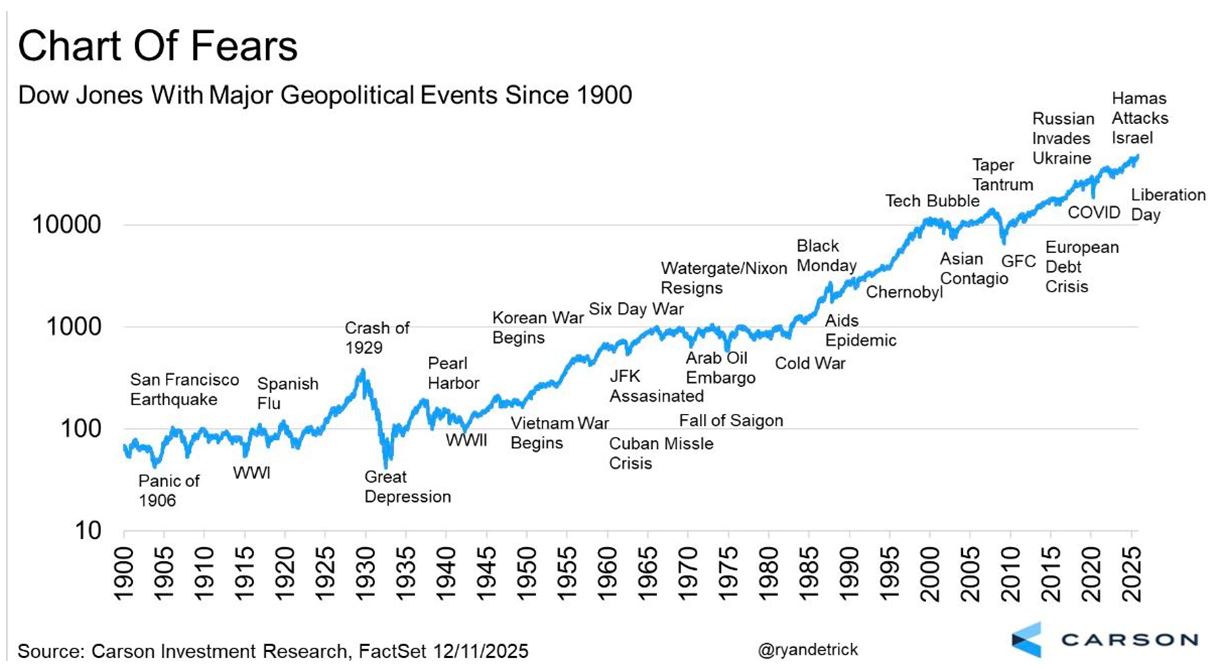
Look at the long-arc of stock market history and the list of events that felt like the end of the world at the time. World War I. World War II. The Vietnam War. JFK’s assassination. AIDS. Black Monday. The Great Financial Crisis. COVID, plus assorted Taper Tantrums and Tariff Tantrums.
Graphs are for illustrative and discussion purposes only. Please read important disclosures at the end of this commentary.
In some of those moments, markets suffered violent shocks. In others, the fear felt enormous but faded quickly with time. Across all of them, the long-term trend of stocks still moved higher.
Viewed decades later, many of those terrifying headlines barely register on a long-term chart. The 1929 crash stands-out, but even that eventually led to one of the greatest recoveries in market history.
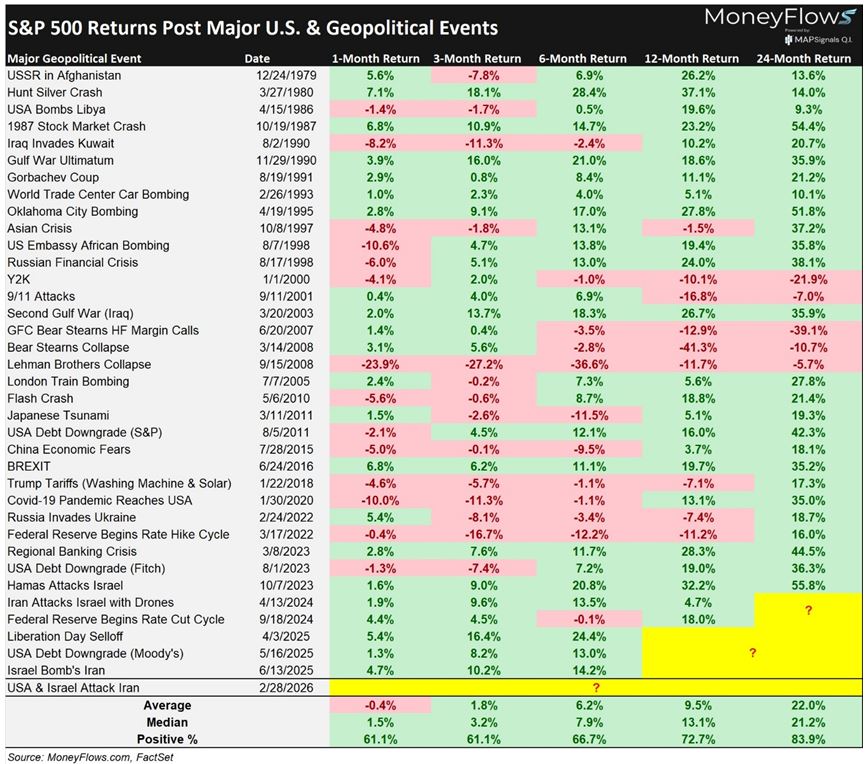
Now let’s narrow the lens. Since 1975, forward S&P 500 returns after major fear events show the same pattern, again and again. Returns one, three, six, twelve and 24-months later tend to rise.
Graphs are for illustrative and discussion purposes only. Please read important disclosures at the end of this commentary.
That perspective helps calm the nerves when markets start whipping-around.
The big “up” moves rarely bother us. It is the downside that creates heart-burn. But history highlights a few simple truths if you separate emotions from your brokerage account:
Volatility is inevitable, but sitting through a surge in volatility is usually the most rational choice.
- Long-term history shows these moments often become opportunities.
- If the last few days had you uneasy, hopefully that perspective helps.
- Now let’s look at what the data from this week is actually showing.
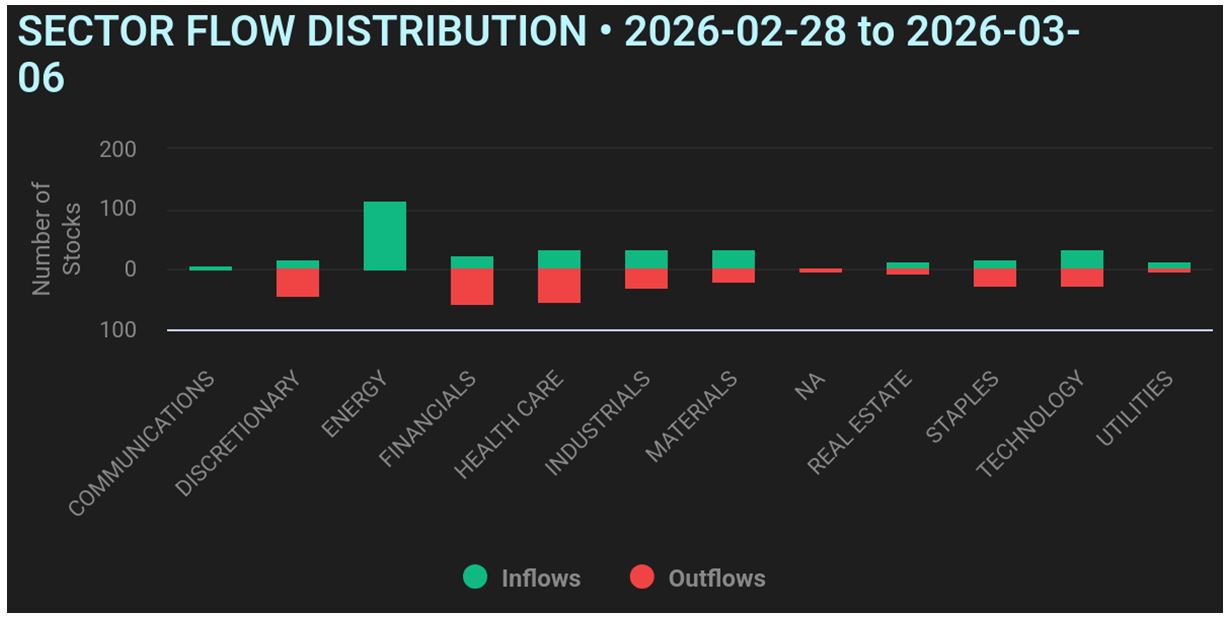
I mentioned earlier that flows have been mixed since the U.S. moved into Iran. Last week, from March 2 through March 5, inflows actually out-numbered outflows.
Graphs are for illustrative and discussion purposes only. Please read important disclosures at the end of this commentary.
Energy saw massive inflows, which is hardly surprising. The attacks have sent shock-waves through the oil markets and the Strait of Hormuz remains closed as the conflict continues.
Graphs are for illustrative and discussion purposes only. Please read important disclosures at the end of this commentary.
Energy was not the only place seeing capital move in.
- Financials, Health Care, Industrials, and even Technology all saw inflows.
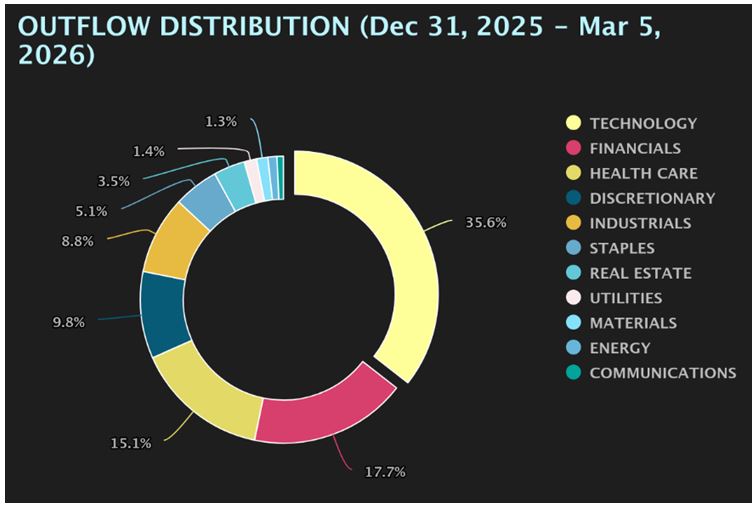
- The most interesting development to me was Technology. There were no meaningful technology outflows last week, which is unusual so far this year. Since the start of the year, technology has been the #1 sector for outflows, accounting for more than a third of all capital leaving the market.
Graphs are for illustrative and discussion purposes only. Please read important disclosures at the end of this commentary.
And yet, in the very week the U.S. goes to war with Iran, the big technology selling disappears.
Instead, we are seeing the opposite.
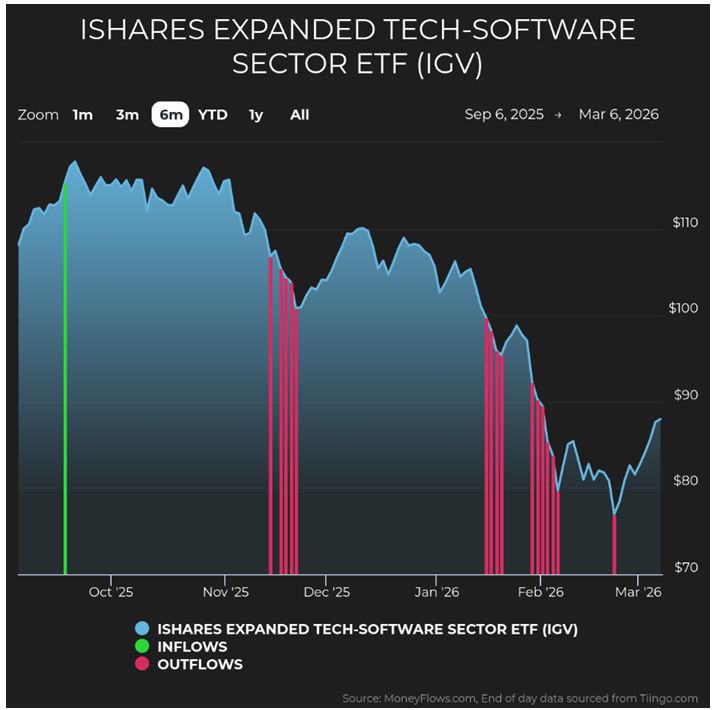
A few weeks-ago on February 23, I highlighted the brutal oversold conditions in software stocks. At the time it looked like we were near capitulation. I argued there was opportunity and I even bought IGV, the software ETF, for my children. Since then, the ETF has rallied roughly 15%.
Graphs are for illustrative and discussion purposes only. Please read important disclosures at the end of this commentary.
This is a familiar story in the markets. A frightening narrative drives heavy selling-pressure. Investors hear that AI will destroy software companies and the selling accelerates. If emotions take over, it is easy to get shaken out of positions at exactly the wrong time, but following the data often tells a different story. When fewer than 15% of IGV stocks trade above their 200-day moving average, as they did on February 23, the forward returns have historically been extraordinary.
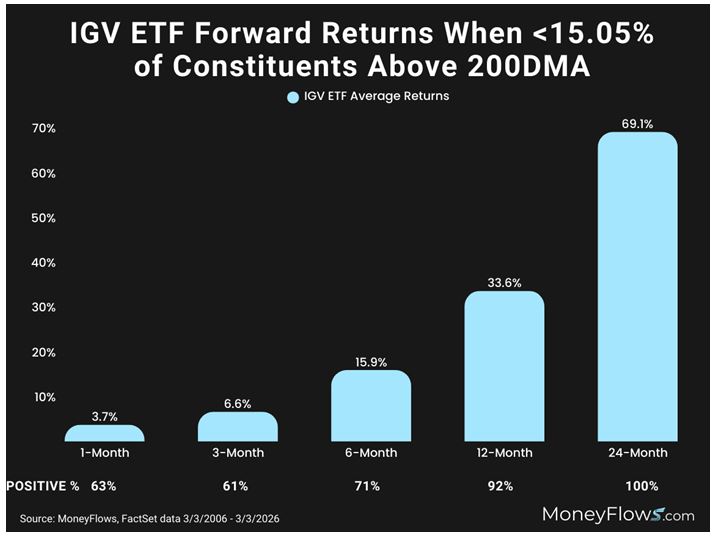
Graphs are for illustrative and discussion purposes only. Please read important disclosures at the end of this commentary.
At the 24-month mark, IGV historically delivered an average gain of 69%, and it was positive each time.
I am no oracle, but I am a stats-man, and a 100% success rate is hard to argue with.
For now, energy remains the hottest-sector in the market. Oil briefly surged above $90 per-barrel, which explains why energy-stocks are suddenly the crown jewel of the S&P 500.![]()
Graphs are for illustrative and discussion purposes only. Please read important disclosures at the end of this commentary.
But even sharp oil spikes don’t spell disaster for stocks. Looking at crude price jumps since 1990, stocks moved higher in the following months.
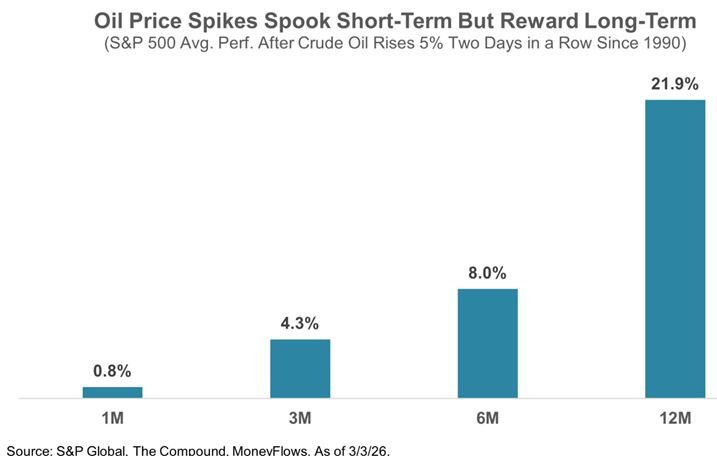
Graphs are for illustrative and discussion purposes only. Please read important disclosures at the end of this commentary.
MoneyFlows Chief Investment Strategist Alec Young summed it up well:
“Don’t get spooked out of stocks by spiking oil prices. Since 1990, the S&P 500 has been 4% higher three-months after big jumps in crude-oil, with gains of 8% and 22% after six-months and a year, respectively.”
In other words, volatility feels uneasy, but the long-term script doesn’t change.
Think of market volatility like an uncomfortable political debate at your in-laws’ house. Sometimes the best strategy is simply to sit there, mute: Nod politely, and wait for dessert.
All of this turbulence has pushed the Big Money Index (BMI) lower, but it has hardly collapsed. It has drifted-down gradually while the broader market continues its five-month sideways grind.
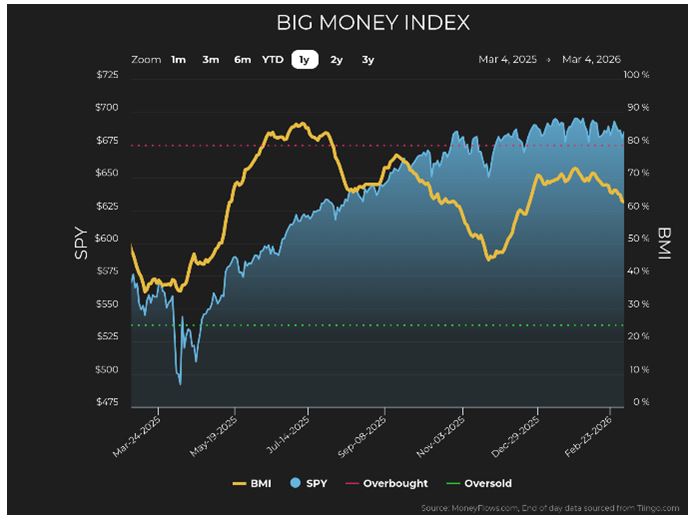
Graphs are for illustrative and discussion purposes only. Please read important disclosures at the end of this commentary.
Underneath the surface, flows remain mixed.
Semiconductors surged while software collapsed. Energy and gold are soaring while discretionary stocks lag. Exchange-traded funds tied to the broader market have seen significantly more inflows than outflows.
Graphs are for illustrative and discussion purposes only. Please read important disclosures at the end of this commentary.
This looks less like systemic risk reduction and more like rotation.
Here is how I see the path forward: When an Iran resolution arrives, whether days or weeks from now, oil prices should ease and energy stocks will likely cool-off. The confirmation of incoming Fed Chair Kevin Warsh could open the door for rate-cuts, especially with markets already sensitive to weak jobs data. And earnings remain solid. Over 70% of S&P 500 firms beat both sales and earnings estimates last-quarter.
Storm clouds eventually clear, and when they do, markets resume what they have done for over a century.
Climb.
“The stock market is a device for transferring money from the impatient to the patient.” – Warren Buffett
All content above represents the opinion of Jason Bodner of Navellier & Associates, Inc.
Also In This Issue
A Look Ahead by Louis Navellier
Friday’s Downbeat Jobs Report May be Misleading
Income Mail by Bryan Perry
Three Compelling High Yield Opportunities
Growth Mail by Gary Alexander
Will AI Really Destroy America’s Job Market?
Global Mail by Ivan Martchev
When Oil Reverses, the Stock Market Will Bottom
Sector Spotlight by Jason Bodner
Don’t Let Market Volatility Upset You
View Full Archive
Read Past Issues Here

Jason Bodner
MARKETMAIL EDITOR FOR SECTOR SPOTLIGHT
Jason Bodner writes Sector Spotlight in the weekly Marketmail publication and has authored several white papers for the company. He is also Co-Founder of Macro Analytics for Professionals which produces proprietary equity accumulation and distribution research for its clients. Previously, Mr. Bodner served as Director of European Equity Derivatives for Cantor Fitzgerald Europe in London, then moved to the role of Head of Equity Derivatives North America for the same company in New York. He also served as S.V.P. Equity Derivatives for Jefferies, LLC. He received a B.S. in business administration in 1996, with honors, from Skidmore College as a member of the Periclean Honors Society. All content of “Sector Spotlight” represents the opinion of Jason Bodner
Important Disclosures:
Jason Bodner is a co-founder and co-owner of Mapsignals. Mr. Bodner is an independent contractor who is occasionally hired by Navellier & Associates to write an article and or provide opinions for possible use in articles that appear in Navellier & Associates weekly Market Mail. Mr. Bodner is not employed or affiliated with Louis Navellier, Navellier & Associates, Inc., or any other Navellier owned entity. The opinions and statements made here are those of Mr. Bodner and not necessarily those of any other persons or entities. This is not an endorsement, or solicitation or testimonial or investment advice regarding the BMI Index or any statements or recommendations or analysis in the article or the BMI Index or Mapsignals or its products or strategies.
Although information in these reports has been obtained from and is based upon sources that Navellier believes to be reliable, Navellier does not guarantee its accuracy and it may be incomplete or condensed. All opinions and estimates constitute Navellier’s judgment as of the date the report was created and are subject to change without notice. These reports are for informational purposes only and are not a solicitation for the purchase or sale of a security. Any decision to purchase securities mentioned in these reports must take into account existing public information on such securities or any registered prospectus.To the extent permitted by law, neither Navellier & Associates, Inc., nor any of its affiliates, agents, or service providers assumes any liability or responsibility nor owes any duty of care for any consequences of any person acting or refraining to act in reliance on the information contained in this communication or for any decision based on it.
Past performance is no indication of future results. Investment in securities involves significant risk and has the potential for partial or complete loss of funds invested. It should not be assumed that any securities recommendations made by Navellier. in the future will be profitable or equal the performance of securities made in this report. Dividend payments are not guaranteed. The amount of a dividend payment, if any, can vary over time and issuers may reduce dividends paid on securities in the event of a recession or adverse event affecting a specific industry or issuer.
None of the stock information, data, and company information presented herein constitutes a recommendation by Navellier or a solicitation to buy or sell any securities. Any specific securities identified and described do not represent all of the securities purchased, sold, or recommended for advisory clients. The holdings identified do not represent all of the securities purchased, sold, or recommended for advisory clients and the reader should not assume that investments in the securities identified and discussed were or will be profitable.
Information presented is general information that does not take into account your individual circumstances, financial situation, or needs, nor does it present a personalized recommendation to you. Individual stocks presented may not be suitable for every investor. Investment in securities involves significant risk and has the potential for partial or complete loss of funds invested. Investment in fixed income securities has the potential for the investment return and principal value of an investment to fluctuate so that an investor’s holdings, when redeemed, may be worth less than their original cost.
One cannot invest directly in an index. Index is unmanaged and index performance does not reflect deduction of fees, expenses, or taxes. Presentation of Index data does not reflect a belief by Navellier that any stock index constitutes an investment alternative to any Navellier equity strategy or is necessarily comparable to such strategies. Among the most important differences between the Indices and Navellier strategies are that the Navellier equity strategies may (1) incur material management fees, (2) concentrate its investments in relatively few stocks, industries, or sectors, (3) have significantly greater trading activity and related costs, and (4) be significantly more or less volatile than the Indices.
ETF Risk: We may invest in exchange traded funds (“ETFs”) and some of our investment strategies are generally fully invested in ETFs. Like traditional mutual funds, ETFs charge asset-based fees, but they generally do not charge initial sales charges or redemption fees and investors typically pay only customary brokerage fees to buy and sell ETF shares. The fees and costs charged by ETFs held in client accounts will not be deducted from the compensation the client pays Navellier. ETF prices can fluctuate up or down, and a client account could lose money investing in an ETF if the prices of the securities owned by the ETF go down. ETFs are subject to additional risks:
- ETF shares may trade above or below their net asset value;
- An active trading market for an ETF’s shares may not develop or be maintained;
- The value of an ETF may be more volatile than the underlying portfolio of securities the ETF is designed to track;
- The cost of owning shares of the ETF may exceed those a client would incur by directly investing in the underlying securities and;
- Trading of an ETF’s shares may be halted if the listing exchange’s officials deem it appropriate, the shares are delisted from the exchange, or the activation of market-wide “circuit breakers” (which are tied to large decreases in stock prices) halts stock trading generally.
Grader Disclosures: Investment in equity strategies involves substantial risk and has the potential for partial or complete loss of funds invested. The sample portfolio and any accompanying charts are for informational purposes only and are not to be construed as a solicitation to buy or sell any financial instrument and should not be relied upon as the sole factor in an investment making decision. As a matter of normal and important disclosures to you, as a potential investor, please consider the following: The performance presented is not based on any actual securities trading, portfolio, or accounts, and the reported performance of the A, B, C, D, and F portfolios (collectively the “model portfolios”) should be considered mere “paper” or pro forma performance results based on Navellier’s research.
Investors evaluating any of Navellier & Associates, Inc.’s, (or its affiliates’) Investment Products must not use any information presented here, including the performance figures of the model portfolios, in their evaluation of any Navellier Investment Products. Navellier Investment Products include the firm’s mutual funds and managed accounts. The model portfolios, charts, and other information presented do not represent actual funded trades and are not actual funded portfolios. There are material differences between Navellier Investment Products’ portfolios and the model portfolios, research, and performance figures presented here. The model portfolios and the research results (1) may contain stocks or ETFs that are illiquid and difficult to trade; (2) may contain stock or ETF holdings materially different from actual funded Navellier Investment Product portfolios; (3) include the reinvestment of all dividends and other earnings, estimated trading costs, commissions, or management fees; and, (4) may not reflect prices obtained in an actual funded Navellier Investment Product portfolio. For these and other reasons, the reported performances of model portfolios do not reflect the performance results of Navellier’s actually funded and traded Investment Products. In most cases, Navellier’s Investment Products have materially lower performance results than the performances of the model portfolios presented.
This report contains statements that are, or may be considered to be, forward-looking statements. All statements that are not historical facts, including statements about our beliefs or expectations, are “forward-looking statements” within the meaning of The U.S. Private Securities Litigation Reform Act of 1995. These statements may be identified by such forward-looking terminology as “expect,” “estimate,” “plan,” “intend,” “believe,” “anticipate,” “may,” “will,” “should,” “could,” “continue,” “project,” or similar statements or variations of such terms. Our forward-looking statements are based on a series of expectations, assumptions, and projections, are not guarantees of future results or performance, and involve substantial risks and uncertainty as described in Form ADV Part 2A of our filing with the Securities and Exchange Commission (SEC), which is available at www.adviserinfo.sec.gov or by requesting a copy by emailing info@navellier.com. All of our forward-looking statements are as of the date of this report only. We can give no assurance that such expectations or forward-looking statements will prove to be correct. Actual results may differ materially. You are urged to carefully consider all such factors.
FEDERAL TAX ADVICE DISCLAIMER: As required by U.S. Treasury Regulations, you are informed that, to the extent this presentation includes any federal tax advice, the presentation is not written by Navellier to be used, and cannot be used, for the purpose of avoiding federal tax penalties. Navellier does not advise on any income tax requirements or issues. Use of any information presented by Navellier is for general information only and does not represent tax advice either express or implied. You are encouraged to seek professional tax advice for income tax questions and assistance.
IMPORTANT NEWSLETTER DISCLOSURE:The hypothetical performance results for investment newsletters that are authored or edited by Louis Navellier, including Louis Navellier’s Growth Investor, Louis Navellier’s Breakthrough Stocks, Louis Navellier’s Accelerated Profits, and Louis Navellier’s Platinum Club, are not based on any actual securities trading, portfolio, or accounts, and the newsletters’ reported hypothetical performances should be considered mere “paper” or proforma hypothetical performance results and are not actual performance of real world trades. Navellier & Associates, Inc. does not have any relation to or affiliation with the owner of these newsletters. There are material differences between Navellier Investment Products’ portfolios and the InvestorPlace Media, LLC newsletter portfolios authored by Louis Navellier. The InvestorPlace Media, LLC newsletters contain hypothetical performance that do not include transaction costs, advisory fees, or other fees a client might incur if actual investments and trades were being made by an investor. As a result, newsletter performance should not be used to evaluate Navellier Investment services which are separate and different from the newsletters. The owner of the newsletters is InvestorPlace Media, LLC and any questions concerning the newsletters, including any newsletter advertising or hypothetical Newsletter performance claims, (which are calculated solely by Investor Place Media and not Navellier) should be referred to InvestorPlace Media, LLC at (800) 718-8289.
Please note that Navellier & Associates and the Navellier Private Client Group are managed completely independent of the newsletters owned and published by InvestorPlace Media, LLC and written and edited by Louis Navellier, and investment performance of the newsletters should in no way be considered indicative of potential future investment performance for any Navellier & Associates separately managed account portfolio. Potential investors should consult with their financial advisor before investing in any Navellier Investment Product.
Navellier claims compliance with Global Investment Performance Standards (GIPS). To receive a complete list and descriptions of Navellier’s composites and/or a presentation that adheres to the GIPS standards, please contact Navellier or click here. It should not be assumed that any securities recommendations made by Navellier & Associates, Inc. in the future will be profitable or equal the performance of securities made in this report.
FactSet Disclosure: Navellier does not independently calculate the statistical information included in the attached report. The calculation and the information are provided by FactSet, a company not related to Navellier. Although information contained in the report has been obtained from FactSet and is based on sources Navellier believes to be reliable, Navellier does not guarantee its accuracy, and it may be incomplete or condensed. The report and the related FactSet sourced information are provided on an “as is” basis. The user assumes the entire risk of any use made of this information. Investors should consider the report as only a single factor in making their investment decision. The report is for informational purposes only and is not intended as an offer or solicitation for the purchase or sale of a security. FactSet sourced information is the exclusive property of FactSet. Without prior written permission of FactSet, this information may not be reproduced, disseminated or used to create any financial products. All indices are unmanaged and performance of the indices include reinvestment of dividends and interest income, unless otherwise noted, are not illustrative of any particular investment and an investment cannot be made in any index. Past performance is no guarantee of future results.