by Gary Alexander
February 3, 2026
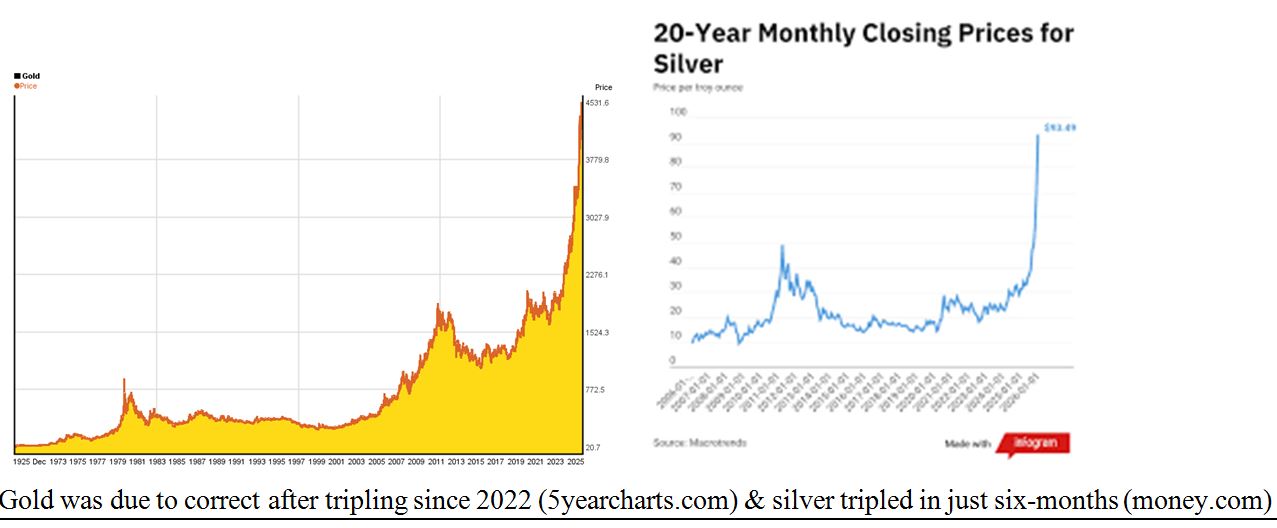
Through last Thursday’s open, gold and silver were soaring to new record highs, by giant steps, with gold reaching $5,586 at its peak, then sinking to $4,700 the next day and closing at $4,670, losing 16%.
Silver, as usual, made more powerful moves on both the upside and downside, reaching $121 at one-point on Thursday, then careening down to $74 Friday before closing around $78, down 35%.
This means the bubble has popped, right? Silver and gold will once again decline, as in 1980. Well, not necessarily. Recall the 1979-80 surge, based on high inflation and a failed silver market corner causing a bubble high. There is no high inflation or market corner going on now. And this time around, the metals were clearly due for a correction but no prolonged crash, due to the new fundamentals of central bank gold buying, silver shortages, failing paper-currencies, chronic deficits and much lower inflation.
Graphs are for illustrative and discussion purposes only. Please read important disclosures at the end of this commentary.
Consider a similar gold decline three-months ago, and then the rapid recovery fueled by bargain hunters. From October 20 to October 30, gold fell 10%, from $4,360 to $3,920 but it quickly recovered to $4,200. As usual, silver declines and recovered by greater percentage swings, falling from $53 to $46 in October (and from $78 to $70 after Christmas), then shooting up over $120 in January. In these recent cases, gold and silver investors clearly bought more on dips, and they should continue doing the same this time, too.
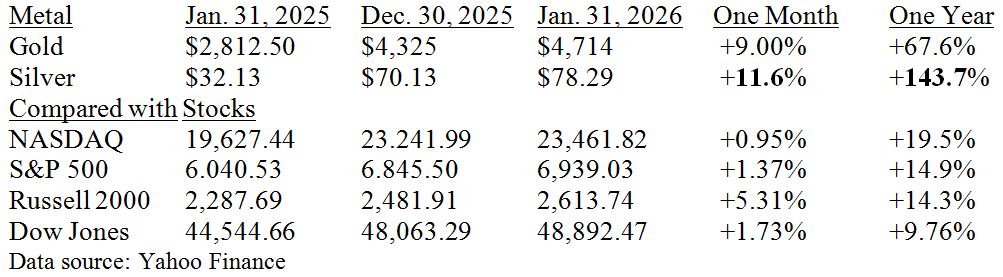
Despite last Friday’s sudden decline, gold still rose 9% in January and silver rose 11.6%, even though their gains through Thursday’s peak were much higher. In the last year, silver is up 144% and gold is up 68%, compared with average 15% gain for stocks. Gold only retreated to where it was two-weeks ago.
The reasons for Friday’s collapse – let’s call them “excuses,” for weak hands looking for a reason to sell – the first impetus came when President Trump nominated a monetary fundamentalist, Kevin Warsh, as the next Fed Chairman. To traders, this choice (long expected) implied a monetary landscape healthier (for the dollar) over the long term. The second torpedo struck on Friday, when the Producer Price Index (PPI) came out hotter than expected with a 0.5% monthly rise (a 6% annual rate), implying fewer rate cuts by the Fed – at least until the new monetary sheriff takes control in June. Oddly enough, high inflation implies fewer rate-cuts, so gold and silver declined on… higher inflation? Go figure!
The War Between Gold and Paper Money (Since 1690) – This Week in History
As usual, I take a longer approach to monetary issues than sweating over the daily moods of traders.
Limiting myself to this week in history, the war between gold and paper money has been going on for centuries. Paper money came to America on this date in 1690. Until then, the colonies dealt primarily in silver and gold coins or for smaller purchases, their “decrepit coppers,” but on February 3, 1690, the Massachusetts colony authorized the first official paper-currency issued in the Western Hemisphere.

Europe loved their central banks, but independent Americans were slow to accept any Wizard of Oz swapping stored metals for paper substitutes. The First Bank of the United States failed after 20-years, then the second Bank of the United States, acting more like a central bank than the first-edition, closed its doors on February 4, 1841, after a contentious 25-year history following the first central bank’s demise.
In late January 1848, gold was discovered in California, giving birth to a new major series of gold-coins. Then, 30-years later, in February 1878, the Bland-Allison Act (named after Representative Richard P. Bland and Senator William B. Allison), mandated the U.S. Treasury to purchase $2 to $4-million worth of silver each month to be coined into silver-dollars, starting with the classic Morgan silver-dollars:

The war between gold, silver and paper came to a head in two-consecutive February weeks in 1894-95:
At 9:30 on February 5, 1894, J.P. Morgan stormed into President Cleveland’s White House office and demanded an audience. After cooling his heels while Cleveland called the Treasury for details on what this invasion might mean, Morgan was ushered in. By now, the U.S. only had $9-million in gold to meet claims, and there were $12-million in current drafts against a shrinking supply, so President Cleveland sheepishly asked Morgan, “Well, sir, what would you suggest?” This comment passed the power of the purse from the White House to Morgan and Wall Street. In short order, Morgan saved the Treasury with an infusion of gold from London. From 1895 to his death in 1913, Morgan served as America’s central banker – and he did a better job than the Federal Reserve did in its first 20-years, from 1913 to 1933.
A year later, on February 3, 1895, J.P. Morgan was once again seen in Washington DC, emerging from the office of U.S. Assistant Secretary of the Treasury William Edmund Curtis, so a broker cabled the floor of the stock exchange, shouting, “We are saved.” Alas, any celebration was premature. On February 4, the “gold squeeze” reached its climax. During the last quarter of 1894, the Treasury shipped $84-million in gold abroad. By the end of January 1895, U.S. gold holdings were down to $45-million. Wall Street was placing bets on when the last ounce of gold would evaporate. On February 4, J.P. Morgan got a letter from the U.S. Secretary of the Treasury canceling all negotiations, and the gold hemorrhage continued.
To avoid the gold squeeze in Washington DC in early 1895, Morgan’s syndicate bought more gold from foreign investors, as in 1894. To finance this gold buying binge, President Cleveland sold $62-million in U.S. dollar bonds at 3.75% to Morgan’s syndicate. Morgan sold these bonds to foreign buyers at 12%, a tidy profit. Although this postponed the gold crunch and saved the Treasury, the public hated Cleveland’s willingness to hop into bed with Big Business, begetting a wave of editorial cartoons with a vicious tone.
On February 3, 1913, the 16th Amendment (income tax) passed, while lame duck president William Taft was awaiting Woodrow Wilson’s inauguration a month later. Then, J.P. Morgan died in March. The Federal Reserve was created to replace Morgan and President Wilson signed income taxes and the Fed into law.
On February 5, 1934, the Dow recovered to 110.74 after FDR devalued the dollar 41% in gold terms on his birthday, January 30, and the market loved this move. The Dow rose 169% in 18-months, and 288% in FDR’s first-term. His second-term reversed those gains, as the Dow fell under 100, losing almost 50%.
Inflation returned in February 1946, after World War II price controls were released at the end of 1945. The CPI gained nearly 20% 1946, despite new President Harry Truman creating the Office of Economic Stabilization (OES) in a vain attempt to keep a lid on consumer prices and ensure a smooth transition to peacetime. Truman picked Chester Bowles, a veteran FDR New Dealer who had previously run price controls at the Office of Price Administration (OPA), to run the OES. (During World War II, Richard Nixon worked for Bowles at the OPA, and he later issued wage and price controls in August of 1971).
And finally, since we monitor the Fed’s interest rate decisions as today’s economic side show, it was on Friday, February 4, 1994 when Alan Greenspan shocked Wall Street by launching a year-long pre-emptive strike against inflation by issuing the first of seven interest rate hikes. When Greenspan’s Fed surprisingly raised rates on February 4, 1994, the market careened down 96.24-points (-2.5%), from 3965 to 3869. Then it kept falling. It took well over a year for the market to return to its highs (set January 31, 1994). President Clinton fumed at the Fed’s war against “phantom inflation,” as the dismal 1994 stock market may have fueled the Republican Revolution in November 1994, taking over Congress in 1995.
I’ve just listed a small sample of this week in history – it’s a long and ongoing war between paper money and gold. This war is not over, but gold retains the high ground, still up over 100-fold since Nixon closed the gold window in 1971 – and up over 200-fold since FDR devalued the dollar in 1934 – 92-years ago.
Don’t count gold out yet, unless America suddenly stops its deficit spending and dollar devaluation.
All content above represents the opinion of Gary Alexander of Navellier & Associates, Inc.
Also In This Issue
A Look Ahead by Louis Navellier
Is Inflation Returning – or is Deflation a Greater Threat?
Income Mail by Bryan Perry
Kevin Hassett’s Base Case for an Economic Supply Shock
Growth Mail by Gary Alexander
What’s Behind the Surge (then Collapse) in Gold and Silver?
Global Mail by Ivan Martchev
The Stock Market is Worried about Iran
Sector Spotlight by Jason Bodner
What A Stock Market Rotation Looks Like
View Full Archive
Read Past Issues Here
About The Author

Gary Alexander
SENIOR EDITOR
Gary Alexander has been Senior Writer at Navellier since 2009. He edits Navellier’s weekly Marketmail and writes a weekly Growth Mail column, in which he uses market history to support the case for growth stocks. For the previous 20-years before joining Navellier, he was Senior Executive Editor at InvestorPlace Media (formerly Phillips Publishing), where he worked with several leading investment analysts, including Louis Navellier (since 1997), helping launch Louis Navellier’s Blue Chip Growth and Global Growth newsletters.
Prior to that, Gary edited Wealth Magazine and Gold Newsletter and wrote various investment research reports for Jefferson Financial in New Orleans in the 1980s. He began his financial newsletter career with KCI Communications in 1980, where he served as consulting editor for Personal Finance newsletter while serving as general manager of KCI’s Alexandria House book division. Before that, he covered the economics beat for news magazines. All content of “Growth Mail” represents the opinion of Gary Alexander
Important Disclosures:
Although information in these reports has been obtained from and is based upon sources that Navellier believes to be reliable, Navellier does not guarantee its accuracy and it may be incomplete or condensed. All opinions and estimates constitute Navellier’s judgment as of the date the report was created and are subject to change without notice. These reports are for informational purposes only and are not a solicitation for the purchase or sale of a security. Any decision to purchase securities mentioned in these reports must take into account existing public information on such securities or any registered prospectus.To the extent permitted by law, neither Navellier & Associates, Inc., nor any of its affiliates, agents, or service providers assumes any liability or responsibility nor owes any duty of care for any consequences of any person acting or refraining to act in reliance on the information contained in this communication or for any decision based on it.
Past performance is no indication of future results. Investment in securities involves significant risk and has the potential for partial or complete loss of funds invested. It should not be assumed that any securities recommendations made by Navellier. in the future will be profitable or equal the performance of securities made in this report. Dividend payments are not guaranteed. The amount of a dividend payment, if any, can vary over time and issuers may reduce dividends paid on securities in the event of a recession or adverse event affecting a specific industry or issuer.
None of the stock information, data, and company information presented herein constitutes a recommendation by Navellier or a solicitation to buy or sell any securities. Any specific securities identified and described do not represent all of the securities purchased, sold, or recommended for advisory clients. The holdings identified do not represent all of the securities purchased, sold, or recommended for advisory clients and the reader should not assume that investments in the securities identified and discussed were or will be profitable.
Information presented is general information that does not take into account your individual circumstances, financial situation, or needs, nor does it present a personalized recommendation to you. Individual stocks presented may not be suitable for every investor. Investment in securities involves significant risk and has the potential for partial or complete loss of funds invested. Investment in fixed income securities has the potential for the investment return and principal value of an investment to fluctuate so that an investor’s holdings, when redeemed, may be worth less than their original cost.
One cannot invest directly in an index. Index is unmanaged and index performance does not reflect deduction of fees, expenses, or taxes. Presentation of Index data does not reflect a belief by Navellier that any stock index constitutes an investment alternative to any Navellier equity strategy or is necessarily comparable to such strategies. Among the most important differences between the Indices and Navellier strategies are that the Navellier equity strategies may (1) incur material management fees, (2) concentrate its investments in relatively few stocks, industries, or sectors, (3) have significantly greater trading activity and related costs, and (4) be significantly more or less volatile than the Indices.
ETF Risk: We may invest in exchange traded funds (“ETFs”) and some of our investment strategies are generally fully invested in ETFs. Like traditional mutual funds, ETFs charge asset-based fees, but they generally do not charge initial sales charges or redemption fees and investors typically pay only customary brokerage fees to buy and sell ETF shares. The fees and costs charged by ETFs held in client accounts will not be deducted from the compensation the client pays Navellier. ETF prices can fluctuate up or down, and a client account could lose money investing in an ETF if the prices of the securities owned by the ETF go down. ETFs are subject to additional risks:
- ETF shares may trade above or below their net asset value;
- An active trading market for an ETF’s shares may not develop or be maintained;
- The value of an ETF may be more volatile than the underlying portfolio of securities the ETF is designed to track;
- The cost of owning shares of the ETF may exceed those a client would incur by directly investing in the underlying securities; and
- Trading of an ETF’s shares may be halted if the listing exchange’s officials deem it appropriate, the shares are delisted from the exchange, or the activation of market-wide “circuit breakers” (which are tied to large decreases in stock prices) halts stock trading generally.
Grader Disclosures: Investment in equity strategies involves substantial risk and has the potential for partial or complete loss of funds invested. The sample portfolio and any accompanying charts are for informational purposes only and are not to be construed as a solicitation to buy or sell any financial instrument and should not be relied upon as the sole factor in an investment making decision. As a matter of normal and important disclosures to you, as a potential investor, please consider the following: The performance presented is not based on any actual securities trading, portfolio, or accounts, and the reported performance of the A, B, C, D, and F portfolios (collectively the “model portfolios”) should be considered mere “paper” or pro forma performance results based on Navellier’s research.
Investors evaluating any of Navellier & Associates, Inc.’s, (or its affiliates’) Investment Products must not use any information presented here, including the performance figures of the model portfolios, in their evaluation of any Navellier Investment Products. Navellier Investment Products include the firm’s mutual funds and managed accounts. The model portfolios, charts, and other information presented do not represent actual funded trades and are not actual funded portfolios. There are material differences between Navellier Investment Products’ portfolios and the model portfolios, research, and performance figures presented here. The model portfolios and the research results (1) may contain stocks or ETFs that are illiquid and difficult to trade; (2) may contain stock or ETF holdings materially different from actual funded Navellier Investment Product portfolios; (3) include the reinvestment of all dividends and other earnings, estimated trading costs, commissions, or management fees; and, (4) may not reflect prices obtained in an actual funded Navellier Investment Product portfolio. For these and other reasons, the reported performances of model portfolios do not reflect the performance results of Navellier’s actually funded and traded Investment Products. In most cases, Navellier’s Investment Products have materially lower performance results than the performances of the model portfolios presented.
This report contains statements that are, or may be considered to be, forward-looking statements. All statements that are not historical facts, including statements about our beliefs or expectations, are “forward-looking statements” within the meaning of The U.S. Private Securities Litigation Reform Act of 1995. These statements may be identified by such forward-looking terminology as “expect,” “estimate,” “plan,” “intend,” “believe,” “anticipate,” “may,” “will,” “should,” “could,” “continue,” “project,” or similar statements or variations of such terms. Our forward-looking statements are based on a series of expectations, assumptions, and projections, are not guarantees of future results or performance, and involve substantial risks and uncertainty as described in Form ADV Part 2A of our filing with the Securities and Exchange Commission (SEC), which is available at www.adviserinfo.sec.gov or by requesting a copy by emailing info@navellier.com. All of our forward-looking statements are as of the date of this report only. We can give no assurance that such expectations or forward-looking statements will prove to be correct. Actual results may differ materially. You are urged to carefully consider all such factors.
FEDERAL TAX ADVICE DISCLAIMER: As required by U.S. Treasury Regulations, you are informed that, to the extent this presentation includes any federal tax advice, the presentation is not written by Navellier to be used, and cannot be used, for the purpose of avoiding federal tax penalties. Navellier does not advise on any income tax requirements or issues. Use of any information presented by Navellier is for general information only and does not represent tax advice either express or implied. You are encouraged to seek professional tax advice for income tax questions and assistance.
IMPORTANT NEWSLETTER DISCLOSURE:The hypothetical performance results for investment newsletters that are authored or edited by Louis Navellier, including Louis Navellier’s Growth Investor, Louis Navellier’s Breakthrough Stocks, Louis Navellier’s Accelerated Profits, and Louis Navellier’s Platinum Club, are not based on any actual securities trading, portfolio, or accounts, and the newsletters’ reported hypothetical performances should be considered mere “paper” or proforma hypothetical performance results and are not actual performance of real world trades. Navellier & Associates, Inc. does not have any relation to or affiliation with the owner of these newsletters. There are material differences between Navellier Investment Products’ portfolios and the InvestorPlace Media, LLC newsletter portfolios authored by Louis Navellier. The InvestorPlace Media, LLC newsletters contain hypothetical performance that do not include transaction costs, advisory fees, or other fees a client might incur if actual investments and trades were being made by an investor. As a result, newsletter performance should not be used to evaluate Navellier Investment services which are separate and different from the newsletters. The owner of the newsletters is InvestorPlace Media, LLC and any questions concerning the newsletters, including any newsletter advertising or hypothetical Newsletter performance claims, (which are calculated solely by Investor Place Media and not Navellier) should be referred to InvestorPlace Media, LLC at (800) 718-8289.
Please note that Navellier & Associates and the Navellier Private Client Group are managed completely independent of the newsletters owned and published by InvestorPlace Media, LLC and written and edited by Louis Navellier, and investment performance of the newsletters should in no way be considered indicative of potential future investment performance for any Navellier & Associates separately managed account portfolio. Potential investors should consult with their financial advisor before investing in any Navellier Investment Product.
Navellier claims compliance with Global Investment Performance Standards (GIPS). To receive a complete list and descriptions of Navellier’s composites and/or a presentation that adheres to the GIPS standards, please contact Navellier or click here. It should not be assumed that any securities recommendations made by Navellier & Associates, Inc. in the future will be profitable or equal the performance of securities made in this report.
FactSet Disclosure: Navellier does not independently calculate the statistical information included in the attached report. The calculation and the information are provided by FactSet, a company not related to Navellier. Although information contained in the report has been obtained from FactSet and is based on sources Navellier believes to be reliable, Navellier does not guarantee its accuracy, and it may be incomplete or condensed. The report and the related FactSet sourced information are provided on an “as is” basis. The user assumes the entire risk of any use made of this information. Investors should consider the report as only a single factor in making their investment decision. The report is for informational purposes only and is not intended as an offer or solicitation for the purchase or sale of a security. FactSet sourced information is the exclusive property of FactSet. Without prior written permission of FactSet, this information may not be reproduced, disseminated or used to create any financial products. All indices are unmanaged and performance of the indices include reinvestment of dividends and interest income, unless otherwise noted, are not illustrative of any particular investment and an investment cannot be made in any index. Past performance is no guarantee of future results.