by Jason Bodner
February 3, 2026
Every year, billions of tons of biomass quietly rotate across Earth, shifting between ecosystems. These reshape the system without making any major headlines – much like capital rotations in the markets.
The year 2026 started strong for equities, but under the surface rotations dominated the January market.
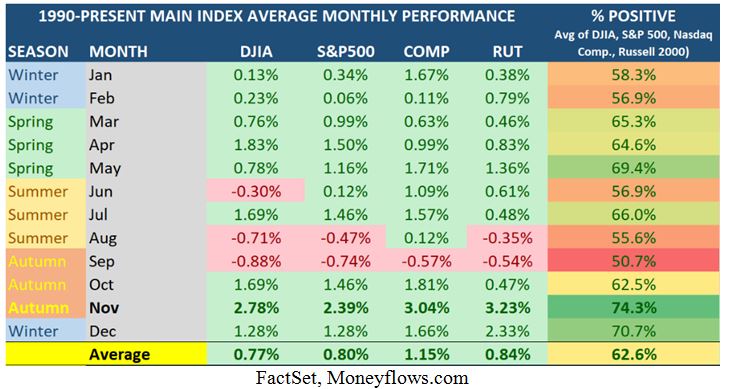
First off, recall the seasonality favoring January: Since 1990, 58% of January’s finished positive:
Graphs are for illustrative and discussion purposes only. Please read important disclosures at the end of this commentary.
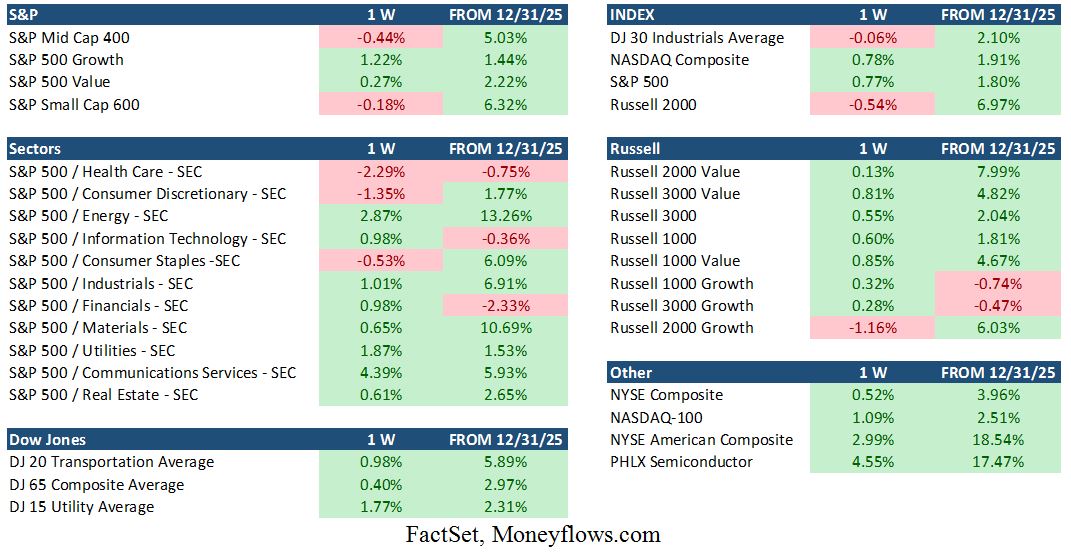
Given this history, January smashed the average gains in some sectors. Looking at index returns, we can see where the money moved. The small-cap heavy Russell 2000 climbed almost 7%. Small-cap and mid-cap stocks are getting love, and value stocks are getting gobbled up while growth stocks are less favored.
Graphs are for illustrative and discussion purposes only. Please read important disclosures at the end of this commentary.
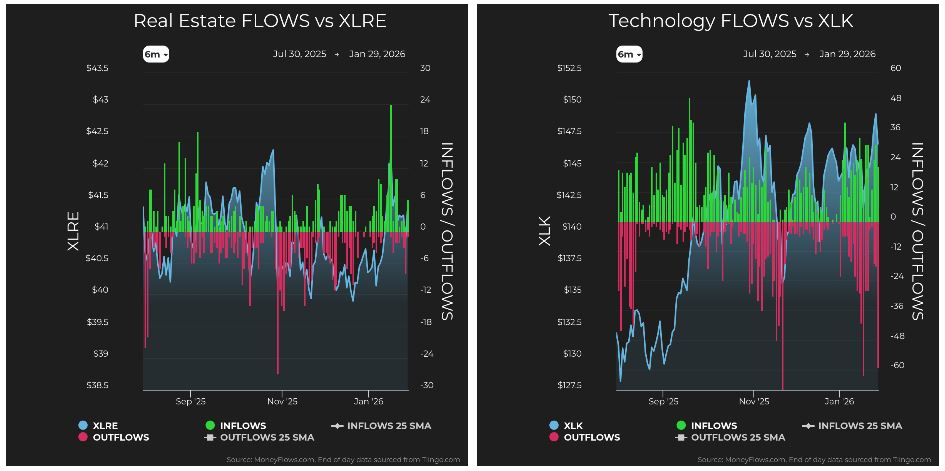
In January, semiconductors were on fire, as the PLX Semiconductor Index rose 17.5% in the month, while the overall Technology sector was down for January. Clearly a technology rotation is happening.
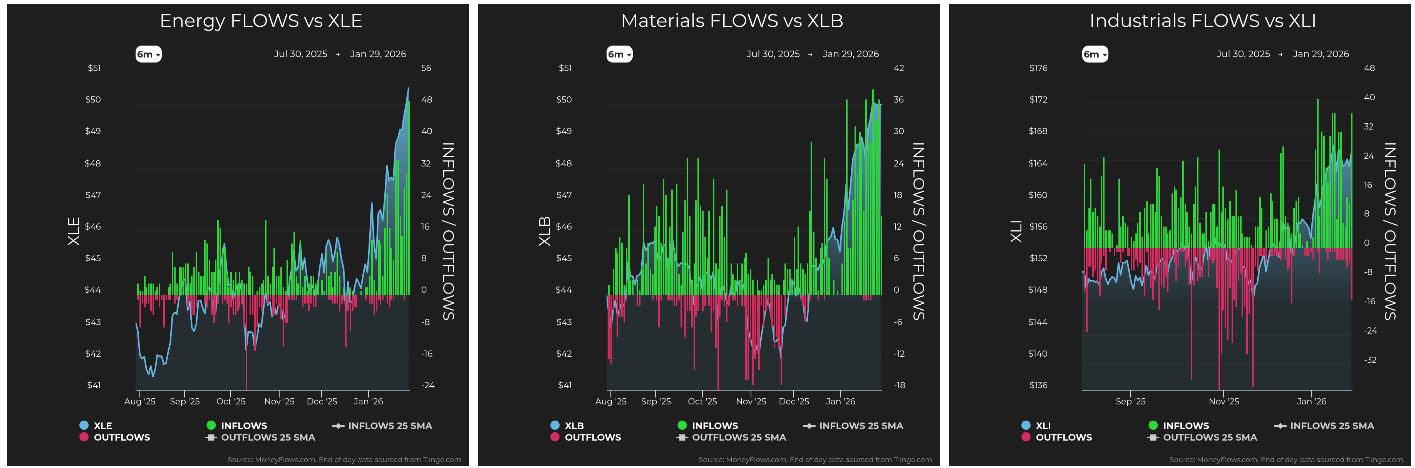
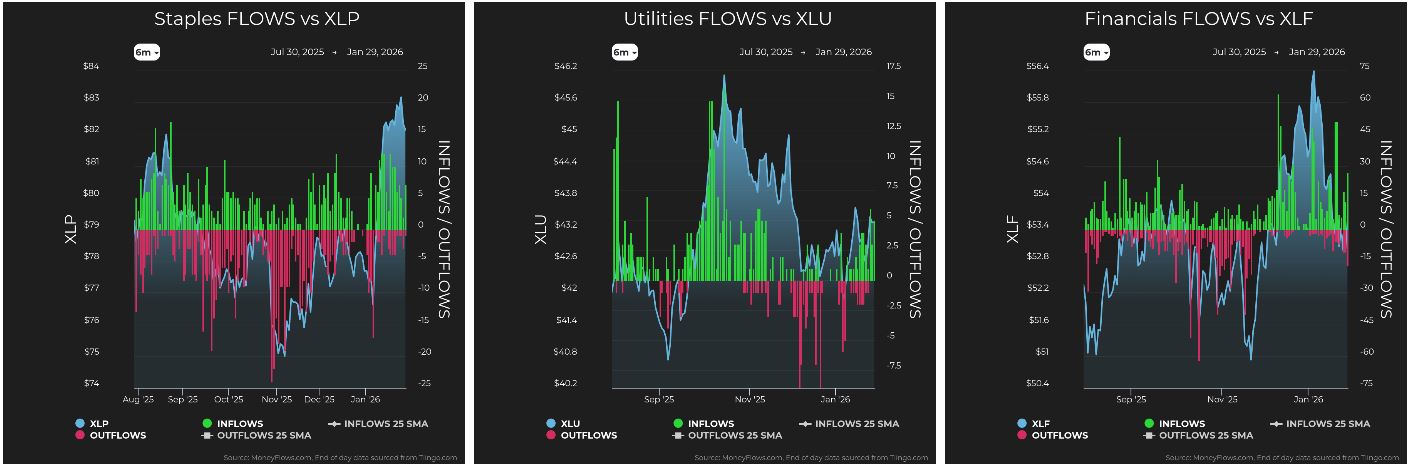
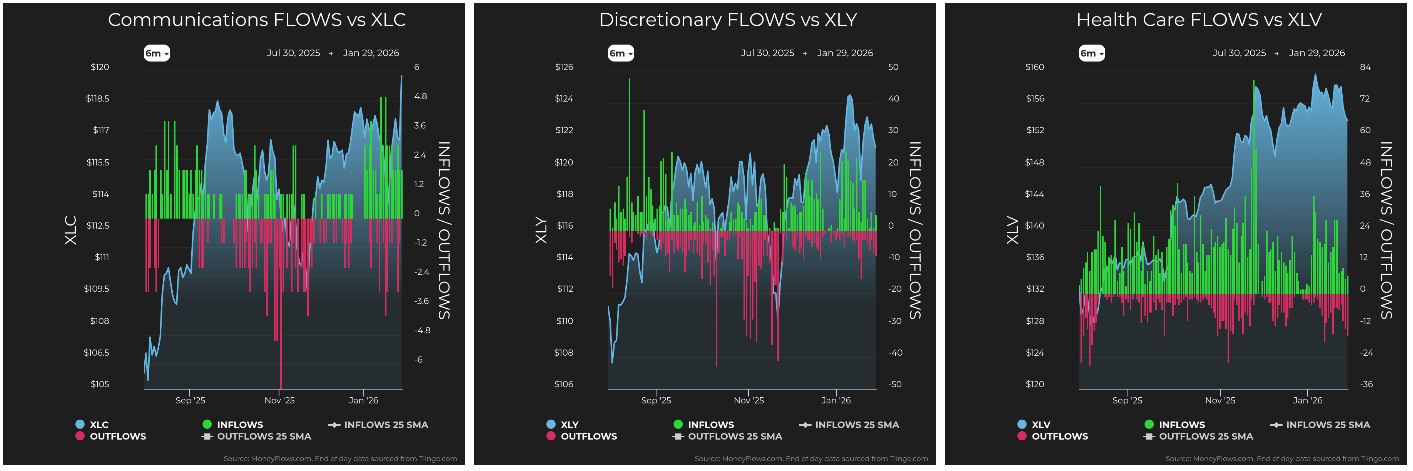
More on this divergence in a moment. First, looking at some more distorted relationships, Energy and Materials sky-rocketed by double-digits. Staples, Industrials, and Communications were strong. Financials, Technology, and Health Care lagged. This shows investors were attracted to perceived under-valued equities.
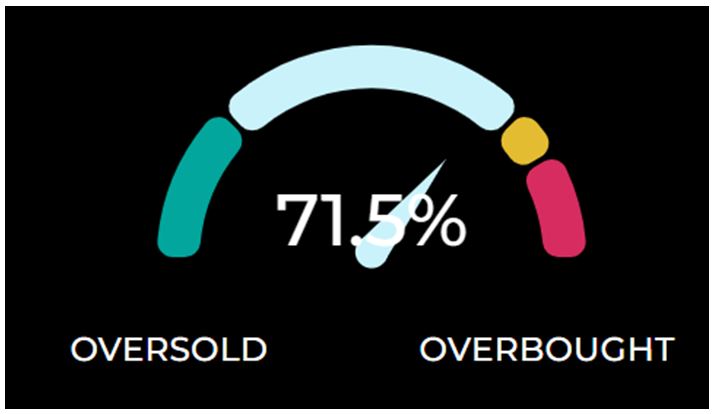
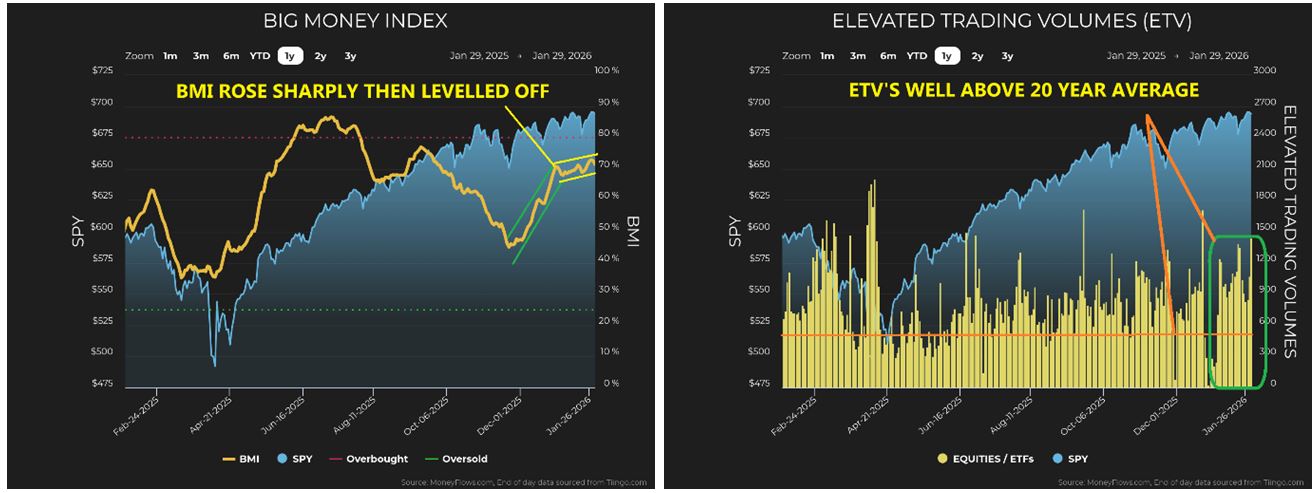
After reviewing this rotation, let’s look through the lens of unusual flows. The Big Money Index (BMI) has been rising steadily and now sits in the “Goldilocks” zone. The 70-80% range is historically a very constructive time for stocks. The BMI currently sits at 71.5%, as the S&P 500 nears its highs:
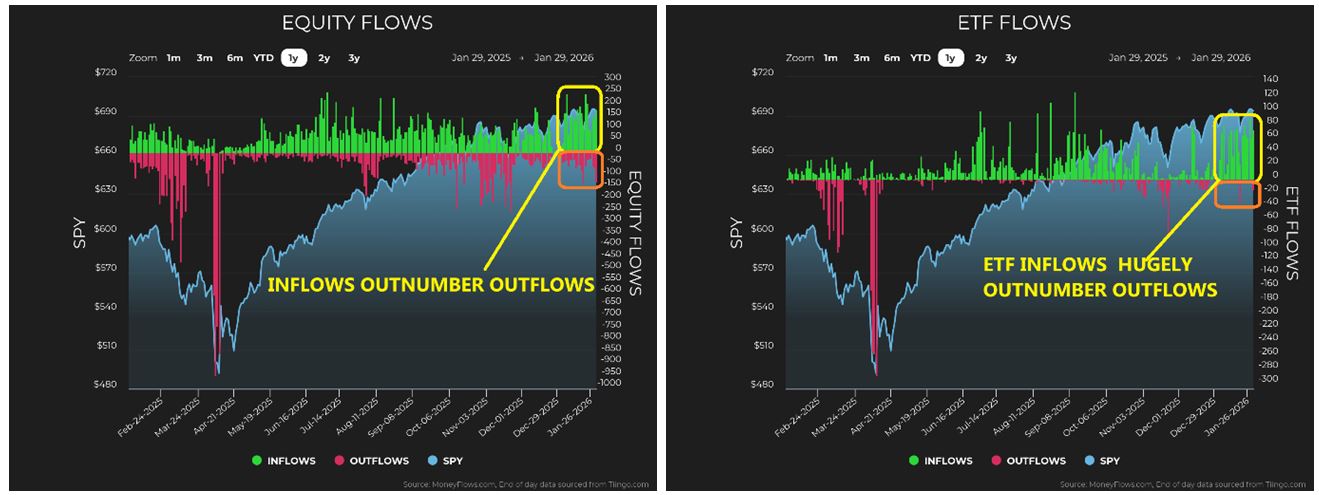
The BMI has been rising since November’s sell-off, with an initial sharp rise as equities recovered and investors scooped up beaten-down stocks. Then, in mid-December, the slope leveled-off and has been range bound, but still in the goldilocks zone, at 71.5% the past 25-days. Remember with a rising market, and inflows out-numbering outflows, it has happened on high Elevated Trading Volumes. This means, unusually large trading numbers are high; well above twice the 20-year average. In other words, as the market chugs higher, it is because heavy buyers are pushing it higher – not a low-volume drift higher:
Graphs are for illustrative and discussion purposes only. Please read important disclosures at the end of this commentary.
Despite some bumpy volatility last week, equity and ETF inflows remain high with fewer outflows:
Graphs are for illustrative and discussion purposes only. Please read important disclosures at the end of this commentary.
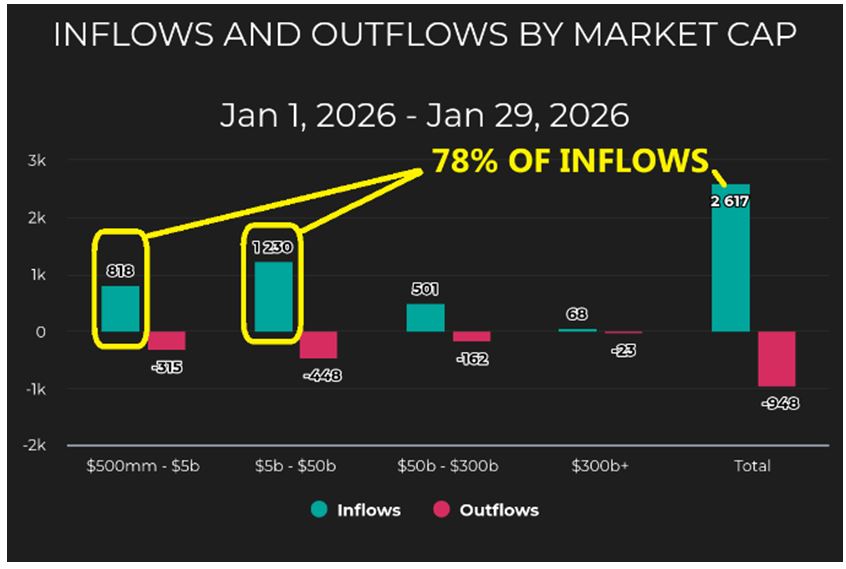
Now, let’s delve into market-flow. Echoing index performance table above, small-cap and mid-cap stocks have accounted for an over-whelming majority of inflows for January, as 78% of all inflows for the month have taken place in stock with $50-billion market cap and below:
Graphs are for illustrative and discussion purposes only. Please read important disclosures at the end of this commentary.
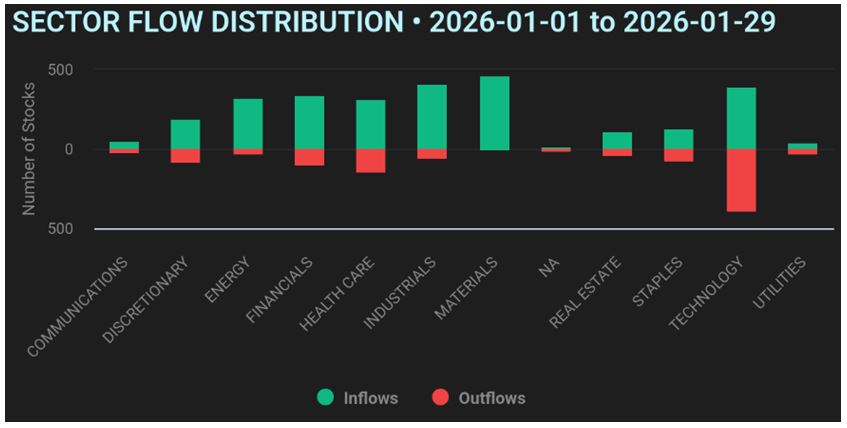
Now we can see how flows were distributed by sector. Below, we see January’s flow activity by sector. Money clearly flowed into Discretionary, Energy, Financials, Health Care, Industrials, Materials, and Technology. This is encouraging and healthy, yet there is one glaring fact popping-off the page: Technology accounts for nearly all the outflows for the month. There’s the rotation – it just hits visually.
Graphs are for illustrative and discussion purposes only. Please read important disclosures at the end of this commentary.
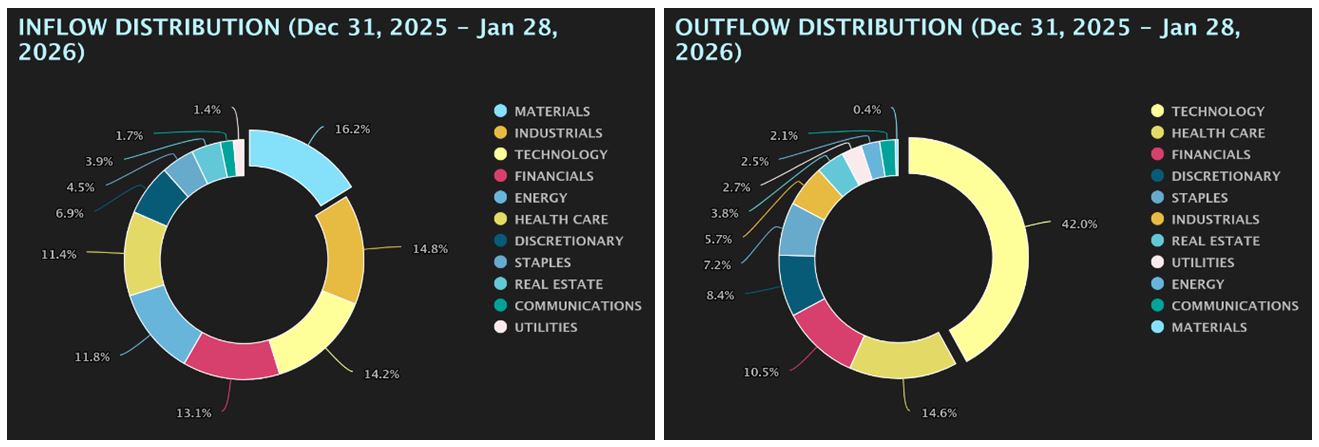
Let’s look at the same January data in a different way. First, please remember: Inflows heavily out-number outflows so far this year. On the left, we see inflow distribution by sector. It’s a fairly even distribution – in Materials, Industrials, Technology, Financials, Energy, and Health Care. This means capital is drawn to small-cap and mid-cap stocks across most sectors. On the right, we see outflows indicating Technology has been on sale.
Graphs are for illustrative and discussion purposes only. Please read important disclosures at the end of this commentary.
This directly impacts sector rankings. Remember, the ranks reset each year, so January has no accumulated data from months of prior reading affecting it, so it shows up any strength and weakness.
![]()
Graphs are for illustrative and discussion purposes only. Please read important disclosures at the end of this commentary.
Energy and Materials have vaulted to the #1 and #2 slots, mainly because of their parabolic rises. These sectors are driven by huge inflows and no outflows. Industrials and Staples have also collected a lot of capital. This fits with the demand for value we saw above. Huge asset-allocators began their 2026 outlook with a dive into value. This is a good sign as the economic outlook must be positive to justify a broad-based allocation across sectors into perceived under-valued stocks.
Graphs are for illustrative and discussion purposes only. Please read important disclosures at the end of this commentary.
Inflows were present, yet they were muted in Utilities, Financials, Communications, Discretionary, Health, and Real Estate. This brings us to the obvious story again: Technology has most of the outflows while still having solid inflows. To me, technology is the most important sector. It represents the single biggest growth engine for our economy. Technology is ubiquitous: it’s in everything, in our phones, computers and tablets. It is also in nearly everything else, like cars, refrigerators, and washing machines.
When technology is sick, the market is sick, like in 2022. The whole technology sector was under pressure, which cracked the broader equity market. So, when I see such outflows in technology, it raises eyebrows.
Let’s see what’s going on under the surface. The tug of war unveils itself when we look at the flows.
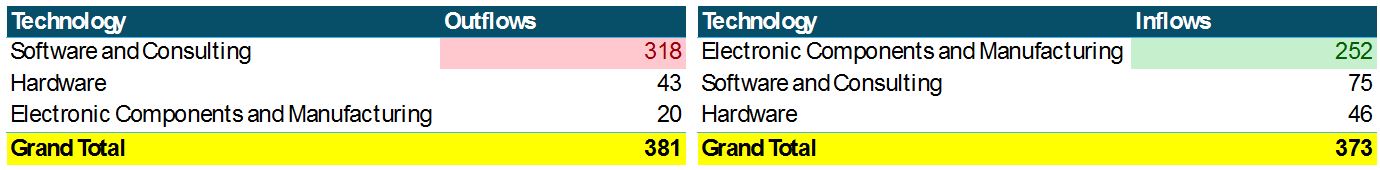
Graphs are for illustrative and discussion purposes only. Please read important disclosures at the end of this commentary.
This tells us money is moving out of software and into semiconductors. The “AI is over” narrative of November has conveniently vanished. There is a major shortage of DRAM juicing DDR4 RAM prices by as much as 265%, catapulting manufacturers such as Lam Research (LRCX), Micron Technology (MU) and ASML Holding (ASML).
On the flip side, money is moving out of software stocks. Many have high fundamental scores which sets up for a potential distressed investment in software stocks for the patient investor.
The markets started strong, but capital is now sloshing around. Software is for sale while semiconductors are hot. Volatility recently spiked due to earnings volatility, but don’t confuse the noise for doom.
The weather is beautiful… until the storm hits.
“We do not see things as they are, we see them as we are.” – Anaïs Nin
Navellier & Associates; own Micron (MU), and Lam Research Corporation (LRCX), in managed accounts. Navellier does not own ASML Holding NV Sponsored ADR (ASML), Jason Bodner owns Micron (MU), Lam Research Corporation (LRCX), and ASML Holding NV Sponsored ADR (ASML), in a personal account.
All content above represents the opinion of Jason Bodner of Navellier & Associates, Inc.
Also In This Issue
A Look Ahead by Louis Navellier
Is Inflation Returning – or is Deflation a Greater Threat?
Income Mail by Bryan Perry
Kevin Hassett’s Base Case for an Economic Supply Shock
Growth Mail by Gary Alexander
What’s Behind the Surge (then Collapse) in Gold and Silver?
Global Mail by Ivan Martchev
The Stock Market is Worried about Iran
Sector Spotlight by Jason Bodner
What A Stock Market Rotation Looks Like
View Full Archive
Read Past Issues Here

Jason Bodner
MARKETMAIL EDITOR FOR SECTOR SPOTLIGHT
Jason Bodner writes Sector Spotlight in the weekly Marketmail publication and has authored several white papers for the company. He is also Co-Founder of Macro Analytics for Professionals which produces proprietary equity accumulation and distribution research for its clients. Previously, Mr. Bodner served as Director of European Equity Derivatives for Cantor Fitzgerald Europe in London, then moved to the role of Head of Equity Derivatives North America for the same company in New York. He also served as S.V.P. Equity Derivatives for Jefferies, LLC. He received a B.S. in business administration in 1996, with honors, from Skidmore College as a member of the Periclean Honors Society. All content of “Sector Spotlight” represents the opinion of Jason Bodner
Important Disclosures:
Jason Bodner is a co-founder and co-owner of Mapsignals. Mr. Bodner is an independent contractor who is occasionally hired by Navellier & Associates to write an article and or provide opinions for possible use in articles that appear in Navellier & Associates weekly Market Mail. Mr. Bodner is not employed or affiliated with Louis Navellier, Navellier & Associates, Inc., or any other Navellier owned entity. The opinions and statements made here are those of Mr. Bodner and not necessarily those of any other persons or entities. This is not an endorsement, or solicitation or testimonial or investment advice regarding the BMI Index or any statements or recommendations or analysis in the article or the BMI Index or Mapsignals or its products or strategies.
Although information in these reports has been obtained from and is based upon sources that Navellier believes to be reliable, Navellier does not guarantee its accuracy and it may be incomplete or condensed. All opinions and estimates constitute Navellier’s judgment as of the date the report was created and are subject to change without notice. These reports are for informational purposes only and are not a solicitation for the purchase or sale of a security. Any decision to purchase securities mentioned in these reports must take into account existing public information on such securities or any registered prospectus.To the extent permitted by law, neither Navellier & Associates, Inc., nor any of its affiliates, agents, or service providers assumes any liability or responsibility nor owes any duty of care for any consequences of any person acting or refraining to act in reliance on the information contained in this communication or for any decision based on it.
Past performance is no indication of future results. Investment in securities involves significant risk and has the potential for partial or complete loss of funds invested. It should not be assumed that any securities recommendations made by Navellier. in the future will be profitable or equal the performance of securities made in this report. Dividend payments are not guaranteed. The amount of a dividend payment, if any, can vary over time and issuers may reduce dividends paid on securities in the event of a recession or adverse event affecting a specific industry or issuer.
None of the stock information, data, and company information presented herein constitutes a recommendation by Navellier or a solicitation to buy or sell any securities. Any specific securities identified and described do not represent all of the securities purchased, sold, or recommended for advisory clients. The holdings identified do not represent all of the securities purchased, sold, or recommended for advisory clients and the reader should not assume that investments in the securities identified and discussed were or will be profitable.
Information presented is general information that does not take into account your individual circumstances, financial situation, or needs, nor does it present a personalized recommendation to you. Individual stocks presented may not be suitable for every investor. Investment in securities involves significant risk and has the potential for partial or complete loss of funds invested. Investment in fixed income securities has the potential for the investment return and principal value of an investment to fluctuate so that an investor’s holdings, when redeemed, may be worth less than their original cost.
One cannot invest directly in an index. Index is unmanaged and index performance does not reflect deduction of fees, expenses, or taxes. Presentation of Index data does not reflect a belief by Navellier that any stock index constitutes an investment alternative to any Navellier equity strategy or is necessarily comparable to such strategies. Among the most important differences between the Indices and Navellier strategies are that the Navellier equity strategies may (1) incur material management fees, (2) concentrate its investments in relatively few stocks, industries, or sectors, (3) have significantly greater trading activity and related costs, and (4) be significantly more or less volatile than the Indices.
ETF Risk: We may invest in exchange traded funds (“ETFs”) and some of our investment strategies are generally fully invested in ETFs. Like traditional mutual funds, ETFs charge asset-based fees, but they generally do not charge initial sales charges or redemption fees and investors typically pay only customary brokerage fees to buy and sell ETF shares. The fees and costs charged by ETFs held in client accounts will not be deducted from the compensation the client pays Navellier. ETF prices can fluctuate up or down, and a client account could lose money investing in an ETF if the prices of the securities owned by the ETF go down. ETFs are subject to additional risks:
- ETF shares may trade above or below their net asset value;
- An active trading market for an ETF’s shares may not develop or be maintained;
- The value of an ETF may be more volatile than the underlying portfolio of securities the ETF is designed to track;
- The cost of owning shares of the ETF may exceed those a client would incur by directly investing in the underlying securities and;
- Trading of an ETF’s shares may be halted if the listing exchange’s officials deem it appropriate, the shares are delisted from the exchange, or the activation of market-wide “circuit breakers” (which are tied to large decreases in stock prices) halts stock trading generally.
Grader Disclosures: Investment in equity strategies involves substantial risk and has the potential for partial or complete loss of funds invested. The sample portfolio and any accompanying charts are for informational purposes only and are not to be construed as a solicitation to buy or sell any financial instrument and should not be relied upon as the sole factor in an investment making decision. As a matter of normal and important disclosures to you, as a potential investor, please consider the following: The performance presented is not based on any actual securities trading, portfolio, or accounts, and the reported performance of the A, B, C, D, and F portfolios (collectively the “model portfolios”) should be considered mere “paper” or pro forma performance results based on Navellier’s research.
Investors evaluating any of Navellier & Associates, Inc.’s, (or its affiliates’) Investment Products must not use any information presented here, including the performance figures of the model portfolios, in their evaluation of any Navellier Investment Products. Navellier Investment Products include the firm’s mutual funds and managed accounts. The model portfolios, charts, and other information presented do not represent actual funded trades and are not actual funded portfolios. There are material differences between Navellier Investment Products’ portfolios and the model portfolios, research, and performance figures presented here. The model portfolios and the research results (1) may contain stocks or ETFs that are illiquid and difficult to trade; (2) may contain stock or ETF holdings materially different from actual funded Navellier Investment Product portfolios; (3) include the reinvestment of all dividends and other earnings, estimated trading costs, commissions, or management fees; and, (4) may not reflect prices obtained in an actual funded Navellier Investment Product portfolio. For these and other reasons, the reported performances of model portfolios do not reflect the performance results of Navellier’s actually funded and traded Investment Products. In most cases, Navellier’s Investment Products have materially lower performance results than the performances of the model portfolios presented.
This report contains statements that are, or may be considered to be, forward-looking statements. All statements that are not historical facts, including statements about our beliefs or expectations, are “forward-looking statements” within the meaning of The U.S. Private Securities Litigation Reform Act of 1995. These statements may be identified by such forward-looking terminology as “expect,” “estimate,” “plan,” “intend,” “believe,” “anticipate,” “may,” “will,” “should,” “could,” “continue,” “project,” or similar statements or variations of such terms. Our forward-looking statements are based on a series of expectations, assumptions, and projections, are not guarantees of future results or performance, and involve substantial risks and uncertainty as described in Form ADV Part 2A of our filing with the Securities and Exchange Commission (SEC), which is available at www.adviserinfo.sec.gov or by requesting a copy by emailing info@navellier.com. All of our forward-looking statements are as of the date of this report only. We can give no assurance that such expectations or forward-looking statements will prove to be correct. Actual results may differ materially. You are urged to carefully consider all such factors.
FEDERAL TAX ADVICE DISCLAIMER: As required by U.S. Treasury Regulations, you are informed that, to the extent this presentation includes any federal tax advice, the presentation is not written by Navellier to be used, and cannot be used, for the purpose of avoiding federal tax penalties. Navellier does not advise on any income tax requirements or issues. Use of any information presented by Navellier is for general information only and does not represent tax advice either express or implied. You are encouraged to seek professional tax advice for income tax questions and assistance.
IMPORTANT NEWSLETTER DISCLOSURE:The hypothetical performance results for investment newsletters that are authored or edited by Louis Navellier, including Louis Navellier’s Growth Investor, Louis Navellier’s Breakthrough Stocks, Louis Navellier’s Accelerated Profits, and Louis Navellier’s Platinum Club, are not based on any actual securities trading, portfolio, or accounts, and the newsletters’ reported hypothetical performances should be considered mere “paper” or proforma hypothetical performance results and are not actual performance of real world trades. Navellier & Associates, Inc. does not have any relation to or affiliation with the owner of these newsletters. There are material differences between Navellier Investment Products’ portfolios and the InvestorPlace Media, LLC newsletter portfolios authored by Louis Navellier. The InvestorPlace Media, LLC newsletters contain hypothetical performance that do not include transaction costs, advisory fees, or other fees a client might incur if actual investments and trades were being made by an investor. As a result, newsletter performance should not be used to evaluate Navellier Investment services which are separate and different from the newsletters. The owner of the newsletters is InvestorPlace Media, LLC and any questions concerning the newsletters, including any newsletter advertising or hypothetical Newsletter performance claims, (which are calculated solely by Investor Place Media and not Navellier) should be referred to InvestorPlace Media, LLC at (800) 718-8289.
Please note that Navellier & Associates and the Navellier Private Client Group are managed completely independent of the newsletters owned and published by InvestorPlace Media, LLC and written and edited by Louis Navellier, and investment performance of the newsletters should in no way be considered indicative of potential future investment performance for any Navellier & Associates separately managed account portfolio. Potential investors should consult with their financial advisor before investing in any Navellier Investment Product.
Navellier claims compliance with Global Investment Performance Standards (GIPS). To receive a complete list and descriptions of Navellier’s composites and/or a presentation that adheres to the GIPS standards, please contact Navellier or click here. It should not be assumed that any securities recommendations made by Navellier & Associates, Inc. in the future will be profitable or equal the performance of securities made in this report.
FactSet Disclosure: Navellier does not independently calculate the statistical information included in the attached report. The calculation and the information are provided by FactSet, a company not related to Navellier. Although information contained in the report has been obtained from FactSet and is based on sources Navellier believes to be reliable, Navellier does not guarantee its accuracy, and it may be incomplete or condensed. The report and the related FactSet sourced information are provided on an “as is” basis. The user assumes the entire risk of any use made of this information. Investors should consider the report as only a single factor in making their investment decision. The report is for informational purposes only and is not intended as an offer or solicitation for the purchase or sale of a security. FactSet sourced information is the exclusive property of FactSet. Without prior written permission of FactSet, this information may not be reproduced, disseminated or used to create any financial products. All indices are unmanaged and performance of the indices include reinvestment of dividends and interest income, unless otherwise noted, are not illustrative of any particular investment and an investment cannot be made in any index. Past performance is no guarantee of future results.