by Jason Bodner
February 24, 2026
The markets are acting weird. There, I said it.
Most indexes are near all-time highs, but there is a wide dispersion buried within such a statement.
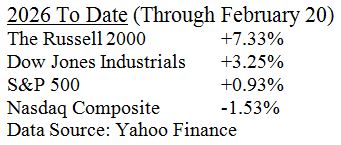
The S&P 500 has logged 33-trading days thus far in 2026. In these seven-weeks of trading, we’ve seen a decline in the NASDAQ and the Russell 2000 index soaring-up, while the SPY (S&P 500 Tracking ETF) is nearly flat in 2027.
Since January 1st, 24% of all outflows were in Software, followed by Internet and Data Services at 9.3%.
Meanwhile, 50% of all inflows since January 1st were split more or less evenly between these sub-sectors:
- United States Banks
- Metal Ore Mining
- Machinery Manufacturing
- Semiconductor Equipment and Services
- Support Activities for Oil and Gas Operations
- Real Estate Investment Trusts (REITs)
- Aerospace and Defense Manufacturing
- Investment Services
- Specialty and Performance Chemicals
- Hospitality Services
- Semiconductor Manufacturing
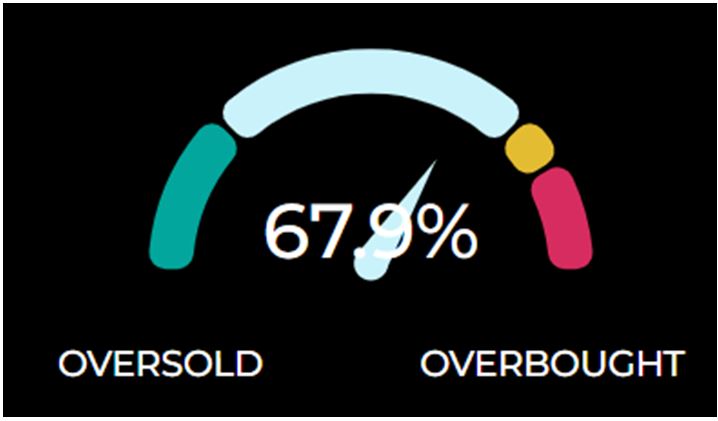
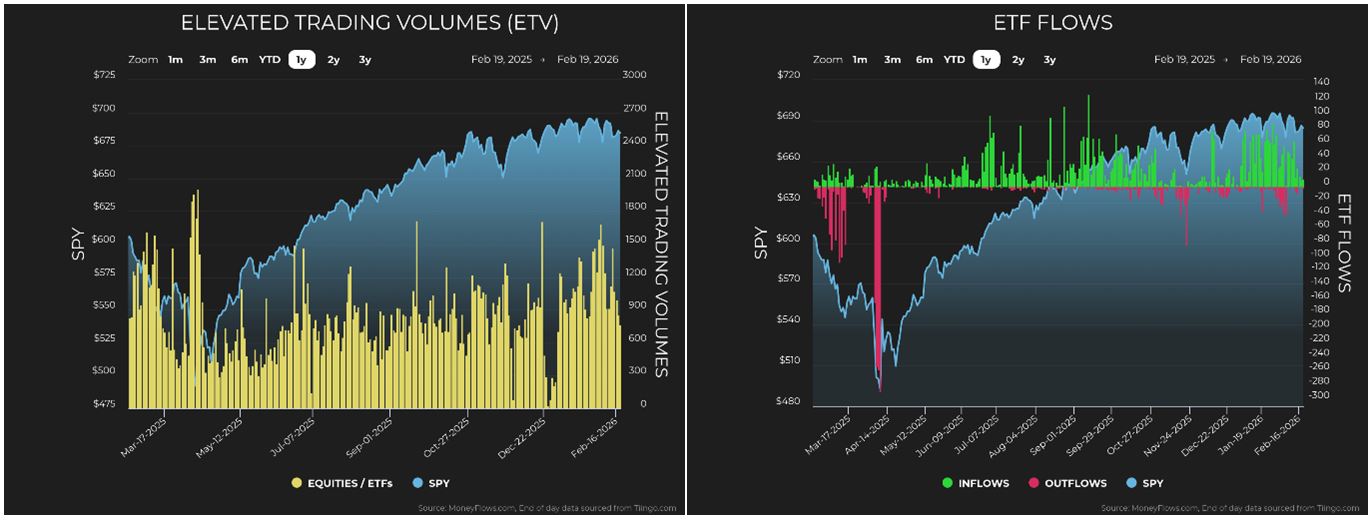
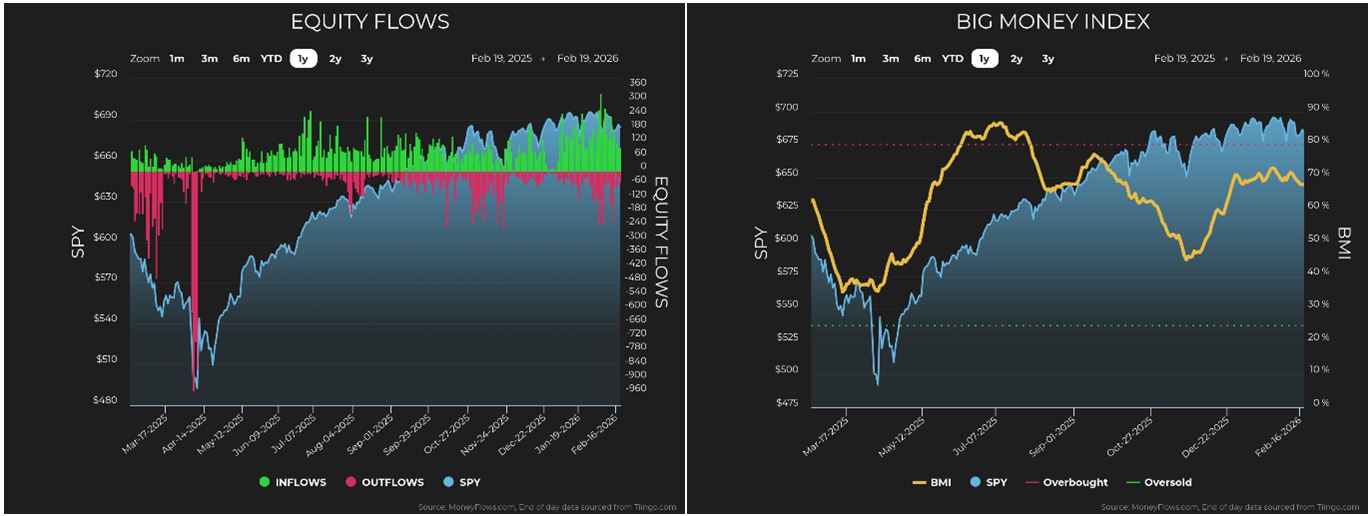
What’s happening below the surface? First, our Big Money Index (BMI) currently sports a great reading of 67.9%. over the last 25-trading days, 68% of all unusually large trade signals were inflows, a reading well above the 20-year average of 61.8. This means we’re seeing the buyers firmly in control.
In this case, why isn’t the S&P 500 going anywhere – at no better than a 1% year-to-date gain?
If you only read the headlines, you would think artificial intelligence just declared war on every software company in America. This scary story seems to imply AI will replace software. Revenue models will collapse. Entire business lines will disappear – probably before your college kid’s spring break.
Layer in the political narrative and the fear index rises further. President Trump is supposedly losing his base. Commentators forecast a mid-term massacre for Republicans, so risk assets are under pressure.
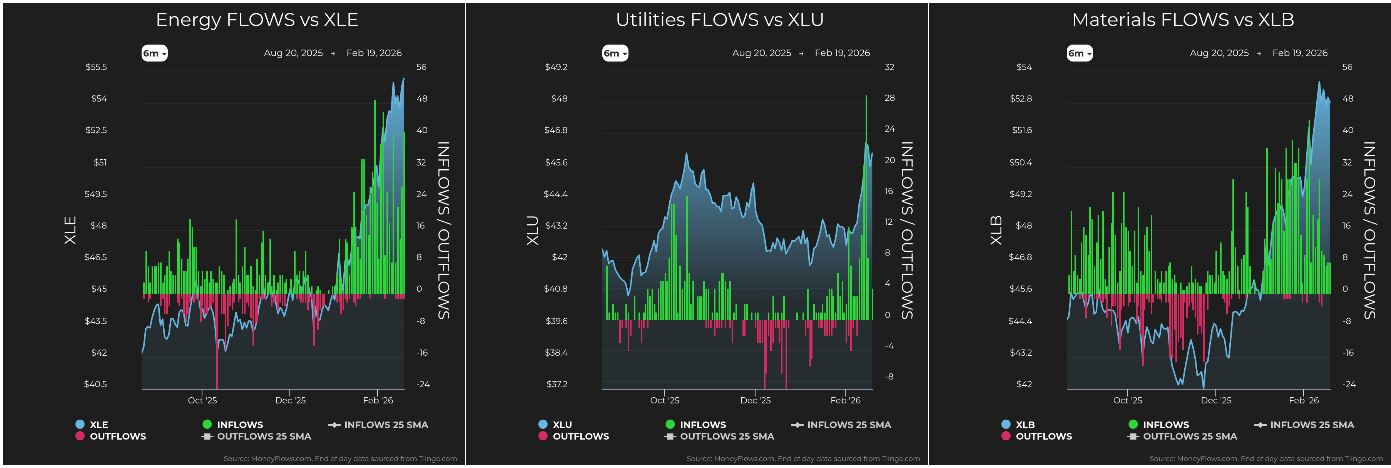
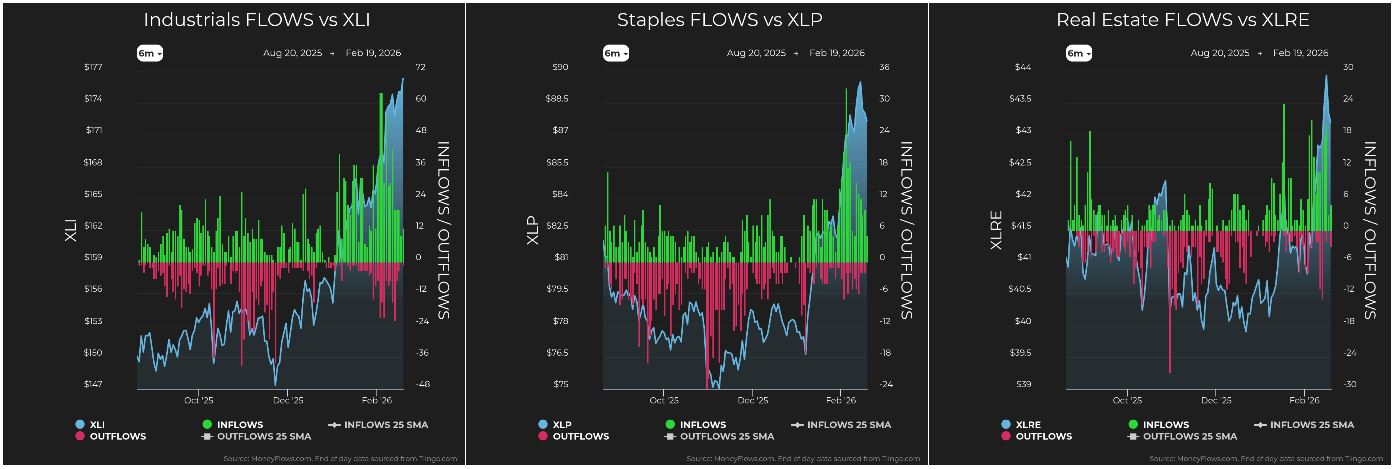
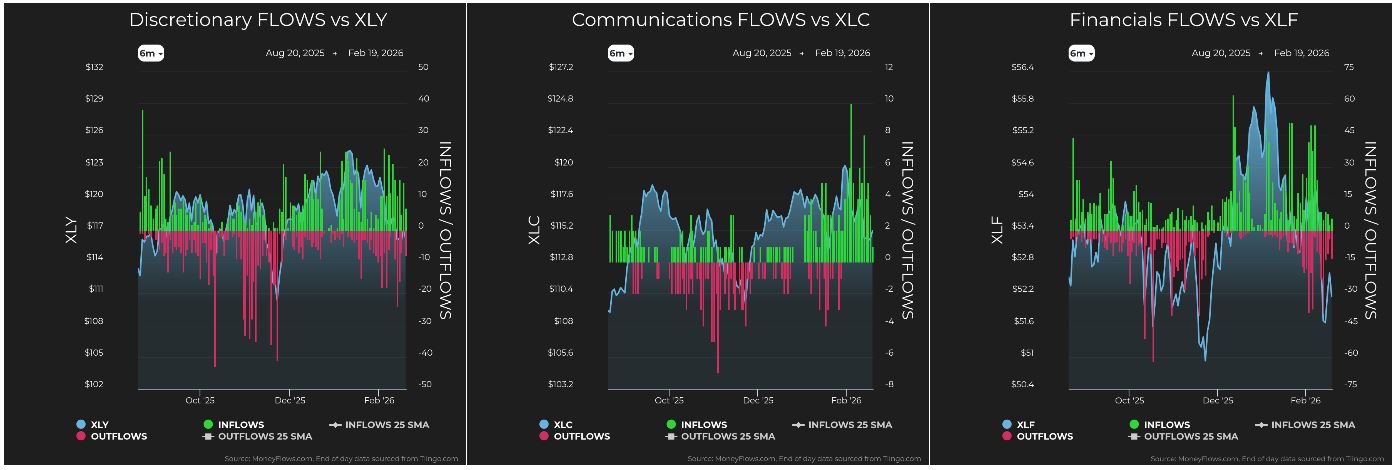
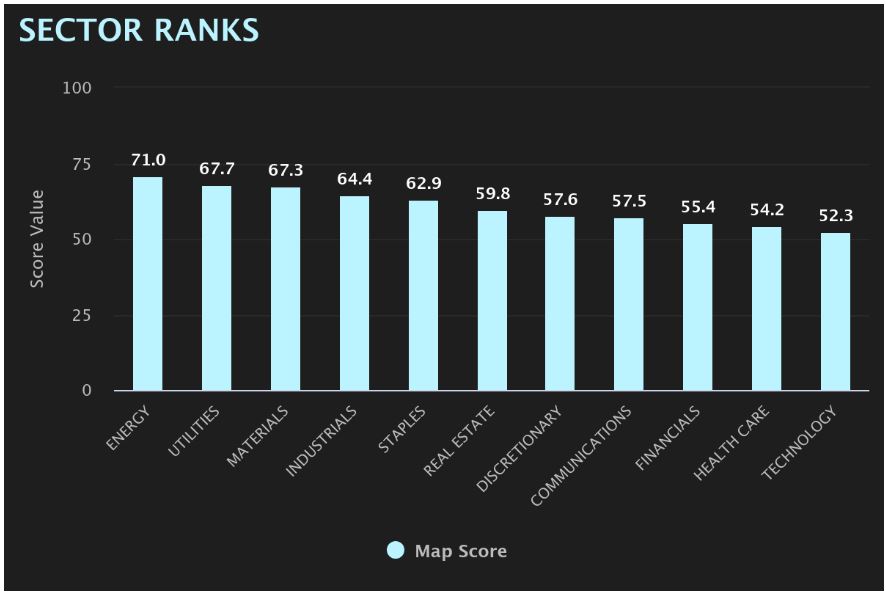
Capital is rotating into small-caps, materials, energy, staples and utilities.
The media storm is making a relentless argument for safety over growth, and value over technology. But markets follow the money-flows, not the media headlines, and the flows right now are not saying the technology-sector is broken. They are saying some leveraged positions are being unwound.
The recent crypto-currency slide was violent. When crypto-currency leaders Bitcoin and Ethereum crack, leveraged players do not calmly rebalance their portfolios. They scramble for liquidity. And where do they find any liquidity? In the most profitable trades of the last few years: Technology. Software, Crypto-currency and Semiconductors.
These part winners have been sold to raise funds, not because earnings collapsed – and not because guidance imploded – but because margin calls do not care about our long-term strategies.
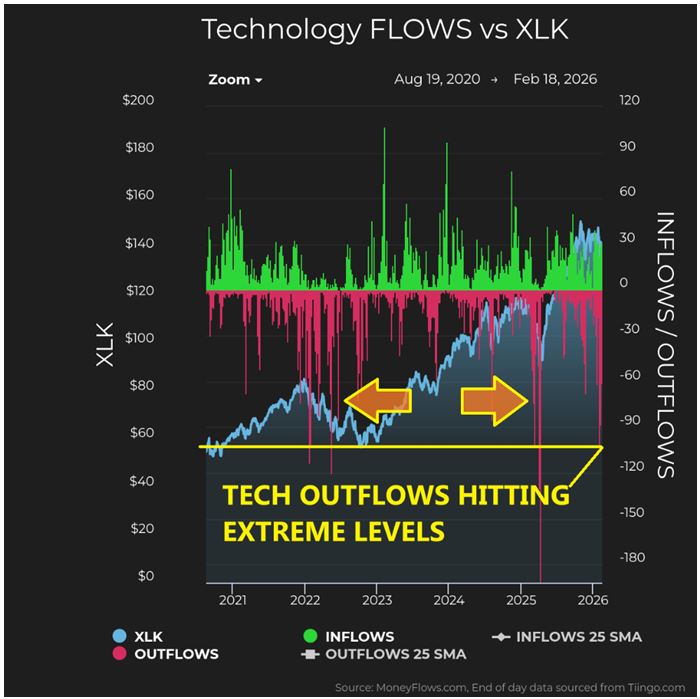
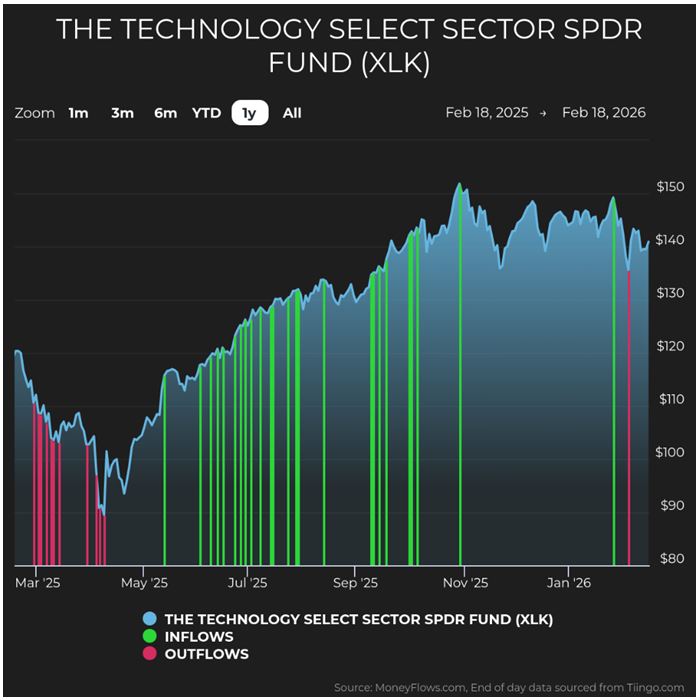
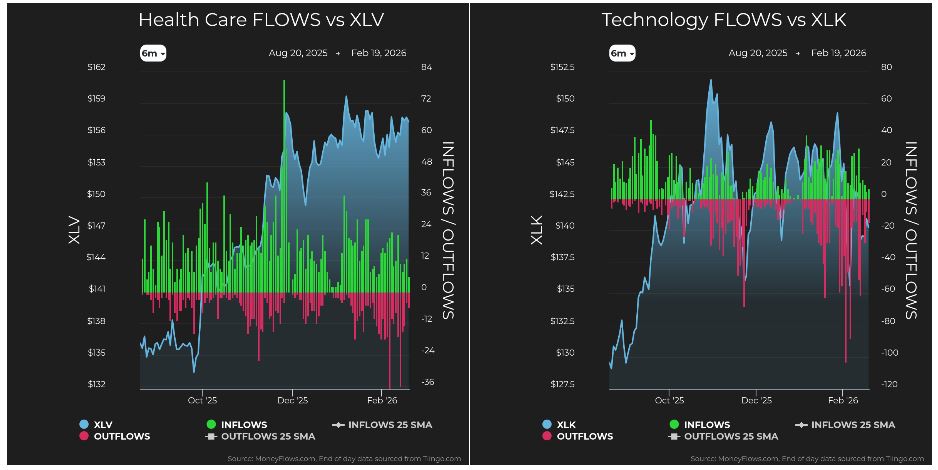
Look at the data. The Technology Select Sector SPDR ETF (XLK) is seeing extreme outflows. In the past five-years, we have only seen comparable pressures twice, in 2022 and 2025:
The first time was in 2022, with its seven-rate hikes, which created rising borrowing costs and slowing digital demand. The NASDAQ fell more than 35% then. (It’d call -35% a “broad macro reset”).
The second instance was November 2025. Investors doubted AI valuations. The Fed turned hawkish. The government shut-down. Job gains weakened. Even strong earnings were punished. Sentiment cracked.
Graphs are for illustrative and discussion purposes only. Please read important disclosures at the end of this commentary.
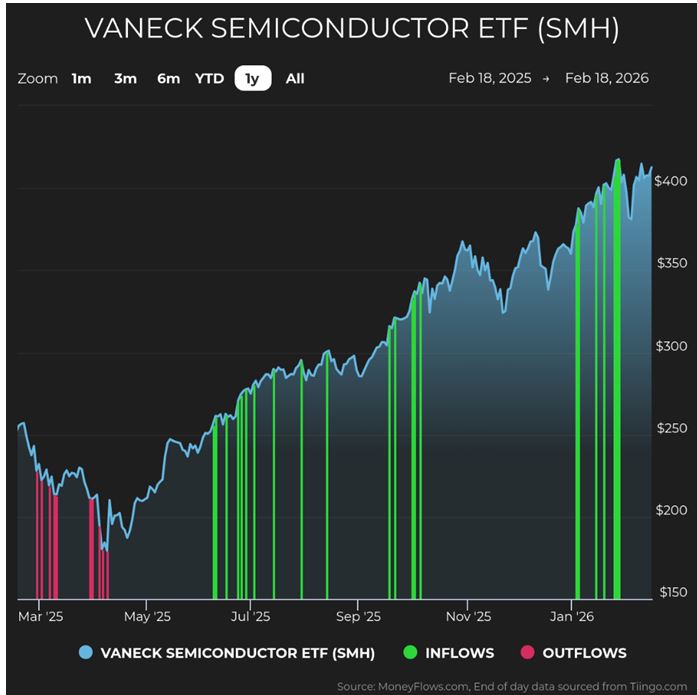
What happened next? Technology recovered. Semiconductors ripped to new-highs in January. The stocks labeled “uninvestable” two-months earlier became leaders again. Back then, I said the November correction was a leverage unwind dressed up as a valuation debate. I believe the same thing now.
Graphs are for illustrative and discussion purposes only. Please read important disclosures at the end of this commentary.
Margin debt is at a record-high, sitting near $1.2-trillion according to St. Louis Fed data. When crypto-currency gets hit, brokers call loans. Traders sell what they can, not what they want. Technology has been the largest pool of gains to harvest. So, technology gets harvested.
Meanwhile, fundamentals are moving opposite the fear. Rates are falling, as is inflation. Taxes are likely headed lower. Margins are expanding. Earnings revisions in many tech sub-sectors remain positive.
With 74% of S&P 500 companies reporting their Q4 2025 earnings, 74% beat EPS and 73% beat revenue.
Information Technology has been a major driver of the market’s revenue acceleration since December 31. Its blended revenue growth rate has risen to 20.6% from 17.9%. This looks like strength to me, not decay.
Structurally, demand for computers and semiconductors is not slowing. Hundreds of billions of dollars are being committed to AI infrastructure, spurred by Trump’s Stargate Initiative. Data-center expansion continues. And we rely on technology more than ever and less than tomorrow…
There are roughly 2,000-chips in the average modern vehicle. Appliances, industrial systems, healthcare devices, defense platforms all require advanced silicon.
Memory markets remain ultra-tight. DRAM and SRAM shortages are projected to persist for up to two-years. Does this look like a setup for collapse?
Now, look beneath the surface in software. Since February 1st, I have logged 492-unusual outflow signals in technology stocks. 262 of those were Software companies. The average fundamental score of those companies is 65.75-percent. The average across more than 5,000-stocks I score daily is 42.6%.
The stocks being sold are of materially higher-quality than the average company in the market. More striking, 65% of software names logging outflows carry fundamental scores above 70%. This is not junk being liquidated. This is institutional grade software being thrown out because someone needs cash.
This is where investors confuse liquidity events with thesis changes. They are not the same.
I am not suggesting blind buying. I say…when flows reach extremes in high-quality areas, pay attention.
For broad exposure, XLK makes sense here.
Graphs are for illustrative and discussion purposes only. Please read important disclosures at the end of this commentary.
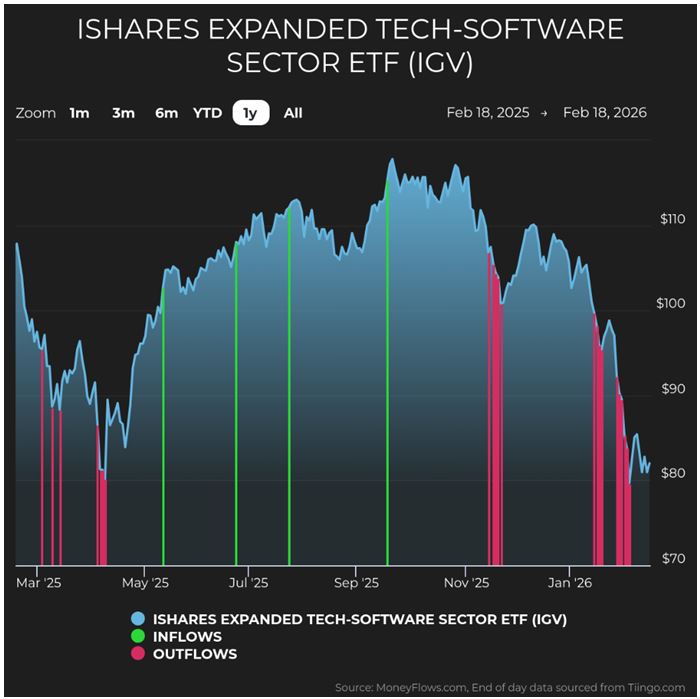
For more aggressive investors, if you want to focus on software, IGV is the more targeted vehicle.
Graphs are for illustrative and discussion purposes only. Please read important disclosures at the end of this commentary.
If you want more precision, I’d say the opportunity is identifying which of those high-scoring software companies are being punished despite strong fundamentals.
The fear trade in technology is driven by liquidation, not deterioration. And liquidation can end abruptly.
History has a tendency to repeat itself. Those constantly fearing a collapse should realize risk runs both ways – up and down. The risk, especially in software, is to the upside.
Graphs are for illustrative and discussion purposes only. Please read important disclosures at the end of this commentary.
Graphs are for illustrative and discussion purposes only. Please read important disclosures at the end of this commentary.
Graphs are for illustrative and discussion purposes only. Please read important disclosures at the end of this commentary.
Graphs are for illustrative and discussion purposes only. Please read important disclosures at the end of this commentary.
All content above represents the opinion of Jason Bodner of Navellier & Associates, Inc.
Also In This Issue
A Look Ahead by Louis Navellier
America’s New “Declaration of Independence”
Income Mail by Bryan Perry
A Preliminary First Quarter Scorecard – Despite Some Speed-Bumps
Growth Mail by Gary Alexander
Don’t Panic, NASDAQ Investors: “The NAZ” Will Rise Again
Global Mail by Ivan Martchev
A “Tariff-ic” Week for the Stock Market
Sector Spotlight by Jason Bodner
This Sector Rotation May End Soon
View Full Archive
Read Past Issues Here

Jason Bodner
MARKETMAIL EDITOR FOR SECTOR SPOTLIGHT
Jason Bodner writes Sector Spotlight in the weekly Marketmail publication and has authored several white papers for the company. He is also Co-Founder of Macro Analytics for Professionals which produces proprietary equity accumulation and distribution research for its clients. Previously, Mr. Bodner served as Director of European Equity Derivatives for Cantor Fitzgerald Europe in London, then moved to the role of Head of Equity Derivatives North America for the same company in New York. He also served as S.V.P. Equity Derivatives for Jefferies, LLC. He received a B.S. in business administration in 1996, with honors, from Skidmore College as a member of the Periclean Honors Society. All content of “Sector Spotlight” represents the opinion of Jason Bodner
Important Disclosures:
Jason Bodner is a co-founder and co-owner of Mapsignals. Mr. Bodner is an independent contractor who is occasionally hired by Navellier & Associates to write an article and or provide opinions for possible use in articles that appear in Navellier & Associates weekly Market Mail. Mr. Bodner is not employed or affiliated with Louis Navellier, Navellier & Associates, Inc., or any other Navellier owned entity. The opinions and statements made here are those of Mr. Bodner and not necessarily those of any other persons or entities. This is not an endorsement, or solicitation or testimonial or investment advice regarding the BMI Index or any statements or recommendations or analysis in the article or the BMI Index or Mapsignals or its products or strategies.
Although information in these reports has been obtained from and is based upon sources that Navellier believes to be reliable, Navellier does not guarantee its accuracy and it may be incomplete or condensed. All opinions and estimates constitute Navellier’s judgment as of the date the report was created and are subject to change without notice. These reports are for informational purposes only and are not a solicitation for the purchase or sale of a security. Any decision to purchase securities mentioned in these reports must take into account existing public information on such securities or any registered prospectus.To the extent permitted by law, neither Navellier & Associates, Inc., nor any of its affiliates, agents, or service providers assumes any liability or responsibility nor owes any duty of care for any consequences of any person acting or refraining to act in reliance on the information contained in this communication or for any decision based on it.
Past performance is no indication of future results. Investment in securities involves significant risk and has the potential for partial or complete loss of funds invested. It should not be assumed that any securities recommendations made by Navellier. in the future will be profitable or equal the performance of securities made in this report. Dividend payments are not guaranteed. The amount of a dividend payment, if any, can vary over time and issuers may reduce dividends paid on securities in the event of a recession or adverse event affecting a specific industry or issuer.
None of the stock information, data, and company information presented herein constitutes a recommendation by Navellier or a solicitation to buy or sell any securities. Any specific securities identified and described do not represent all of the securities purchased, sold, or recommended for advisory clients. The holdings identified do not represent all of the securities purchased, sold, or recommended for advisory clients and the reader should not assume that investments in the securities identified and discussed were or will be profitable.
Information presented is general information that does not take into account your individual circumstances, financial situation, or needs, nor does it present a personalized recommendation to you. Individual stocks presented may not be suitable for every investor. Investment in securities involves significant risk and has the potential for partial or complete loss of funds invested. Investment in fixed income securities has the potential for the investment return and principal value of an investment to fluctuate so that an investor’s holdings, when redeemed, may be worth less than their original cost.
One cannot invest directly in an index. Index is unmanaged and index performance does not reflect deduction of fees, expenses, or taxes. Presentation of Index data does not reflect a belief by Navellier that any stock index constitutes an investment alternative to any Navellier equity strategy or is necessarily comparable to such strategies. Among the most important differences between the Indices and Navellier strategies are that the Navellier equity strategies may (1) incur material management fees, (2) concentrate its investments in relatively few stocks, industries, or sectors, (3) have significantly greater trading activity and related costs, and (4) be significantly more or less volatile than the Indices.
ETF Risk: We may invest in exchange traded funds (“ETFs”) and some of our investment strategies are generally fully invested in ETFs. Like traditional mutual funds, ETFs charge asset-based fees, but they generally do not charge initial sales charges or redemption fees and investors typically pay only customary brokerage fees to buy and sell ETF shares. The fees and costs charged by ETFs held in client accounts will not be deducted from the compensation the client pays Navellier. ETF prices can fluctuate up or down, and a client account could lose money investing in an ETF if the prices of the securities owned by the ETF go down. ETFs are subject to additional risks:
- ETF shares may trade above or below their net asset value;
- An active trading market for an ETF’s shares may not develop or be maintained;
- The value of an ETF may be more volatile than the underlying portfolio of securities the ETF is designed to track;
- The cost of owning shares of the ETF may exceed those a client would incur by directly investing in the underlying securities and;
- Trading of an ETF’s shares may be halted if the listing exchange’s officials deem it appropriate, the shares are delisted from the exchange, or the activation of market-wide “circuit breakers” (which are tied to large decreases in stock prices) halts stock trading generally.
Grader Disclosures: Investment in equity strategies involves substantial risk and has the potential for partial or complete loss of funds invested. The sample portfolio and any accompanying charts are for informational purposes only and are not to be construed as a solicitation to buy or sell any financial instrument and should not be relied upon as the sole factor in an investment making decision. As a matter of normal and important disclosures to you, as a potential investor, please consider the following: The performance presented is not based on any actual securities trading, portfolio, or accounts, and the reported performance of the A, B, C, D, and F portfolios (collectively the “model portfolios”) should be considered mere “paper” or pro forma performance results based on Navellier’s research.
Investors evaluating any of Navellier & Associates, Inc.’s, (or its affiliates’) Investment Products must not use any information presented here, including the performance figures of the model portfolios, in their evaluation of any Navellier Investment Products. Navellier Investment Products include the firm’s mutual funds and managed accounts. The model portfolios, charts, and other information presented do not represent actual funded trades and are not actual funded portfolios. There are material differences between Navellier Investment Products’ portfolios and the model portfolios, research, and performance figures presented here. The model portfolios and the research results (1) may contain stocks or ETFs that are illiquid and difficult to trade; (2) may contain stock or ETF holdings materially different from actual funded Navellier Investment Product portfolios; (3) include the reinvestment of all dividends and other earnings, estimated trading costs, commissions, or management fees; and, (4) may not reflect prices obtained in an actual funded Navellier Investment Product portfolio. For these and other reasons, the reported performances of model portfolios do not reflect the performance results of Navellier’s actually funded and traded Investment Products. In most cases, Navellier’s Investment Products have materially lower performance results than the performances of the model portfolios presented.
This report contains statements that are, or may be considered to be, forward-looking statements. All statements that are not historical facts, including statements about our beliefs or expectations, are “forward-looking statements” within the meaning of The U.S. Private Securities Litigation Reform Act of 1995. These statements may be identified by such forward-looking terminology as “expect,” “estimate,” “plan,” “intend,” “believe,” “anticipate,” “may,” “will,” “should,” “could,” “continue,” “project,” or similar statements or variations of such terms. Our forward-looking statements are based on a series of expectations, assumptions, and projections, are not guarantees of future results or performance, and involve substantial risks and uncertainty as described in Form ADV Part 2A of our filing with the Securities and Exchange Commission (SEC), which is available at www.adviserinfo.sec.gov or by requesting a copy by emailing info@navellier.com. All of our forward-looking statements are as of the date of this report only. We can give no assurance that such expectations or forward-looking statements will prove to be correct. Actual results may differ materially. You are urged to carefully consider all such factors.
FEDERAL TAX ADVICE DISCLAIMER: As required by U.S. Treasury Regulations, you are informed that, to the extent this presentation includes any federal tax advice, the presentation is not written by Navellier to be used, and cannot be used, for the purpose of avoiding federal tax penalties. Navellier does not advise on any income tax requirements or issues. Use of any information presented by Navellier is for general information only and does not represent tax advice either express or implied. You are encouraged to seek professional tax advice for income tax questions and assistance.
IMPORTANT NEWSLETTER DISCLOSURE:The hypothetical performance results for investment newsletters that are authored or edited by Louis Navellier, including Louis Navellier’s Growth Investor, Louis Navellier’s Breakthrough Stocks, Louis Navellier’s Accelerated Profits, and Louis Navellier’s Platinum Club, are not based on any actual securities trading, portfolio, or accounts, and the newsletters’ reported hypothetical performances should be considered mere “paper” or proforma hypothetical performance results and are not actual performance of real world trades. Navellier & Associates, Inc. does not have any relation to or affiliation with the owner of these newsletters. There are material differences between Navellier Investment Products’ portfolios and the InvestorPlace Media, LLC newsletter portfolios authored by Louis Navellier. The InvestorPlace Media, LLC newsletters contain hypothetical performance that do not include transaction costs, advisory fees, or other fees a client might incur if actual investments and trades were being made by an investor. As a result, newsletter performance should not be used to evaluate Navellier Investment services which are separate and different from the newsletters. The owner of the newsletters is InvestorPlace Media, LLC and any questions concerning the newsletters, including any newsletter advertising or hypothetical Newsletter performance claims, (which are calculated solely by Investor Place Media and not Navellier) should be referred to InvestorPlace Media, LLC at (800) 718-8289.
Please note that Navellier & Associates and the Navellier Private Client Group are managed completely independent of the newsletters owned and published by InvestorPlace Media, LLC and written and edited by Louis Navellier, and investment performance of the newsletters should in no way be considered indicative of potential future investment performance for any Navellier & Associates separately managed account portfolio. Potential investors should consult with their financial advisor before investing in any Navellier Investment Product.
Navellier claims compliance with Global Investment Performance Standards (GIPS). To receive a complete list and descriptions of Navellier’s composites and/or a presentation that adheres to the GIPS standards, please contact Navellier or click here. It should not be assumed that any securities recommendations made by Navellier & Associates, Inc. in the future will be profitable or equal the performance of securities made in this report.
FactSet Disclosure: Navellier does not independently calculate the statistical information included in the attached report. The calculation and the information are provided by FactSet, a company not related to Navellier. Although information contained in the report has been obtained from FactSet and is based on sources Navellier believes to be reliable, Navellier does not guarantee its accuracy, and it may be incomplete or condensed. The report and the related FactSet sourced information are provided on an “as is” basis. The user assumes the entire risk of any use made of this information. Investors should consider the report as only a single factor in making their investment decision. The report is for informational purposes only and is not intended as an offer or solicitation for the purchase or sale of a security. FactSet sourced information is the exclusive property of FactSet. Without prior written permission of FactSet, this information may not be reproduced, disseminated or used to create any financial products. All indices are unmanaged and performance of the indices include reinvestment of dividends and interest income, unless otherwise noted, are not illustrative of any particular investment and an investment cannot be made in any index. Past performance is no guarantee of future results.