by Jason Bodner
February 18, 2026
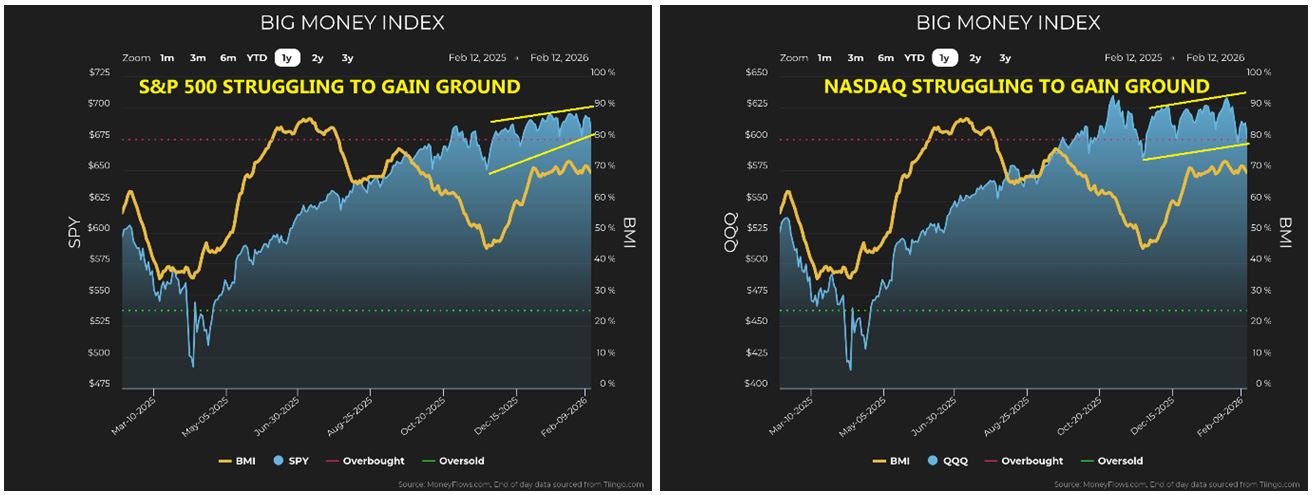
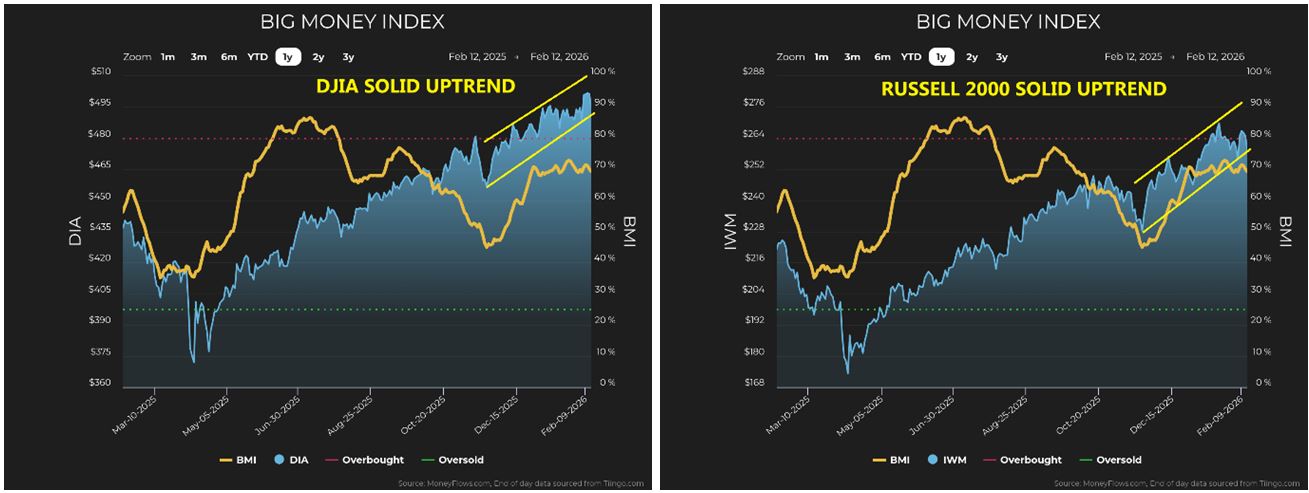
So far this year, last year’s leading indexes (NASDAQ and S&P 500) are trailing the past laggards, the Dow and Russell 2000. The S&P is flat and the NASDAQ is down, while the Dow and Russell 2000 are flying-high.We are watching some long-time assumptions getting repriced right now. This has happened before.
In 1869, the completion of the Transcontinental Railroad did not just connect America’s two-coasts. It instantly repriced distance. What once took months now took days. Fortunes were made and lost, not because the world ended, but because the nation’s economic assumptions changed drastically.
The headlines say something like, “AI is breaking software.” Some commentators are certain the technology-bubble has burst. One story making the rounds says tools like Anthropic’s Claude will render traditional software companies obsolete. Even some of the “Magnificent 7” icons are being punished.
But when I look at the data, I do not see any collapse. I see some massive rotation, plus forced liquidation.
Let’s start with the Big Money Index (BMI). After rising at the end of 2025, it stalled between roughly 68 and 72. It currently sits at 69.3, which is still outstanding. This is not what a broad market top looks like.
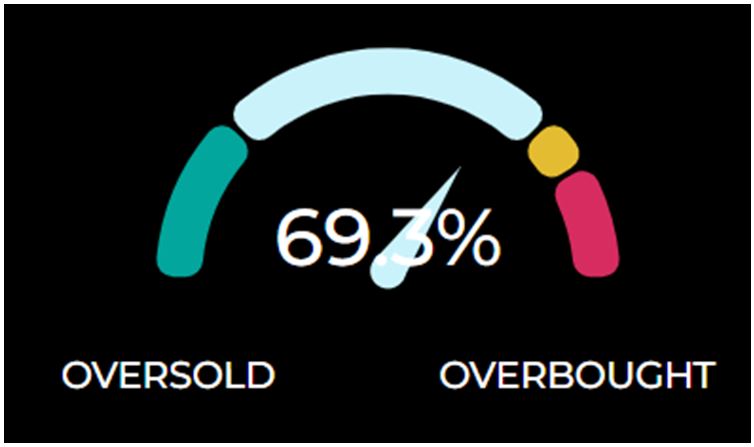
This looks more like “digestion.” Under the surface, as I stated above, leadership has shifted. The S&P 500 has struggled and the NASDAQ is flat, while past laggards (the Dow and Russell 2000) are flying-high.
Graphs are for illustrative and discussion purposes only. Please read important disclosures at the end of this commentary.
Graphs are for illustrative and discussion purposes only. Please read important disclosures at the end of this commentary.
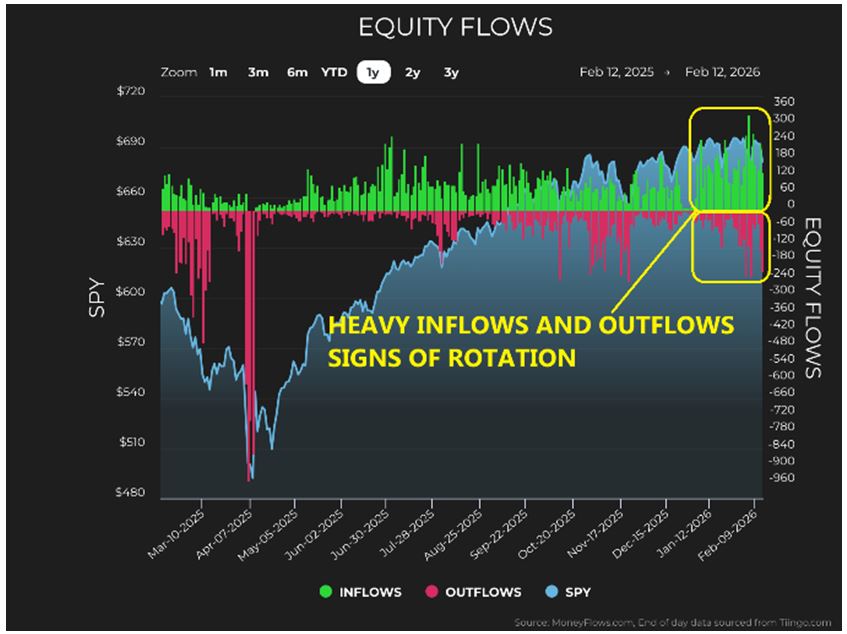
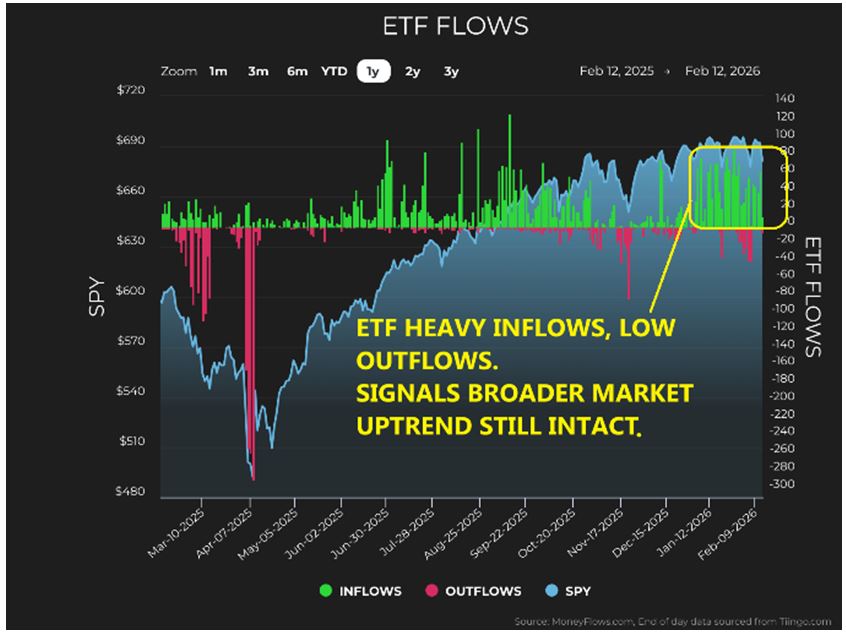
Inflows still significantly outnumber outflows, but not at the pace we saw last-year, when equity markets were flying-high. Since February 1, 62% of all Money Flows signals have been inflows vs. 38% outflows.
Graphs are for illustrative and discussion purposes only. Please read important disclosures at the end of this commentary.
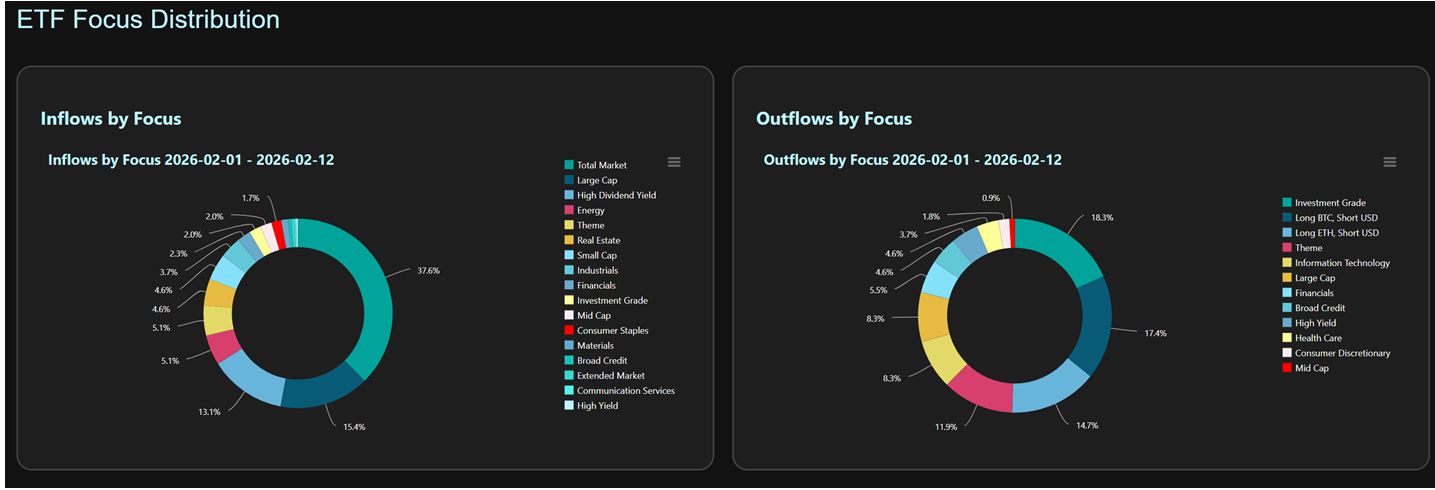
ETFs, however, show the broader uptrend remains intact, with most ETFs seeing inflows. The notable exceptions are the crypto-currency ETFs, which have seen outflows.
Graphs are for illustrative and discussion purposes only. Please read important disclosures at the end of this commentary.
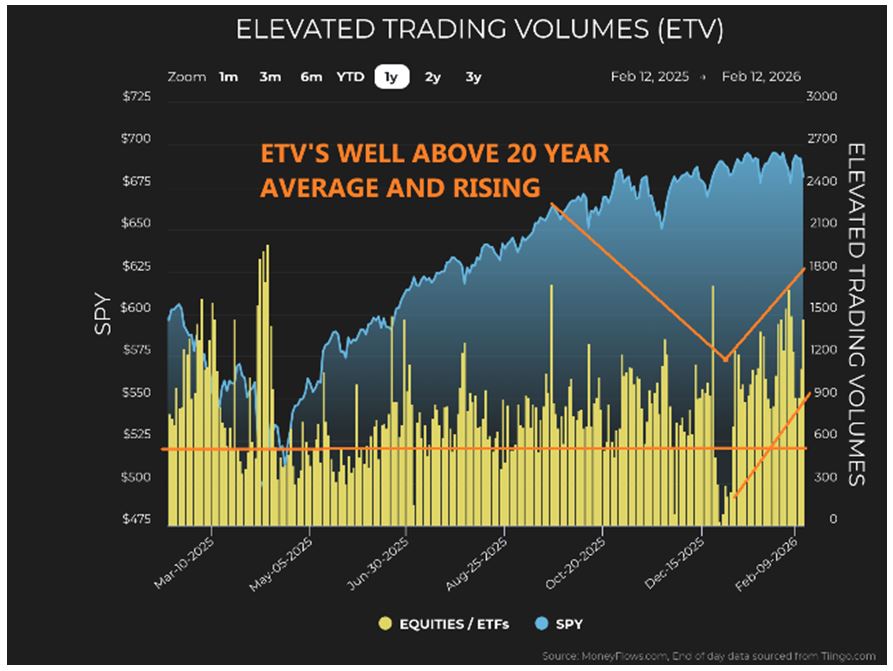
Volumes are elevated above the 20-year average and trending higher, signaling repositioning, not panic.
Graphs are for illustrative and discussion purposes only. Please read important disclosures at the end of this commentary.
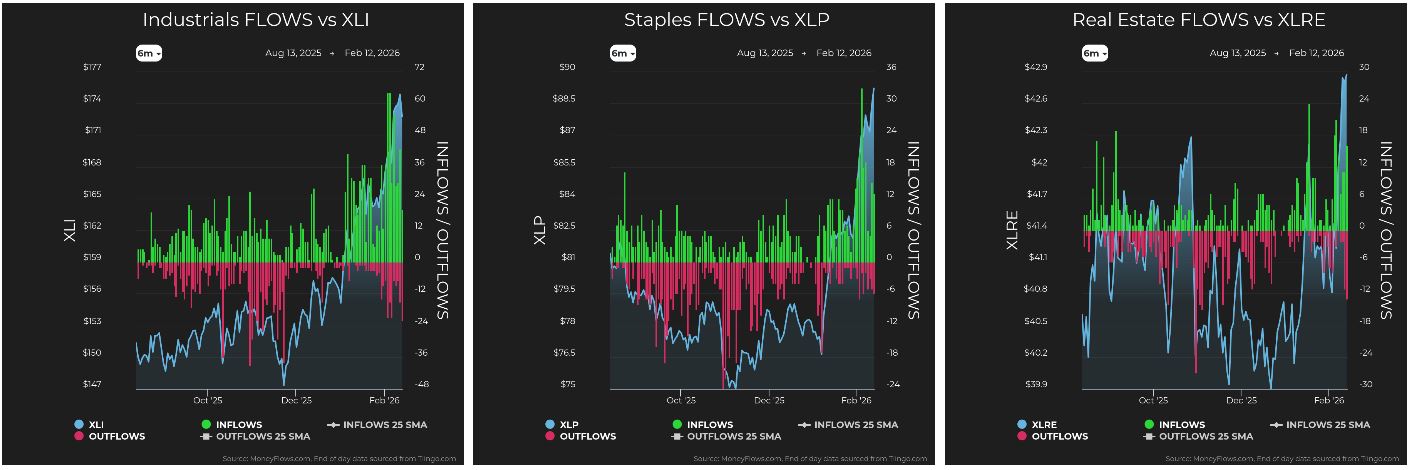
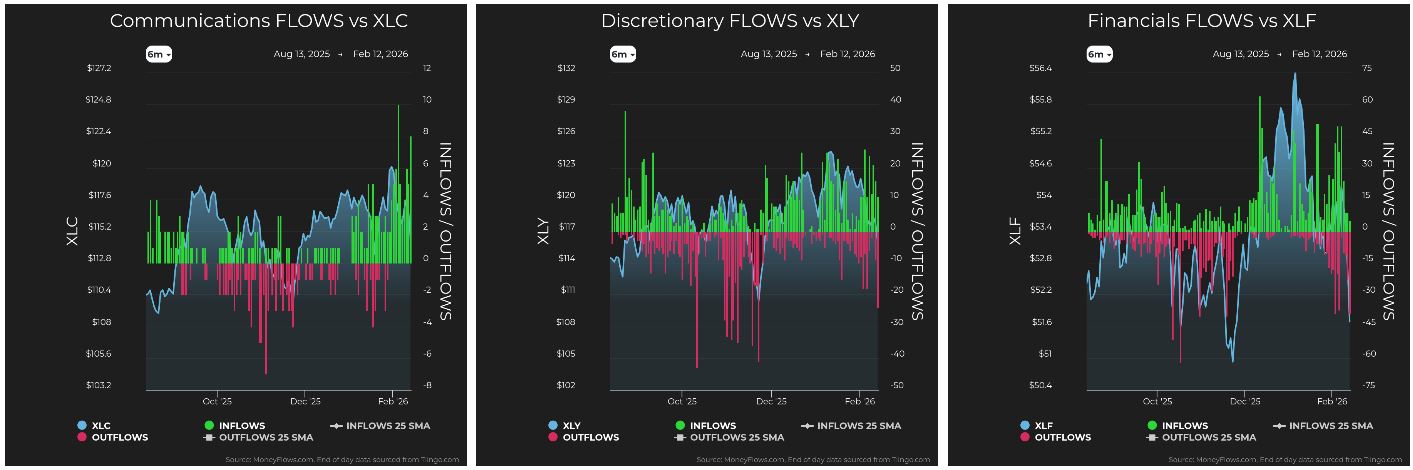
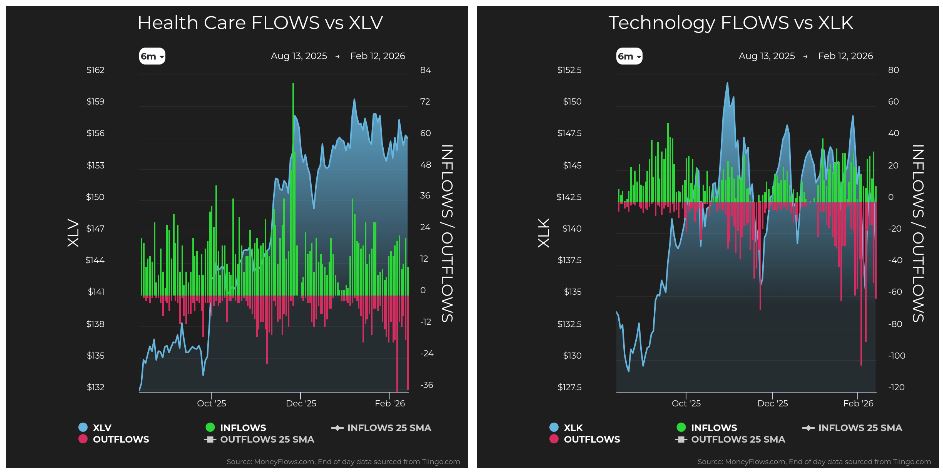
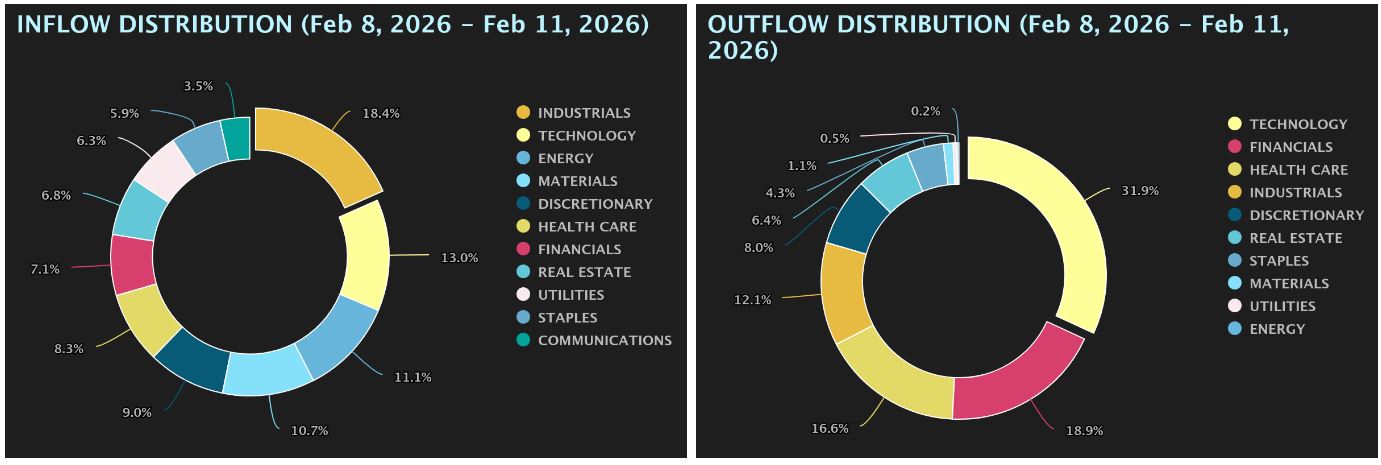
At the sector level, most sectors see inflows, with the exception of Technology and Health Care.
Graphs are for illustrative and discussion purposes only. Please read important disclosures at the end of this commentary.
Graphs are for illustrative and discussion purposes only. Please read important disclosures at the end of this commentary.
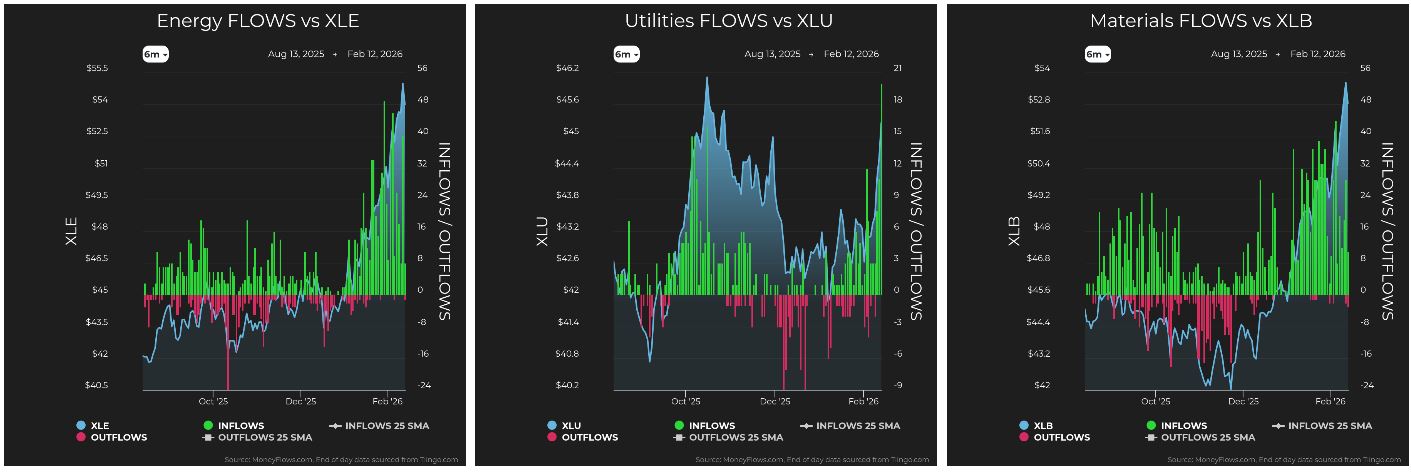
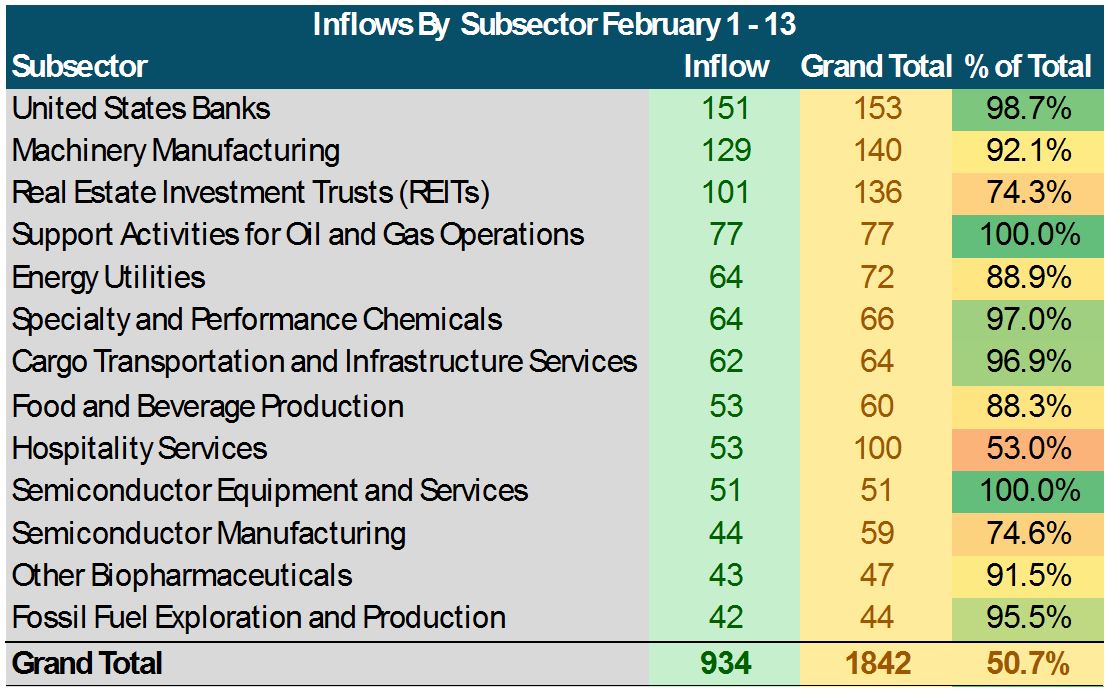
When we break sectors down further, by subsector, demand is broad across banks, manufacturing, REITs, oil and gas, chemicals, utilities, and other cyclical and value areas. Investors are chasing cyclicals and value. Even within Technology, there have been inflows into semiconductors.
Graphs are for illustrative and discussion purposes only. Please read important disclosures at the end of this commentary.
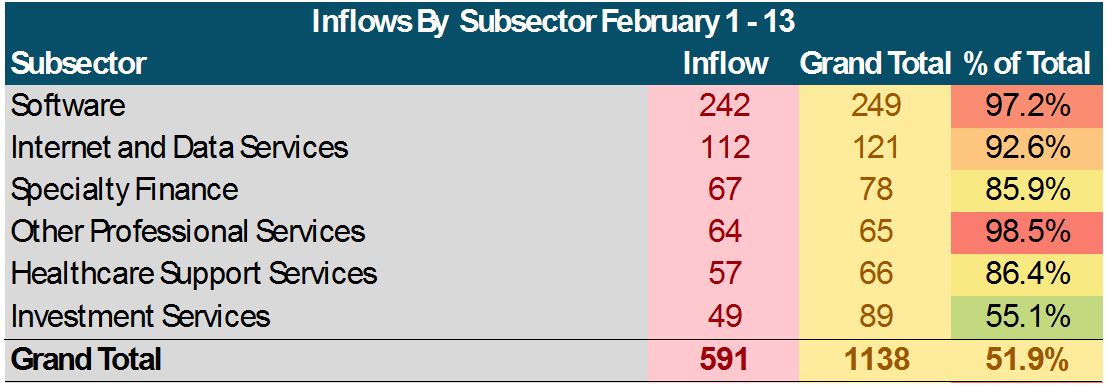
This damage appears when we examine outflows. Technology accounted for 32% of all outflows last week, and 97% of software signals since February 1st have been outflows. 92% of internet and data-services signals have been outflows, and software alone accounts for 22% of all outflow signals in this time span.
This seems to be the very definition of “concentrated pain.”
Graphs are for illustrative and discussion purposes only. Please read important disclosures at the end of this commentary.
A sick market shows investors fleeing from risk, but this is a reallocation of risk, and also an opportunity.
In one day, February 3rd, technology stocks logged 103-outflows. In 13-years of data, there have only been 13-trading days with more technology outflows. Statistically, this represents a 99.6 percentile selling event.
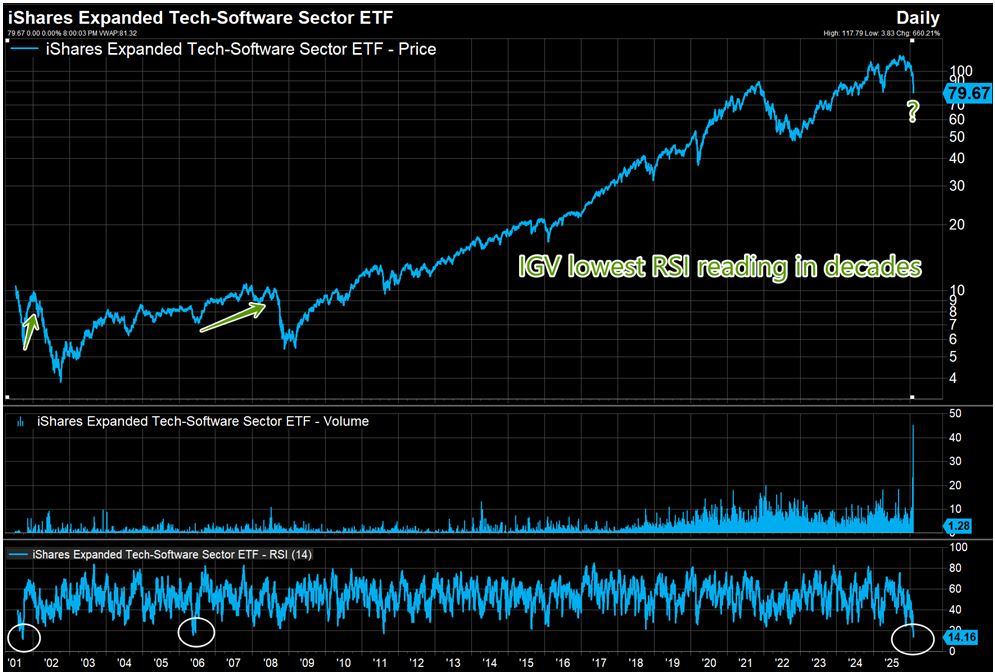
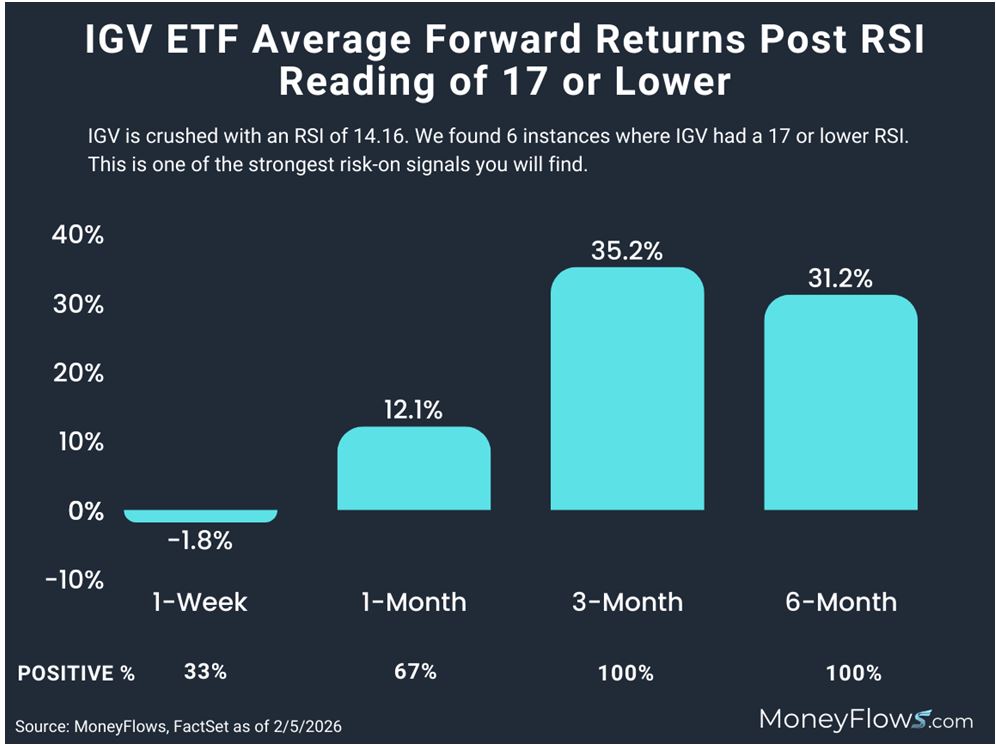
Let’s zoom in even further into the data. IGV, the iShares Expanded Technology-Software Sector ETF, just registered an RSI of 14.16. In 25-years, it has only been this oversold six-times. Each of those six-instances were followed by positive forward returns at one, three, and six-months.
Graphs are for illustrative and discussion purposes only. Please read important disclosures at the end of this commentary.
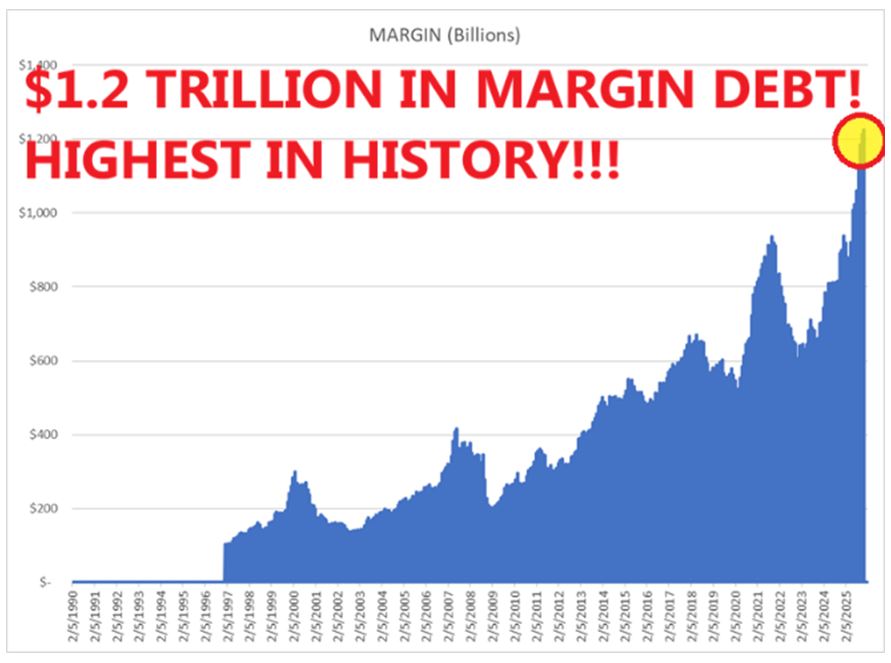
Margin debt sits at record levels. At the same time, record cash balances of $1.2-trillion are parked in money market funds, earning roughly 3.5%. This trade has been straight-forward. Investors pledge cash as collateral. They borrow at 5% to 7%, and try to out-perform in a strong market.
Graphs are for illustrative and discussion purposes only. Please read important disclosures at the end of this commentary.
Hedge funds amplify this gross exposure. A long-short fund might run 200% leverage, or 2x leverage, which can work when volatility is low, but when volatility spikes, it amplifies losses.
Bitcoin has accelerated this process. Crypto-currency margin is not regulated like equity margin, so crypto-currency liquidations can cascade quickly. When Bitcoin falls hard, leveraged players are forced to sell. They sell what other investments they can. The most liquid winners with the best gains become a liquidity source.
Software and semiconductors have been prime candidates, forcing selling creates price damage. The media then searches for a story-line. Right now, the prevailing story-line says AI will replace traditional software. Software companies are yesterday’s news, but I find this reasoning thin. AI companies are software companies. If new entrants dominate and eventually go public, they will become part of the same ecosystem. If incumbents adapt, they retain leadership. Most large software-firms are already integrating AI deeply into their offerings. Microsoft is not ignoring AI. It is investing heavily in it.
The forecast of AI eliminating software is like saying electricity will eliminate industry. No, electricity enhanced and reshaped industry, rewarding those who adapted. This is not a “death of technology.”
Cyclicals and value stocks are catching bids. Banks, industrials, energy, materials, REITs, and utilities see steady inflows. Semiconductors are still attracting capital. The broader market is rotating, not collapsing.
When 97% of signals in software are outflows and an ETF like IGV is at a generational RSI extreme, risk reward begins to shift. Look at the forward returns in similar events:
Graphs are for illustrative and discussion purposes only. Please read important disclosures at the end of this commentary.
This does not mean selling cannot persist for a while longer. It could, but deleveraging can overshoot and air-pockets can get more violent. Asymmetry tends to emerge when software selling reaches epic levels.
I have been adding software exposure recently, not blindly, but selectively. With a multi-year lens. I view IGV as being unfairly punished by a narrative which seems to me convenient, but shallow. I believe high quality stalwarts fall due to forced flows. Stocks like MSFT represent opportunity, not obsolescence.
The broader uptrend remains intact. Inflows still outnumber outflows. Sector rotation is uncomfortable but normal. Extreme concentration of outflows in one subsector is not a sign of a prolonged bear-market.
Distance was repriced after 1869. Assumptions were shattered. Those who understood the structural shift prospered. Those who reacted emotionally to volatility often did not. Today, the impediment is forced selling and fear around AI disruption, and this may be precisely where the opportunity lies.
“You have power over your mind, not outside events. Realize this, and you will find strength.”
— Marcus Aurelius
All content above represents the opinion of Jason Bodner of Navellier & Associates, Inc.
Also In This Issue
A Look Ahead by Louis Navellier
A New Era at the Fed is About to Begin
Income Mail by Bryan Perry
Energy Infrastructure Stocks are in Rally Mode
Growth Mail by Gary Alexander
A President’s Day Retrospective on How Politics Impact Markets
Global Mail by Ivan Martchev
The NASDAQ 100’s Gravitational Pull
Sector Spotlight by Jason Bodner
Major Market Indexes Have Defied Expectations – So Far in 2026
View Full Archive
Read Past Issues Here

Jason Bodner
MARKETMAIL EDITOR FOR SECTOR SPOTLIGHT
Jason Bodner writes Sector Spotlight in the weekly Marketmail publication and has authored several white papers for the company. He is also Co-Founder of Macro Analytics for Professionals which produces proprietary equity accumulation and distribution research for its clients. Previously, Mr. Bodner served as Director of European Equity Derivatives for Cantor Fitzgerald Europe in London, then moved to the role of Head of Equity Derivatives North America for the same company in New York. He also served as S.V.P. Equity Derivatives for Jefferies, LLC. He received a B.S. in business administration in 1996, with honors, from Skidmore College as a member of the Periclean Honors Society. All content of “Sector Spotlight” represents the opinion of Jason Bodner
Important Disclosures:
Jason Bodner is a co-founder and co-owner of Mapsignals. Mr. Bodner is an independent contractor who is occasionally hired by Navellier & Associates to write an article and or provide opinions for possible use in articles that appear in Navellier & Associates weekly Market Mail. Mr. Bodner is not employed or affiliated with Louis Navellier, Navellier & Associates, Inc., or any other Navellier owned entity. The opinions and statements made here are those of Mr. Bodner and not necessarily those of any other persons or entities. This is not an endorsement, or solicitation or testimonial or investment advice regarding the BMI Index or any statements or recommendations or analysis in the article or the BMI Index or Mapsignals or its products or strategies.
Although information in these reports has been obtained from and is based upon sources that Navellier believes to be reliable, Navellier does not guarantee its accuracy and it may be incomplete or condensed. All opinions and estimates constitute Navellier’s judgment as of the date the report was created and are subject to change without notice. These reports are for informational purposes only and are not a solicitation for the purchase or sale of a security. Any decision to purchase securities mentioned in these reports must take into account existing public information on such securities or any registered prospectus.To the extent permitted by law, neither Navellier & Associates, Inc., nor any of its affiliates, agents, or service providers assumes any liability or responsibility nor owes any duty of care for any consequences of any person acting or refraining to act in reliance on the information contained in this communication or for any decision based on it.
Past performance is no indication of future results. Investment in securities involves significant risk and has the potential for partial or complete loss of funds invested. It should not be assumed that any securities recommendations made by Navellier. in the future will be profitable or equal the performance of securities made in this report. Dividend payments are not guaranteed. The amount of a dividend payment, if any, can vary over time and issuers may reduce dividends paid on securities in the event of a recession or adverse event affecting a specific industry or issuer.
None of the stock information, data, and company information presented herein constitutes a recommendation by Navellier or a solicitation to buy or sell any securities. Any specific securities identified and described do not represent all of the securities purchased, sold, or recommended for advisory clients. The holdings identified do not represent all of the securities purchased, sold, or recommended for advisory clients and the reader should not assume that investments in the securities identified and discussed were or will be profitable.
Information presented is general information that does not take into account your individual circumstances, financial situation, or needs, nor does it present a personalized recommendation to you. Individual stocks presented may not be suitable for every investor. Investment in securities involves significant risk and has the potential for partial or complete loss of funds invested. Investment in fixed income securities has the potential for the investment return and principal value of an investment to fluctuate so that an investor’s holdings, when redeemed, may be worth less than their original cost.
One cannot invest directly in an index. Index is unmanaged and index performance does not reflect deduction of fees, expenses, or taxes. Presentation of Index data does not reflect a belief by Navellier that any stock index constitutes an investment alternative to any Navellier equity strategy or is necessarily comparable to such strategies. Among the most important differences between the Indices and Navellier strategies are that the Navellier equity strategies may (1) incur material management fees, (2) concentrate its investments in relatively few stocks, industries, or sectors, (3) have significantly greater trading activity and related costs, and (4) be significantly more or less volatile than the Indices.
ETF Risk: We may invest in exchange traded funds (“ETFs”) and some of our investment strategies are generally fully invested in ETFs. Like traditional mutual funds, ETFs charge asset-based fees, but they generally do not charge initial sales charges or redemption fees and investors typically pay only customary brokerage fees to buy and sell ETF shares. The fees and costs charged by ETFs held in client accounts will not be deducted from the compensation the client pays Navellier. ETF prices can fluctuate up or down, and a client account could lose money investing in an ETF if the prices of the securities owned by the ETF go down. ETFs are subject to additional risks:
- ETF shares may trade above or below their net asset value;
- An active trading market for an ETF’s shares may not develop or be maintained;
- The value of an ETF may be more volatile than the underlying portfolio of securities the ETF is designed to track;
- The cost of owning shares of the ETF may exceed those a client would incur by directly investing in the underlying securities and;
- Trading of an ETF’s shares may be halted if the listing exchange’s officials deem it appropriate, the shares are delisted from the exchange, or the activation of market-wide “circuit breakers” (which are tied to large decreases in stock prices) halts stock trading generally.
Grader Disclosures: Investment in equity strategies involves substantial risk and has the potential for partial or complete loss of funds invested. The sample portfolio and any accompanying charts are for informational purposes only and are not to be construed as a solicitation to buy or sell any financial instrument and should not be relied upon as the sole factor in an investment making decision. As a matter of normal and important disclosures to you, as a potential investor, please consider the following: The performance presented is not based on any actual securities trading, portfolio, or accounts, and the reported performance of the A, B, C, D, and F portfolios (collectively the “model portfolios”) should be considered mere “paper” or pro forma performance results based on Navellier’s research.
Investors evaluating any of Navellier & Associates, Inc.’s, (or its affiliates’) Investment Products must not use any information presented here, including the performance figures of the model portfolios, in their evaluation of any Navellier Investment Products. Navellier Investment Products include the firm’s mutual funds and managed accounts. The model portfolios, charts, and other information presented do not represent actual funded trades and are not actual funded portfolios. There are material differences between Navellier Investment Products’ portfolios and the model portfolios, research, and performance figures presented here. The model portfolios and the research results (1) may contain stocks or ETFs that are illiquid and difficult to trade; (2) may contain stock or ETF holdings materially different from actual funded Navellier Investment Product portfolios; (3) include the reinvestment of all dividends and other earnings, estimated trading costs, commissions, or management fees; and, (4) may not reflect prices obtained in an actual funded Navellier Investment Product portfolio. For these and other reasons, the reported performances of model portfolios do not reflect the performance results of Navellier’s actually funded and traded Investment Products. In most cases, Navellier’s Investment Products have materially lower performance results than the performances of the model portfolios presented.
This report contains statements that are, or may be considered to be, forward-looking statements. All statements that are not historical facts, including statements about our beliefs or expectations, are “forward-looking statements” within the meaning of The U.S. Private Securities Litigation Reform Act of 1995. These statements may be identified by such forward-looking terminology as “expect,” “estimate,” “plan,” “intend,” “believe,” “anticipate,” “may,” “will,” “should,” “could,” “continue,” “project,” or similar statements or variations of such terms. Our forward-looking statements are based on a series of expectations, assumptions, and projections, are not guarantees of future results or performance, and involve substantial risks and uncertainty as described in Form ADV Part 2A of our filing with the Securities and Exchange Commission (SEC), which is available at www.adviserinfo.sec.gov or by requesting a copy by emailing info@navellier.com. All of our forward-looking statements are as of the date of this report only. We can give no assurance that such expectations or forward-looking statements will prove to be correct. Actual results may differ materially. You are urged to carefully consider all such factors.
FEDERAL TAX ADVICE DISCLAIMER: As required by U.S. Treasury Regulations, you are informed that, to the extent this presentation includes any federal tax advice, the presentation is not written by Navellier to be used, and cannot be used, for the purpose of avoiding federal tax penalties. Navellier does not advise on any income tax requirements or issues. Use of any information presented by Navellier is for general information only and does not represent tax advice either express or implied. You are encouraged to seek professional tax advice for income tax questions and assistance.
IMPORTANT NEWSLETTER DISCLOSURE:The hypothetical performance results for investment newsletters that are authored or edited by Louis Navellier, including Louis Navellier’s Growth Investor, Louis Navellier’s Breakthrough Stocks, Louis Navellier’s Accelerated Profits, and Louis Navellier’s Platinum Club, are not based on any actual securities trading, portfolio, or accounts, and the newsletters’ reported hypothetical performances should be considered mere “paper” or proforma hypothetical performance results and are not actual performance of real world trades. Navellier & Associates, Inc. does not have any relation to or affiliation with the owner of these newsletters. There are material differences between Navellier Investment Products’ portfolios and the InvestorPlace Media, LLC newsletter portfolios authored by Louis Navellier. The InvestorPlace Media, LLC newsletters contain hypothetical performance that do not include transaction costs, advisory fees, or other fees a client might incur if actual investments and trades were being made by an investor. As a result, newsletter performance should not be used to evaluate Navellier Investment services which are separate and different from the newsletters. The owner of the newsletters is InvestorPlace Media, LLC and any questions concerning the newsletters, including any newsletter advertising or hypothetical Newsletter performance claims, (which are calculated solely by Investor Place Media and not Navellier) should be referred to InvestorPlace Media, LLC at (800) 718-8289.
Please note that Navellier & Associates and the Navellier Private Client Group are managed completely independent of the newsletters owned and published by InvestorPlace Media, LLC and written and edited by Louis Navellier, and investment performance of the newsletters should in no way be considered indicative of potential future investment performance for any Navellier & Associates separately managed account portfolio. Potential investors should consult with their financial advisor before investing in any Navellier Investment Product.
Navellier claims compliance with Global Investment Performance Standards (GIPS). To receive a complete list and descriptions of Navellier’s composites and/or a presentation that adheres to the GIPS standards, please contact Navellier or click here. It should not be assumed that any securities recommendations made by Navellier & Associates, Inc. in the future will be profitable or equal the performance of securities made in this report.
FactSet Disclosure: Navellier does not independently calculate the statistical information included in the attached report. The calculation and the information are provided by FactSet, a company not related to Navellier. Although information contained in the report has been obtained from FactSet and is based on sources Navellier believes to be reliable, Navellier does not guarantee its accuracy, and it may be incomplete or condensed. The report and the related FactSet sourced information are provided on an “as is” basis. The user assumes the entire risk of any use made of this information. Investors should consider the report as only a single factor in making their investment decision. The report is for informational purposes only and is not intended as an offer or solicitation for the purchase or sale of a security. FactSet sourced information is the exclusive property of FactSet. Without prior written permission of FactSet, this information may not be reproduced, disseminated or used to create any financial products. All indices are unmanaged and performance of the indices include reinvestment of dividends and interest income, unless otherwise noted, are not illustrative of any particular investment and an investment cannot be made in any index. Past performance is no guarantee of future results.