by Gary Alexander
February 10, 2026
Last Friday, the Dow Jones Industrial Average broke the 50,000 barrier for the first time. Will the Dow just sail on toward 60,000, or will it take some time to digest the stability of this new “floor” at 50,000?
How well I remember the first time the Dow Industrials broke 1,000, back in my college years when I was actively studying economics and markets for the first time. Alas, 1966 was the start of a 16-year struggle.
Here’s the story of those 16 years it took for the Dow to surpass its psychological 1,000 barrier for good:
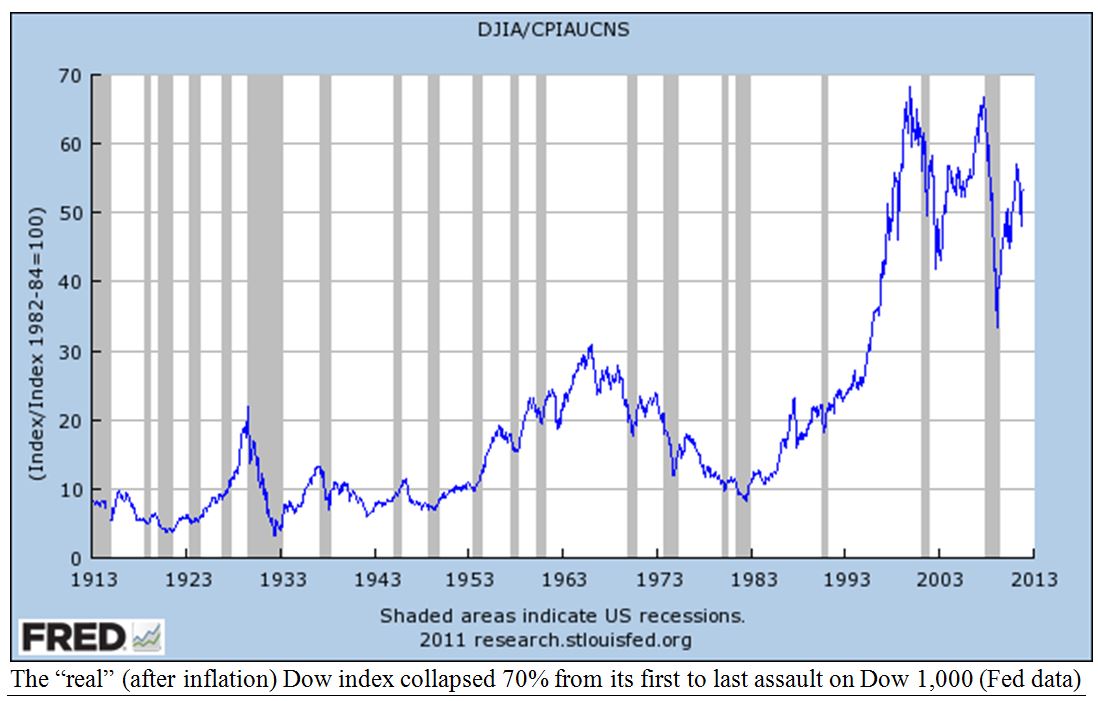
- 60-years ago yesterday – February 9, 1966 – the Dow first topped 1,000, intra-day, but it then closed at 995 by the end of the day, so we had to wait until 1972 for the first close over 1,000, as the Dow careened down to 631 in 1970 before making its second assault at the four-digit barrier in late 1972.
- The Dow closed above 1,000 for 48-straight trading days from November 14, 1972, to January 24, 1973, peaking at 1,051.7 on January 11, 1973, before falling to a lower low of 577.60 in late 1974.
- Eight-years later, the Dow crossed 1,000 for 10-straight days in April 1981, falling to 777 in 1982.
- FINALLY, on November 23, 1982, the Dow closed below 1,000 for the final-time, at 990.99.
So, it took the Dow index nearly 17-years from its first flirtation with 1,000 before topping 1,000 for good – and this was during a time when inflation more than tripled, so 1,000 in 1982 was like 3,000 in 1965.
Graphs are for illustrative and discussion purposes only. Please read important disclosures at the end of this commentary.
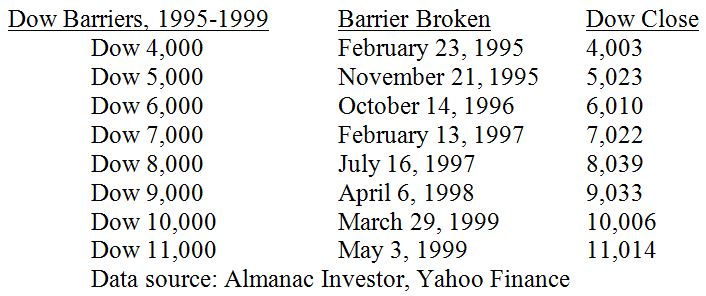
I have worked full-time in the financial newsletter business since 1980, so I recall clearly a series of Dow barriers, especially in the 1990s. First, the Dow flirted with 3,000. with a double-top top of Dow 2,999.75 for two days in a row (July 16 and 17, 1990) before falling 21% to 2,365 on October 8 due to Gulf War 1.
Another major flirtation with high numbers came on January 31, 1994, when the Dow assaulted 4,000 for a week (closing at 3,978 on January 31, and 3,975 on February 1) before Alan Greenspan raised the Fed’s interest rate on Friday, February 4 – the first of seven Fed rate increases in the next year. The Dow did not return to 4,000 for over a year (in mid-March 1995), which brings me to a shocking 1994 prediction.
In 1994, I was editing a wonderful investment advisor and partner in the launch of his global investment letter and Dream Swiss Seminars. In the summer of 1994, with the Dow at 3,700, this conservative value investing money manager headlined his newsletter, “Dow 7,000 By 1997.” I normally let my experienced advisors choose their own stocks and predictions, but this one time, I unburdened a twinge of cowardice.
I urged him to reconsider: “Why Say 7,000? Surely 5,000 is a strong enough prediction.” He responded:
“Nope, 7,000. The market is ready for a massive move upward, breaking out of a bearish trading range.”
As it turned out, the Dow more than doubled to 8,000+ in three years, by mid-1997.
The Silliest Investment Question … “Why Did the Market Rise (or Fall) Today?”
When someone hears you work in finance, they want to know why the market went down (or up) today.
I don’t know how professional money managers handle this repetitive query about the market’s daily moves, but I’d say Louis Navellier and Jason Bodner on our Market Mail team put it best, when Louis says (on down days), “The market got up on the wrong side of the bed today” or (on up days), “The market got its mojo back.” Some advisors wax eloquent with all kinds of technical indicators, but Louie’s phrases on “waking up grouchy” or “getting its mojo back” catch the manic-depressive nature of traders.
Also, I like the data Jason Bodner brings us about big money buying and selling, in his Big Money Index (BMI). The reasons for their buying or selling are best known to those traders, but others cite a “risk-on” (bullish) or “risk-off” (bearish) mood, as if market risks (or world war risks) flip heads or tails, daily.
Last week, for instance, the market rose on Monday and Friday (heads, I win), and it fell in the middle of the week (tails, you lose). My dear wife asked me on Thursday night why the market fell. My answer was “More sellers than buyers.” Asked for details, I guessed right, “It will probably bounce back tomorrow.”
Yep, Friday was a reversion-to-mean recovery, as daily swings mean very little to buy-and-hold investors.
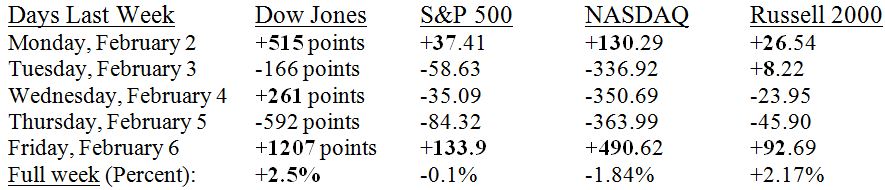
Obviously, last week’s surge was almost all based on Friday – with only the Dow Index and Russell rising. The S&P 500 and NASDAQ were down three-days in a row and down for the week as a whole.
The Dow’s 30-stocks are no longer a valid measure of “the market,” but the press loves big numbers!
So, was the market up or down last week? A lot of both, by sector and stock, as part of a massive rotation.
If you want some more convincing answers, let’s go to AI for a definitive answer. I asked these robots why the market went down last Thursday. Their answer: “The stock market fell on Thursday, February 5, 2026, marking a third-consecutive day of losses, driven primarily by a deepening technology-sector sell-off, concerns over artificial intelligence (AI) spending, and weak labor data. The S&P 500 dropped 1.2%, the NASDAQ Composite fell 1.6%, and the Dow Jones Industrial Average shed 1.2% (roughly 593-points).”
Then, when the market recovered on Friday, I asked the same disembodied geniuses why it happened. AI: “The stock market surged on February 6, 2026, with the Dow Jones Industrial Average surpassing 50,000 for the first time, driven by a rebound in battered technology, AI, and chip stocks. Investors bought the dip following a volatile week, supported by strong corporate earnings and positive consumer sentiment.”
Wow! This super-hyped AI genius tells me there is a “deepening tech-sector sell off” and “concerns over AI spending” Thursday, then “a rebound in battered technology, AI and chip stocks” on Friday. It’s “risk-off” one day, then “risk-on.” No wonder I don’t follow daily markets. Real trends come in chunks of one-year or more. It’s the same with jobs data, GDP and other key indicators. Look at the 12-month (full-year) track record, not daily, weekly or monthly “head fakes” from government data or stock market mood swings.
All content above represents the opinion of Gary Alexander of Navellier & Associates, Inc.
Also In This Issue
A Look Ahead by Louis Navellier
Why I Think Gold Will Reach $10,000 by the End of 2029
Income Mail by Bryan Perry
We’re Seeing a Perfect Tailwind for Convertible Debt
Growth Mail by Gary Alexander
At Dow 50k, Will We Fear “Big Numbers” Again?
Global Mail by Ivan Martchev
The Iranian Issue Is Far from Resolved
Sector Spotlight by Jason Bodner
Most of the Time, Reasons for Market Moves are Not Obvious
View Full Archive
Read Past Issues Here
About The Author

Gary Alexander
SENIOR EDITOR
Gary Alexander has been Senior Writer at Navellier since 2009. He edits Navellier’s weekly Marketmail and writes a weekly Growth Mail column, in which he uses market history to support the case for growth stocks. For the previous 20-years before joining Navellier, he was Senior Executive Editor at InvestorPlace Media (formerly Phillips Publishing), where he worked with several leading investment analysts, including Louis Navellier (since 1997), helping launch Louis Navellier’s Blue Chip Growth and Global Growth newsletters.
Prior to that, Gary edited Wealth Magazine and Gold Newsletter and wrote various investment research reports for Jefferson Financial in New Orleans in the 1980s. He began his financial newsletter career with KCI Communications in 1980, where he served as consulting editor for Personal Finance newsletter while serving as general manager of KCI’s Alexandria House book division. Before that, he covered the economics beat for news magazines. All content of “Growth Mail” represents the opinion of Gary Alexander
Important Disclosures:
Although information in these reports has been obtained from and is based upon sources that Navellier believes to be reliable, Navellier does not guarantee its accuracy and it may be incomplete or condensed. All opinions and estimates constitute Navellier’s judgment as of the date the report was created and are subject to change without notice. These reports are for informational purposes only and are not a solicitation for the purchase or sale of a security. Any decision to purchase securities mentioned in these reports must take into account existing public information on such securities or any registered prospectus.To the extent permitted by law, neither Navellier & Associates, Inc., nor any of its affiliates, agents, or service providers assumes any liability or responsibility nor owes any duty of care for any consequences of any person acting or refraining to act in reliance on the information contained in this communication or for any decision based on it.
Past performance is no indication of future results. Investment in securities involves significant risk and has the potential for partial or complete loss of funds invested. It should not be assumed that any securities recommendations made by Navellier. in the future will be profitable or equal the performance of securities made in this report. Dividend payments are not guaranteed. The amount of a dividend payment, if any, can vary over time and issuers may reduce dividends paid on securities in the event of a recession or adverse event affecting a specific industry or issuer.
None of the stock information, data, and company information presented herein constitutes a recommendation by Navellier or a solicitation to buy or sell any securities. Any specific securities identified and described do not represent all of the securities purchased, sold, or recommended for advisory clients. The holdings identified do not represent all of the securities purchased, sold, or recommended for advisory clients and the reader should not assume that investments in the securities identified and discussed were or will be profitable.
Information presented is general information that does not take into account your individual circumstances, financial situation, or needs, nor does it present a personalized recommendation to you. Individual stocks presented may not be suitable for every investor. Investment in securities involves significant risk and has the potential for partial or complete loss of funds invested. Investment in fixed income securities has the potential for the investment return and principal value of an investment to fluctuate so that an investor’s holdings, when redeemed, may be worth less than their original cost.
One cannot invest directly in an index. Index is unmanaged and index performance does not reflect deduction of fees, expenses, or taxes. Presentation of Index data does not reflect a belief by Navellier that any stock index constitutes an investment alternative to any Navellier equity strategy or is necessarily comparable to such strategies. Among the most important differences between the Indices and Navellier strategies are that the Navellier equity strategies may (1) incur material management fees, (2) concentrate its investments in relatively few stocks, industries, or sectors, (3) have significantly greater trading activity and related costs, and (4) be significantly more or less volatile than the Indices.
ETF Risk: We may invest in exchange traded funds (“ETFs”) and some of our investment strategies are generally fully invested in ETFs. Like traditional mutual funds, ETFs charge asset-based fees, but they generally do not charge initial sales charges or redemption fees and investors typically pay only customary brokerage fees to buy and sell ETF shares. The fees and costs charged by ETFs held in client accounts will not be deducted from the compensation the client pays Navellier. ETF prices can fluctuate up or down, and a client account could lose money investing in an ETF if the prices of the securities owned by the ETF go down. ETFs are subject to additional risks:
- ETF shares may trade above or below their net asset value;
- An active trading market for an ETF’s shares may not develop or be maintained;
- The value of an ETF may be more volatile than the underlying portfolio of securities the ETF is designed to track;
- The cost of owning shares of the ETF may exceed those a client would incur by directly investing in the underlying securities; and
- Trading of an ETF’s shares may be halted if the listing exchange’s officials deem it appropriate, the shares are delisted from the exchange, or the activation of market-wide “circuit breakers” (which are tied to large decreases in stock prices) halts stock trading generally.
Grader Disclosures: Investment in equity strategies involves substantial risk and has the potential for partial or complete loss of funds invested. The sample portfolio and any accompanying charts are for informational purposes only and are not to be construed as a solicitation to buy or sell any financial instrument and should not be relied upon as the sole factor in an investment making decision. As a matter of normal and important disclosures to you, as a potential investor, please consider the following: The performance presented is not based on any actual securities trading, portfolio, or accounts, and the reported performance of the A, B, C, D, and F portfolios (collectively the “model portfolios”) should be considered mere “paper” or pro forma performance results based on Navellier’s research.
Investors evaluating any of Navellier & Associates, Inc.’s, (or its affiliates’) Investment Products must not use any information presented here, including the performance figures of the model portfolios, in their evaluation of any Navellier Investment Products. Navellier Investment Products include the firm’s mutual funds and managed accounts. The model portfolios, charts, and other information presented do not represent actual funded trades and are not actual funded portfolios. There are material differences between Navellier Investment Products’ portfolios and the model portfolios, research, and performance figures presented here. The model portfolios and the research results (1) may contain stocks or ETFs that are illiquid and difficult to trade; (2) may contain stock or ETF holdings materially different from actual funded Navellier Investment Product portfolios; (3) include the reinvestment of all dividends and other earnings, estimated trading costs, commissions, or management fees; and, (4) may not reflect prices obtained in an actual funded Navellier Investment Product portfolio. For these and other reasons, the reported performances of model portfolios do not reflect the performance results of Navellier’s actually funded and traded Investment Products. In most cases, Navellier’s Investment Products have materially lower performance results than the performances of the model portfolios presented.
This report contains statements that are, or may be considered to be, forward-looking statements. All statements that are not historical facts, including statements about our beliefs or expectations, are “forward-looking statements” within the meaning of The U.S. Private Securities Litigation Reform Act of 1995. These statements may be identified by such forward-looking terminology as “expect,” “estimate,” “plan,” “intend,” “believe,” “anticipate,” “may,” “will,” “should,” “could,” “continue,” “project,” or similar statements or variations of such terms. Our forward-looking statements are based on a series of expectations, assumptions, and projections, are not guarantees of future results or performance, and involve substantial risks and uncertainty as described in Form ADV Part 2A of our filing with the Securities and Exchange Commission (SEC), which is available at www.adviserinfo.sec.gov or by requesting a copy by emailing info@navellier.com. All of our forward-looking statements are as of the date of this report only. We can give no assurance that such expectations or forward-looking statements will prove to be correct. Actual results may differ materially. You are urged to carefully consider all such factors.
FEDERAL TAX ADVICE DISCLAIMER: As required by U.S. Treasury Regulations, you are informed that, to the extent this presentation includes any federal tax advice, the presentation is not written by Navellier to be used, and cannot be used, for the purpose of avoiding federal tax penalties. Navellier does not advise on any income tax requirements or issues. Use of any information presented by Navellier is for general information only and does not represent tax advice either express or implied. You are encouraged to seek professional tax advice for income tax questions and assistance.
IMPORTANT NEWSLETTER DISCLOSURE:The hypothetical performance results for investment newsletters that are authored or edited by Louis Navellier, including Louis Navellier’s Growth Investor, Louis Navellier’s Breakthrough Stocks, Louis Navellier’s Accelerated Profits, and Louis Navellier’s Platinum Club, are not based on any actual securities trading, portfolio, or accounts, and the newsletters’ reported hypothetical performances should be considered mere “paper” or proforma hypothetical performance results and are not actual performance of real world trades. Navellier & Associates, Inc. does not have any relation to or affiliation with the owner of these newsletters. There are material differences between Navellier Investment Products’ portfolios and the InvestorPlace Media, LLC newsletter portfolios authored by Louis Navellier. The InvestorPlace Media, LLC newsletters contain hypothetical performance that do not include transaction costs, advisory fees, or other fees a client might incur if actual investments and trades were being made by an investor. As a result, newsletter performance should not be used to evaluate Navellier Investment services which are separate and different from the newsletters. The owner of the newsletters is InvestorPlace Media, LLC and any questions concerning the newsletters, including any newsletter advertising or hypothetical Newsletter performance claims, (which are calculated solely by Investor Place Media and not Navellier) should be referred to InvestorPlace Media, LLC at (800) 718-8289.
Please note that Navellier & Associates and the Navellier Private Client Group are managed completely independent of the newsletters owned and published by InvestorPlace Media, LLC and written and edited by Louis Navellier, and investment performance of the newsletters should in no way be considered indicative of potential future investment performance for any Navellier & Associates separately managed account portfolio. Potential investors should consult with their financial advisor before investing in any Navellier Investment Product.
Navellier claims compliance with Global Investment Performance Standards (GIPS). To receive a complete list and descriptions of Navellier’s composites and/or a presentation that adheres to the GIPS standards, please contact Navellier or click here. It should not be assumed that any securities recommendations made by Navellier & Associates, Inc. in the future will be profitable or equal the performance of securities made in this report.
FactSet Disclosure: Navellier does not independently calculate the statistical information included in the attached report. The calculation and the information are provided by FactSet, a company not related to Navellier. Although information contained in the report has been obtained from FactSet and is based on sources Navellier believes to be reliable, Navellier does not guarantee its accuracy, and it may be incomplete or condensed. The report and the related FactSet sourced information are provided on an “as is” basis. The user assumes the entire risk of any use made of this information. Investors should consider the report as only a single factor in making their investment decision. The report is for informational purposes only and is not intended as an offer or solicitation for the purchase or sale of a security. FactSet sourced information is the exclusive property of FactSet. Without prior written permission of FactSet, this information may not be reproduced, disseminated or used to create any financial products. All indices are unmanaged and performance of the indices include reinvestment of dividends and interest income, unless otherwise noted, are not illustrative of any particular investment and an investment cannot be made in any index. Past performance is no guarantee of future results.