by Jason Bodner
December 9, 2025
Led Zeppelin’s great Rain Song said: “Upon us all a little rain must fall.” Decades before that classic song, the Ink Spots and Ella Fitzgerald delivered the same message: “Into each life some rain must fall…”
November, like many recent months, was an uncharacteristically stormy month. And storms can be so powerful that they can briefly create anti-matter. Lightning accelerates electrons so violently that they emit gamma-rays, which form positrons – even if for only a fraction of a second.
Markets can behave the same way. Normal-looking turbulence can mask deeper forces. November was a perfect example of how something appears threatening may have a much simpler explanation in the data.
The good news is that I’m here to tell you that the storm has passed.
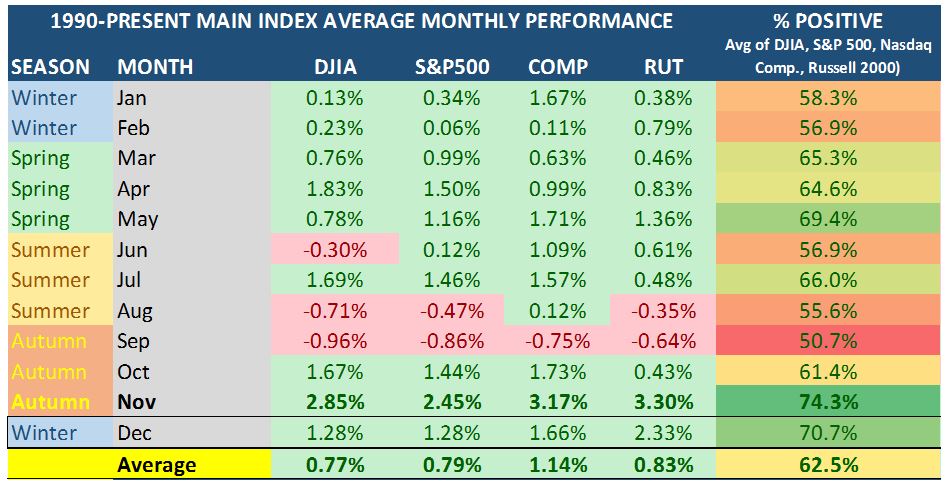
November is usually the strongest month. Since 1990, nearly three-quarters of Novembers (74.3%) have finished positive with the S&P 500 averaging a 2.45% gain, with December adding another +1.28%.
Graphs are for illustrative and discussion purposes only. Please read important disclosures at the end of this commentary.
This year seems to have broken these patterns. For most of November, the tape looked heavy, and sentiment was negative. Then Thanksgiving week arrived. In those thinly traded quiet sessions, pressure lifted and buyers stepped in just enough to push the Dow, the S&P 500, and the Russell 2000 back into the green for the month. Only the NASDAQ Composite failed to join the late November rebound.
Graphs are for illustrative and discussion purposes only. Please read important disclosures at the end of this commentary.
November’s early weakness was concentrated in growth areas. Technology, Discretionary, and Industrials struggled, usually bull-market engines. Their volatile action created concern that something broader was breaking down. The financial media pushed the idea that the AI trade was fading and overspending and limited data-center capacity made valuations unsustainable. But, as is often the case, the simplest explanation is not the one that generates the most clicks. Headlines often chase emotion rather than facts.
I believe the real cause was not fundamental deterioration or an AI unwind. It was forced liquidation in the crypto-currency world that spilled into equities. Bitcoin and other major crypto-currencies fell sharply, and in a highly levered space, those drops triggered margin calls, so traders are forced to raise cash any way they can. The fastest way is to sell their best-performing, most liquid positions. That is exactly what we saw.
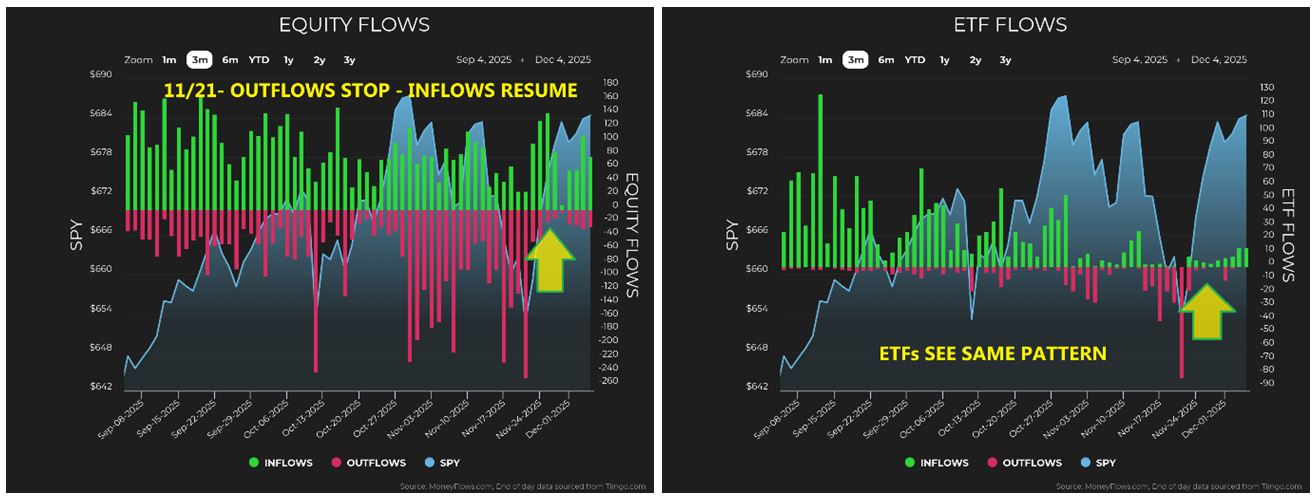
Then, just as quickly, pressure vanished. November 20 marked the last day of heavy outflow. Starting the next session, consistent inflow returned. From October 29 through November 20, only three of 17-trading days saw inflow exceed outflow. It felt as if risk managers across several firms had instructed traders to cut exposure before Thanksgiving, and once that deadline passed, the selling simply stopped.
Graphs are for illustrative and discussion purposes only. Please read important disclosures at the end of this commentary.
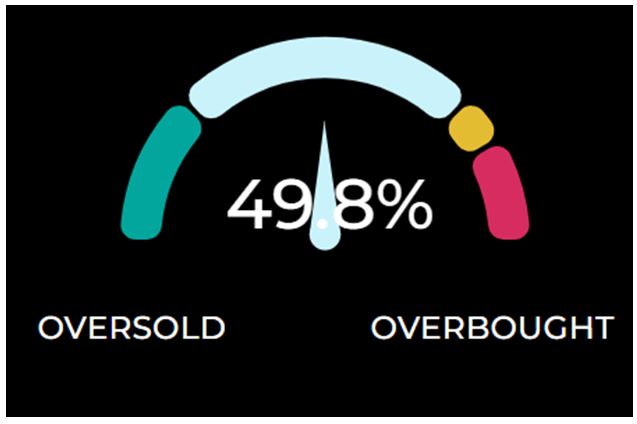
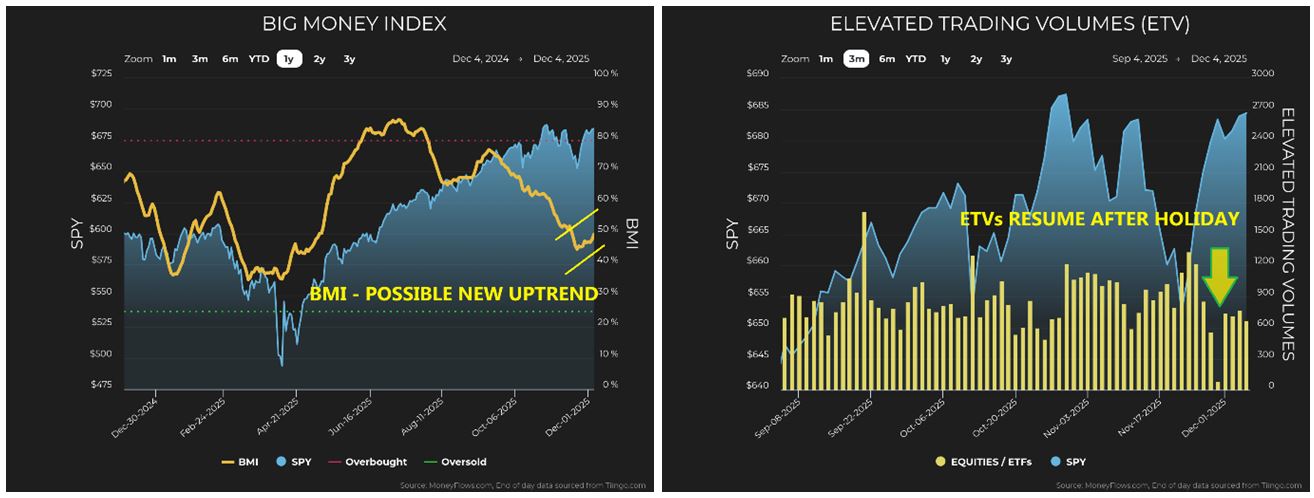
The Big Money Index (BMI) confirms this shift. It had fallen sharply into the mid-forties, signaling stronger selling pressure, but it recently bounced back to nearly 50. That may not sound dramatic, but the direction change is what matters. A rising BMI is one of the clearest signals that forced selling has ended and buyers are stepping back in. Trading volumes, which were muted during the holiday stretch, also recovered. When real money returns to the market with conviction, volume usually leads the way.
Graphs are for illustrative and discussion purposes only. Please read important disclosures at the end of this commentary.
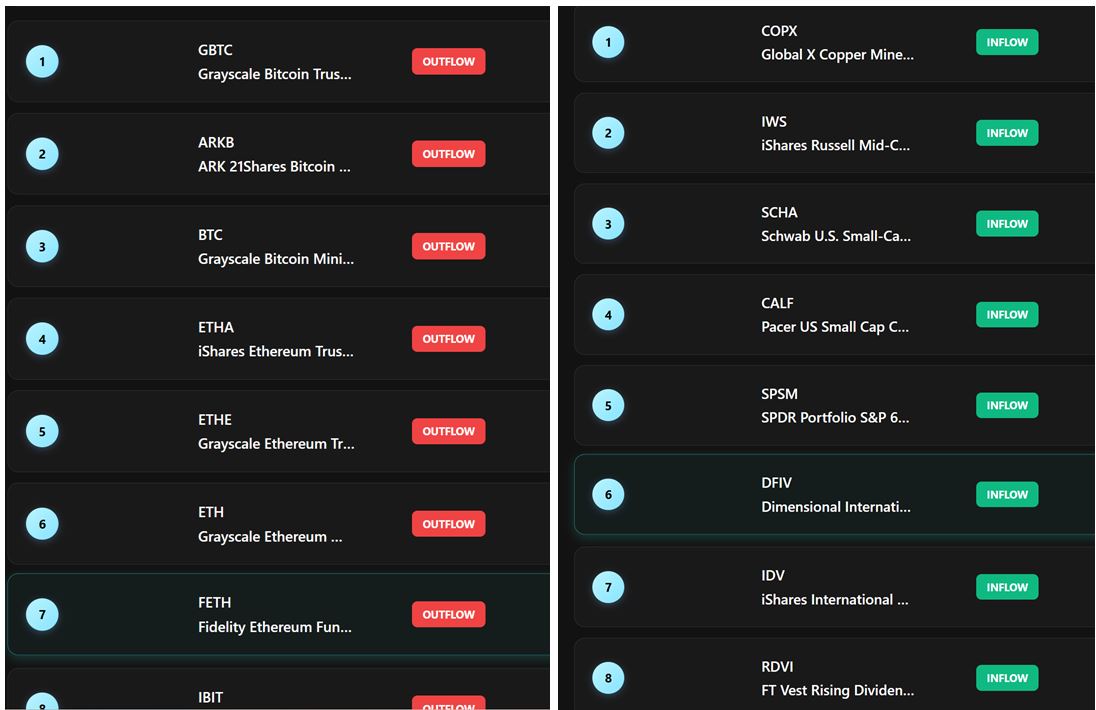
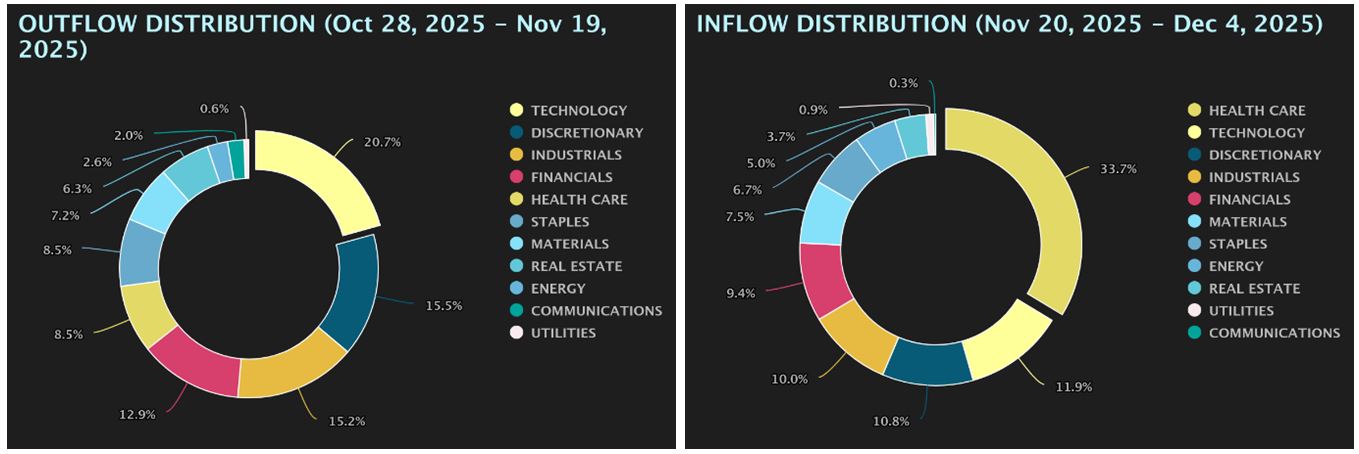
ETF flow add another layer of confirmation. During the worst of the selling, outflows were heavily concentrated in crypto-currency related ETFs. Once that pressure eased, we began to see inflow return to small-caps, mid-caps and international stocks. That shift aligns perfectly with an environment where traders had been selling winners to cover losses, and they are now rebuilding exposure once forced selling stopped.
Graphs are for illustrative and discussion purposes only. Please read important disclosures at the end of this commentary.
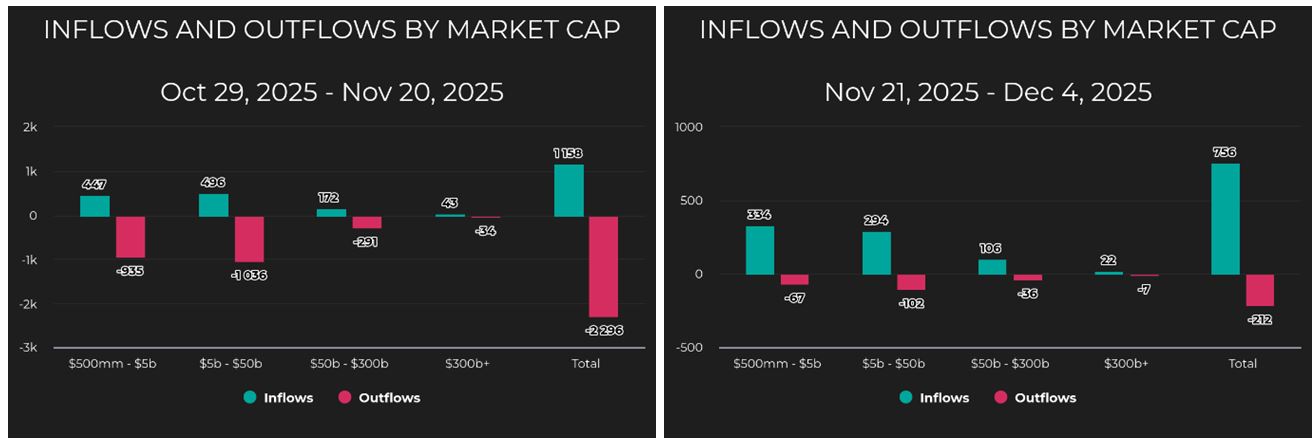
Flow patterns by market-cap show the same reversal. Before November 20, small-cap and mid-cap stocks faced significant pressure. After that, capital began rotating back in.
Graphs are for illustrative and discussion purposes only. Please read important disclosures at the end of this commentary.
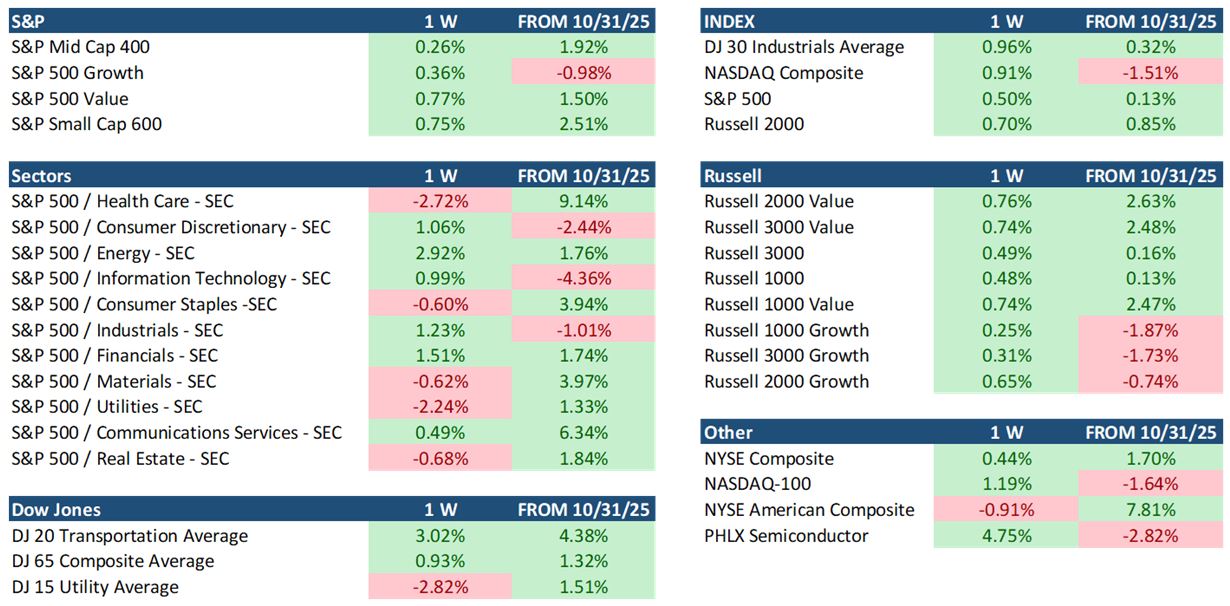
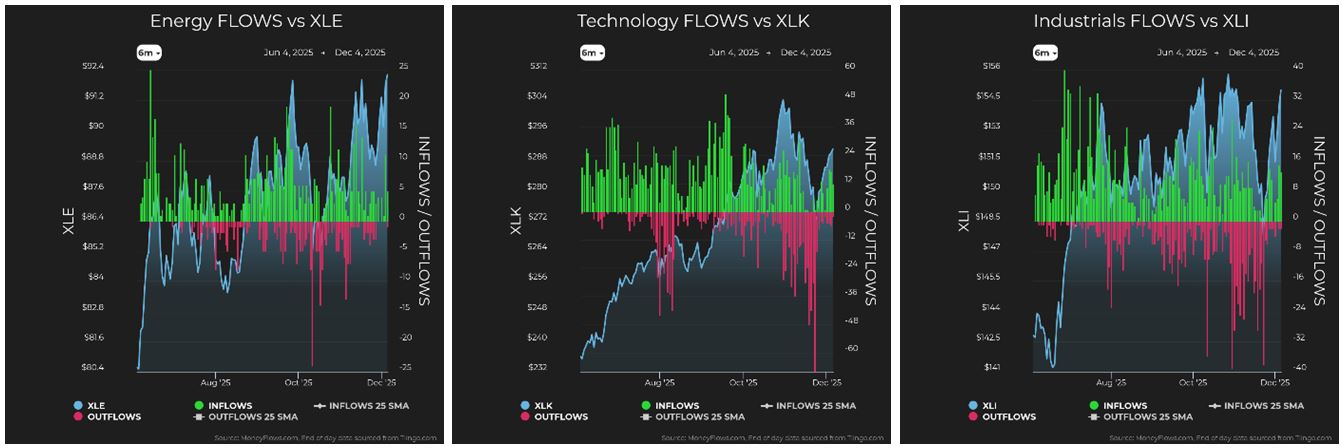
Sector level flow also flipped. Energy suddenly jumped to the top of the rankings due in part to XLE hitting fresh 6-month highs, but there weren’t heavy outflows to drag it down.
![]()
Graphs are for illustrative and discussion purposes only. Please read important disclosures at the end of this commentary.
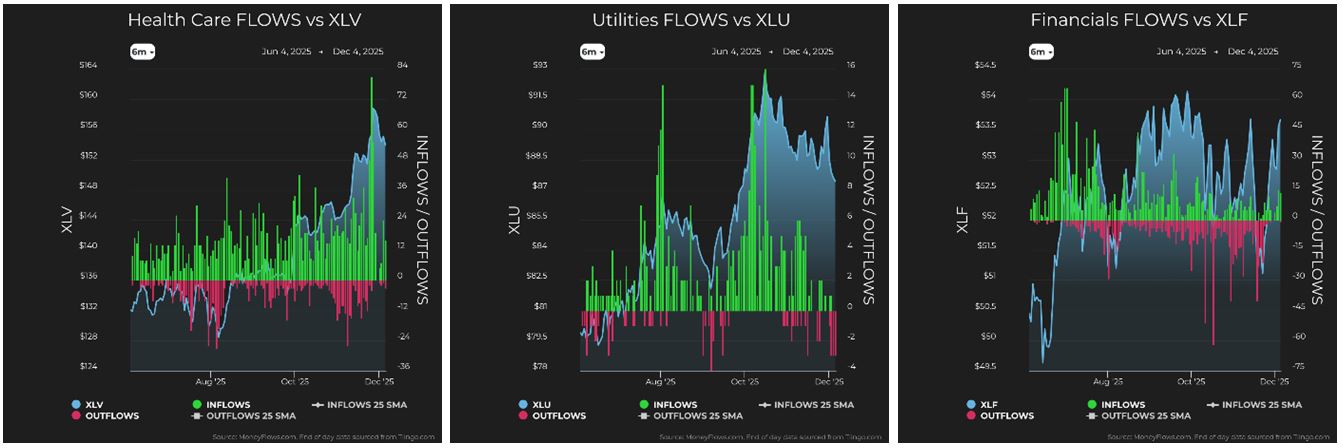
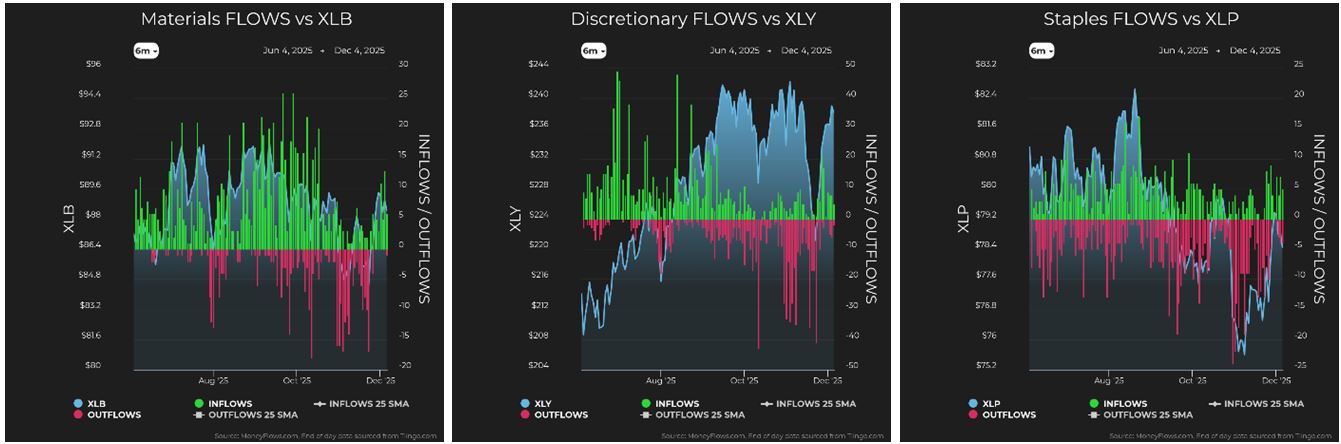
Technology, Industrials, Discretionary, and Financials endured the steepest draw-downs and then staged the sharpest rebounds. This is typical when selling is mechanical rather than driven by weak fundamentals.
Graphs are for illustrative and discussion purposes only. Please read important disclosures at the end of this commentary.
Graphs are for illustrative and discussion purposes only. Please read important disclosures at the end of this commentary.
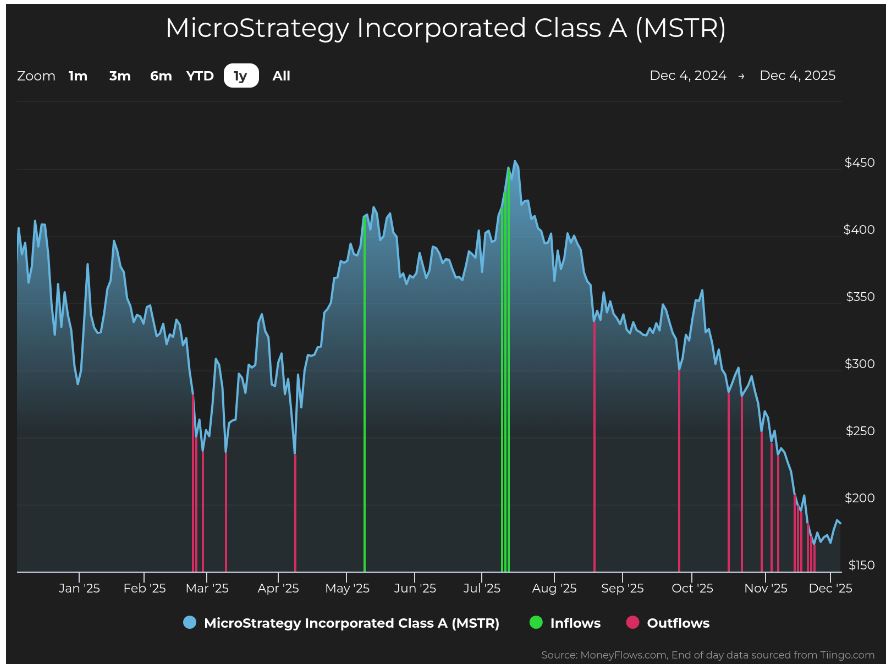
Given this context, the question becomes, Which story is more believable? Did the AI trade suddenly collapse, or did a leveraged group get hit hard in crypto-currency and needed to liquidate profitable positions?
Charts of stocks with heavy crypto-currency exposure, such as MicroStrategy, make the answer fairly obvious. Someone, somewhere, blew-up, and their losses spilled into the equities that had performed best all year.
Graphs are for illustrative and discussion purposes only. Please read important disclosures at the end of this commentary.
The good news is that the tail-winds are lining up. The probability of a December rate cut has increased. Lower taxes from the Big Beautiful Bill are already improving bottom line results. Earnings are excellent: for Q3, with 83% of S&P 500 companies beating earnings and 76% beating revenue. These are strong numbers, justifying the market’s resilience. And remember: December is a seasonally strong for stocks.
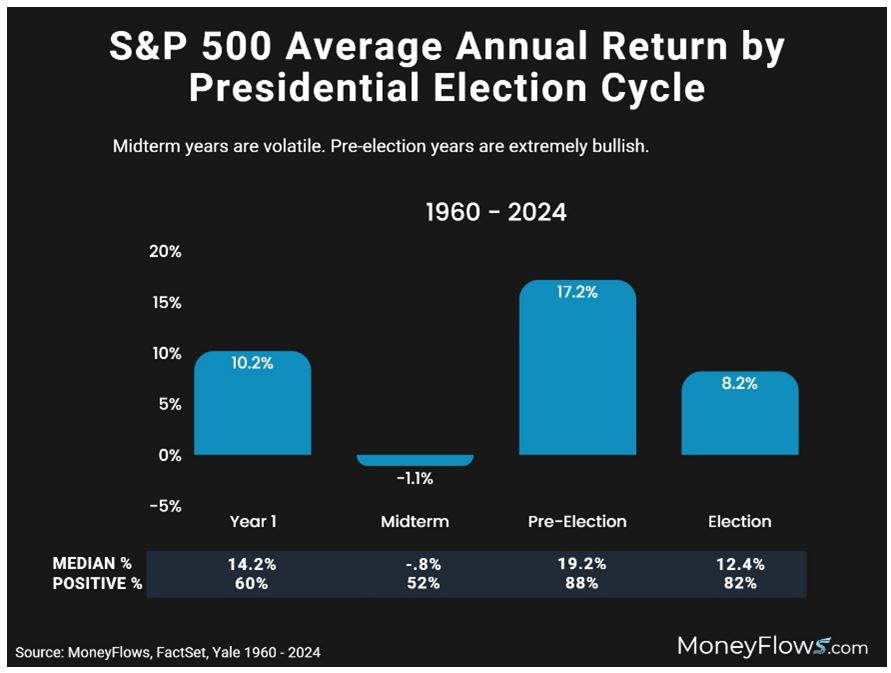
One Warning: Mid-Term Election Years (Like 2026) are Generally Flat
I’m optimistic about the near-term back-drop for stocks, but I also must acknowledge a caveat. Next year is a mid-term election year, which is historically the softest year in the 4-year presidential cycle.
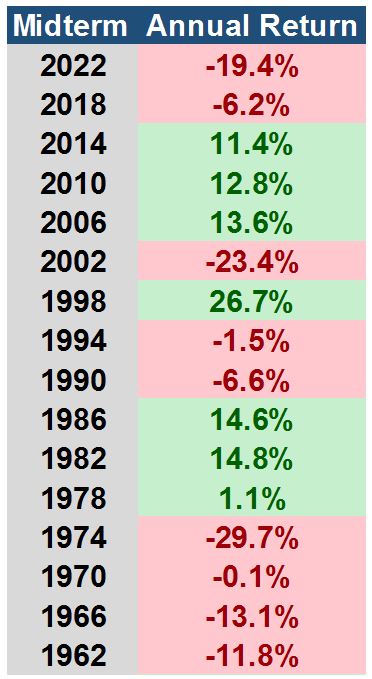
Fewer than half (7 of 16-mid-term years since 1960) have been positive.
Graphs are for illustrative and discussion purposes only. Please read important disclosures at the end of this commentary.
One other caveat: A review of the events in most of these years, reveals the fact that the biggest declines were tied to significant macro-events rather than the election cycle itself, such as:
- The Kennedy slide of 1962 was driven by recession fears and the Cuban Missile crisis.
- The 1966 decline came from a credit crunch caused by aggressive Federal Reserve tightening.
- The severe selloff in 1974 stemmed from inflation, Watergate, the end of the Bretton Woods system, and the OPEC oil shock.
- In 2002, the dot com collapse, accounting scandals, and post 9/11 uncertainty crushed confidence.
- And in 2022, markets struggled under the weight of inflation, rapid interest rate hikes, supply chain disruptions, war in Ukraine, and China’s lock-down policies.
Graphs are for illustrative and discussion purposes only. Please read important disclosures at the end of this commentary.
Mid-term years suffer when such shocks occur, but I don’t currently see a comparable shock ahead in 2026. Instead, the market shook off a sharp but temporary forced liquidation, recovered, and now show signs of strengthening flow and renewed demand.
The storm was real, but it passed. And just like storms that briefly generate anti-matter before fading, the November turbulence revealed its hidden force only in hindsight.
There is an old Chinese proverb: “The wise prepare for rain long before the first cloud appears.”
All content above represents the opinion of Jason Bodner of Navellier & Associates, Inc.
Also In This Issue
A Look Ahead by Louis Navellier
2026 Is Shaping Up to be a Spectacular Year
Income Mail by Bryan Perry
“Affordability” Takes Center Stage For 2026
Growth Mail by Gary Alexander
Storms Make the News, but Clear Skies are the Norm
View Full Archive
Read Past Issues Here
Global Mail by Ivan Martchev
New All-Time Highs Are Likely This Week
Sector Spotlight by Jason Bodner
Into Each Month Some Rain Must Fall
Guest Column by Jamie Dlugosch
Opening Bell Arbitrage – The True “Value Cycle”

Jason Bodner
MARKETMAIL EDITOR FOR SECTOR SPOTLIGHT
Jason Bodner writes Sector Spotlight in the weekly Marketmail publication and has authored several white papers for the company. He is also Co-Founder of Macro Analytics for Professionals which produces proprietary equity accumulation and distribution research for its clients. Previously, Mr. Bodner served as Director of European Equity Derivatives for Cantor Fitzgerald Europe in London, then moved to the role of Head of Equity Derivatives North America for the same company in New York. He also served as S.V.P. Equity Derivatives for Jefferies, LLC. He received a B.S. in business administration in 1996, with honors, from Skidmore College as a member of the Periclean Honors Society. All content of “Sector Spotlight” represents the opinion of Jason Bodner
Important Disclosures:
Jason Bodner is a co-founder and co-owner of Mapsignals. Mr. Bodner is an independent contractor who is occasionally hired by Navellier & Associates to write an article and or provide opinions for possible use in articles that appear in Navellier & Associates weekly Market Mail. Mr. Bodner is not employed or affiliated with Louis Navellier, Navellier & Associates, Inc., or any other Navellier owned entity. The opinions and statements made here are those of Mr. Bodner and not necessarily those of any other persons or entities. This is not an endorsement, or solicitation or testimonial or investment advice regarding the BMI Index or any statements or recommendations or analysis in the article or the BMI Index or Mapsignals or its products or strategies.
Although information in these reports has been obtained from and is based upon sources that Navellier believes to be reliable, Navellier does not guarantee its accuracy and it may be incomplete or condensed. All opinions and estimates constitute Navellier’s judgment as of the date the report was created and are subject to change without notice. These reports are for informational purposes only and are not a solicitation for the purchase or sale of a security. Any decision to purchase securities mentioned in these reports must take into account existing public information on such securities or any registered prospectus.To the extent permitted by law, neither Navellier & Associates, Inc., nor any of its affiliates, agents, or service providers assumes any liability or responsibility nor owes any duty of care for any consequences of any person acting or refraining to act in reliance on the information contained in this communication or for any decision based on it.
Past performance is no indication of future results. Investment in securities involves significant risk and has the potential for partial or complete loss of funds invested. It should not be assumed that any securities recommendations made by Navellier. in the future will be profitable or equal the performance of securities made in this report. Dividend payments are not guaranteed. The amount of a dividend payment, if any, can vary over time and issuers may reduce dividends paid on securities in the event of a recession or adverse event affecting a specific industry or issuer.
None of the stock information, data, and company information presented herein constitutes a recommendation by Navellier or a solicitation to buy or sell any securities. Any specific securities identified and described do not represent all of the securities purchased, sold, or recommended for advisory clients. The holdings identified do not represent all of the securities purchased, sold, or recommended for advisory clients and the reader should not assume that investments in the securities identified and discussed were or will be profitable.
Information presented is general information that does not take into account your individual circumstances, financial situation, or needs, nor does it present a personalized recommendation to you. Individual stocks presented may not be suitable for every investor. Investment in securities involves significant risk and has the potential for partial or complete loss of funds invested. Investment in fixed income securities has the potential for the investment return and principal value of an investment to fluctuate so that an investor’s holdings, when redeemed, may be worth less than their original cost.
One cannot invest directly in an index. Index is unmanaged and index performance does not reflect deduction of fees, expenses, or taxes. Presentation of Index data does not reflect a belief by Navellier that any stock index constitutes an investment alternative to any Navellier equity strategy or is necessarily comparable to such strategies. Among the most important differences between the Indices and Navellier strategies are that the Navellier equity strategies may (1) incur material management fees, (2) concentrate its investments in relatively few stocks, industries, or sectors, (3) have significantly greater trading activity and related costs, and (4) be significantly more or less volatile than the Indices.
ETF Risk: We may invest in exchange traded funds (“ETFs”) and some of our investment strategies are generally fully invested in ETFs. Like traditional mutual funds, ETFs charge asset-based fees, but they generally do not charge initial sales charges or redemption fees and investors typically pay only customary brokerage fees to buy and sell ETF shares. The fees and costs charged by ETFs held in client accounts will not be deducted from the compensation the client pays Navellier. ETF prices can fluctuate up or down, and a client account could lose money investing in an ETF if the prices of the securities owned by the ETF go down. ETFs are subject to additional risks:
- ETF shares may trade above or below their net asset value;
- An active trading market for an ETF’s shares may not develop or be maintained;
- The value of an ETF may be more volatile than the underlying portfolio of securities the ETF is designed to track;
- The cost of owning shares of the ETF may exceed those a client would incur by directly investing in the underlying securities and;
- Trading of an ETF’s shares may be halted if the listing exchange’s officials deem it appropriate, the shares are delisted from the exchange, or the activation of market-wide “circuit breakers” (which are tied to large decreases in stock prices) halts stock trading generally.
Grader Disclosures: Investment in equity strategies involves substantial risk and has the potential for partial or complete loss of funds invested. The sample portfolio and any accompanying charts are for informational purposes only and are not to be construed as a solicitation to buy or sell any financial instrument and should not be relied upon as the sole factor in an investment making decision. As a matter of normal and important disclosures to you, as a potential investor, please consider the following: The performance presented is not based on any actual securities trading, portfolio, or accounts, and the reported performance of the A, B, C, D, and F portfolios (collectively the “model portfolios”) should be considered mere “paper” or pro forma performance results based on Navellier’s research.
Investors evaluating any of Navellier & Associates, Inc.’s, (or its affiliates’) Investment Products must not use any information presented here, including the performance figures of the model portfolios, in their evaluation of any Navellier Investment Products. Navellier Investment Products include the firm’s mutual funds and managed accounts. The model portfolios, charts, and other information presented do not represent actual funded trades and are not actual funded portfolios. There are material differences between Navellier Investment Products’ portfolios and the model portfolios, research, and performance figures presented here. The model portfolios and the research results (1) may contain stocks or ETFs that are illiquid and difficult to trade; (2) may contain stock or ETF holdings materially different from actual funded Navellier Investment Product portfolios; (3) include the reinvestment of all dividends and other earnings, estimated trading costs, commissions, or management fees; and, (4) may not reflect prices obtained in an actual funded Navellier Investment Product portfolio. For these and other reasons, the reported performances of model portfolios do not reflect the performance results of Navellier’s actually funded and traded Investment Products. In most cases, Navellier’s Investment Products have materially lower performance results than the performances of the model portfolios presented.
This report contains statements that are, or may be considered to be, forward-looking statements. All statements that are not historical facts, including statements about our beliefs or expectations, are “forward-looking statements” within the meaning of The U.S. Private Securities Litigation Reform Act of 1995. These statements may be identified by such forward-looking terminology as “expect,” “estimate,” “plan,” “intend,” “believe,” “anticipate,” “may,” “will,” “should,” “could,” “continue,” “project,” or similar statements or variations of such terms. Our forward-looking statements are based on a series of expectations, assumptions, and projections, are not guarantees of future results or performance, and involve substantial risks and uncertainty as described in Form ADV Part 2A of our filing with the Securities and Exchange Commission (SEC), which is available at www.adviserinfo.sec.gov or by requesting a copy by emailing info@navellier.com. All of our forward-looking statements are as of the date of this report only. We can give no assurance that such expectations or forward-looking statements will prove to be correct. Actual results may differ materially. You are urged to carefully consider all such factors.
FEDERAL TAX ADVICE DISCLAIMER: As required by U.S. Treasury Regulations, you are informed that, to the extent this presentation includes any federal tax advice, the presentation is not written by Navellier to be used, and cannot be used, for the purpose of avoiding federal tax penalties. Navellier does not advise on any income tax requirements or issues. Use of any information presented by Navellier is for general information only and does not represent tax advice either express or implied. You are encouraged to seek professional tax advice for income tax questions and assistance.
IMPORTANT NEWSLETTER DISCLOSURE:The hypothetical performance results for investment newsletters that are authored or edited by Louis Navellier, including Louis Navellier’s Growth Investor, Louis Navellier’s Breakthrough Stocks, Louis Navellier’s Accelerated Profits, and Louis Navellier’s Platinum Club, are not based on any actual securities trading, portfolio, or accounts, and the newsletters’ reported hypothetical performances should be considered mere “paper” or proforma hypothetical performance results and are not actual performance of real world trades. Navellier & Associates, Inc. does not have any relation to or affiliation with the owner of these newsletters. There are material differences between Navellier Investment Products’ portfolios and the InvestorPlace Media, LLC newsletter portfolios authored by Louis Navellier. The InvestorPlace Media, LLC newsletters contain hypothetical performance that do not include transaction costs, advisory fees, or other fees a client might incur if actual investments and trades were being made by an investor. As a result, newsletter performance should not be used to evaluate Navellier Investment services which are separate and different from the newsletters. The owner of the newsletters is InvestorPlace Media, LLC and any questions concerning the newsletters, including any newsletter advertising or hypothetical Newsletter performance claims, (which are calculated solely by Investor Place Media and not Navellier) should be referred to InvestorPlace Media, LLC at (800) 718-8289.
Please note that Navellier & Associates and the Navellier Private Client Group are managed completely independent of the newsletters owned and published by InvestorPlace Media, LLC and written and edited by Louis Navellier, and investment performance of the newsletters should in no way be considered indicative of potential future investment performance for any Navellier & Associates separately managed account portfolio. Potential investors should consult with their financial advisor before investing in any Navellier Investment Product.
Navellier claims compliance with Global Investment Performance Standards (GIPS). To receive a complete list and descriptions of Navellier’s composites and/or a presentation that adheres to the GIPS standards, please contact Navellier or click here. It should not be assumed that any securities recommendations made by Navellier & Associates, Inc. in the future will be profitable or equal the performance of securities made in this report.
FactSet Disclosure: Navellier does not independently calculate the statistical information included in the attached report. The calculation and the information are provided by FactSet, a company not related to Navellier. Although information contained in the report has been obtained from FactSet and is based on sources Navellier believes to be reliable, Navellier does not guarantee its accuracy, and it may be incomplete or condensed. The report and the related FactSet sourced information are provided on an “as is” basis. The user assumes the entire risk of any use made of this information. Investors should consider the report as only a single factor in making their investment decision. The report is for informational purposes only and is not intended as an offer or solicitation for the purchase or sale of a security. FactSet sourced information is the exclusive property of FactSet. Without prior written permission of FactSet, this information may not be reproduced, disseminated or used to create any financial products. All indices are unmanaged and performance of the indices include reinvestment of dividends and interest income, unless otherwise noted, are not illustrative of any particular investment and an investment cannot be made in any index. Past performance is no guarantee of future results.