by Jason Bodner
December 24, 2024
Last year, the NHL New York Rangers won the President’s trophy. For non-hockey people, that means they won the most games in the regular season. At playoff time, I made it loud and clear here that I was a Ranger fan. Well, now they have gone from being a favorite to win the Stanley Cup to being out of a playoff spot in a stunning turn downward. Losing has become the norm, and people are writing them off – including me at times – but times like these are the right time to profess fandom and support.
When the chips are down, as the St. Louis Blues run (“from worst to first” in the 2019 season) proved, never assume any trend lasts forever. As usual, there are more reasons than just emotion. If I allow myself to get emotional, I get frustrated and tired of watching my guys lose so often. The short-term data says they suck, but the underlying data tells me that now is the time to be a “buyer” of Rangers “futures.”
Sound familiar? Stock investing shares the same quirk sometimes. Early last week, all was right with the world – and the stock market. We were at highs. S&P 500 earnings were great, with 74% of companies beating analysts’ estimates. Relatively speaking, inflation was within spitting distance of the Fed’s long-term 2% target. The economic data continued to be strong for the U.S. And Santa’s rally was expected to bring cheer at the end of a very good year. But then the market tanked – like the New York Rangers.
Instead of taking the next expected step higher, the market swan-dove off the staircase and went splat onto the floor. The Fed’s expected rate cut was not the problem. No, the issue was the Fed telegraphing just two future rate cuts for 2025 instead of four. That’s not bad news, just less good than the market expected.
Stocks sank and moods followed – much like the last two mediocre months (16 wins, 16 losses and 10th place in the East) of the Rangers’ crappy season thus far. But, the data say: “Don’t be a seller, be a buyer!”
After the Fed’s announcement, stocks slid to finish an abysmal day. The QQQ (NASDAQ’s tracking ETF) fell -3.6% last Wednesday. The day also marked the most unusually large selling we have seen since July, and it was the second largest selling day of the entire year (see the deep red line at the far right, below):
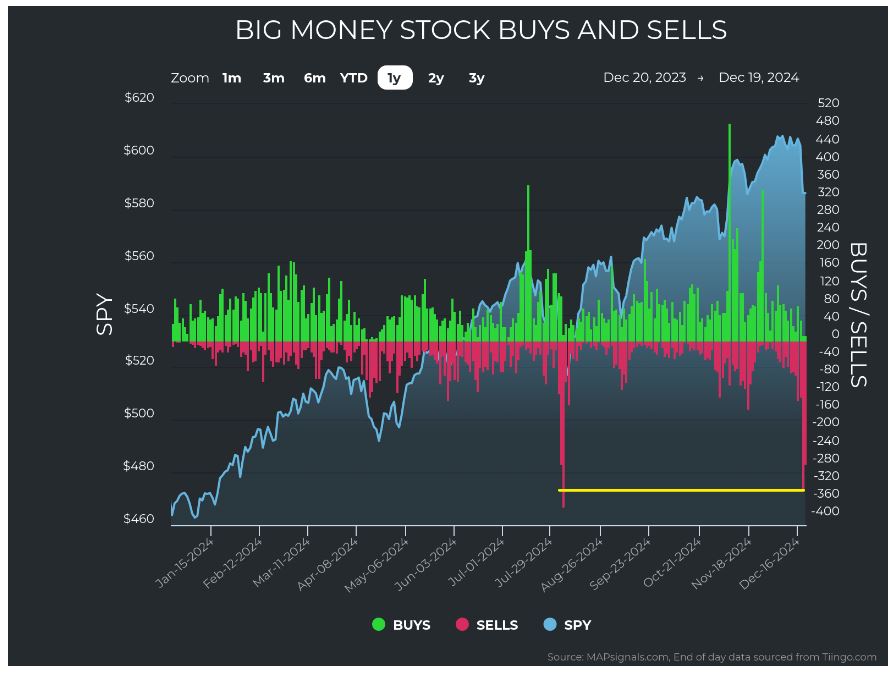
Graphs are for illustrative and discussion purposes only. Please read important disclosures at the end of this commentary.
Emotionally, it sucks to watch your portfolio’s values melt that significantly in one day, but I learned long ago not to invest with my emotions – it blew up my account. When I put my data glasses on, everything becomes clearer. I now know that huge selling is a sign of capitulation, even if it’s out of the blue. And looking at extreme stock selling over the past three years, we can see a clear pattern:
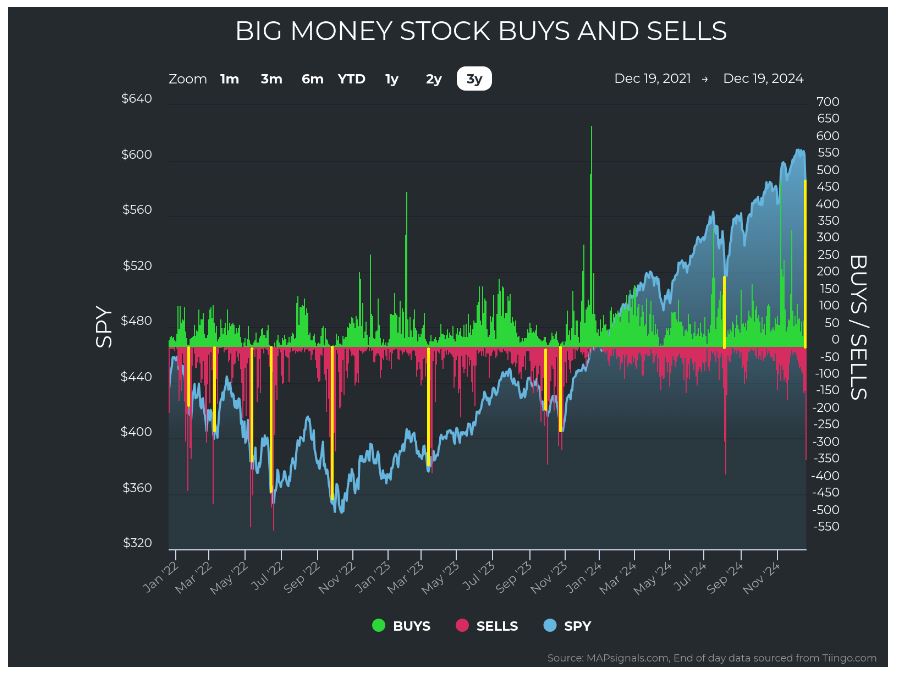
Graphs are for illustrative and discussion purposes only. Please read important disclosures at the end of this commentary.
The data line up to show us an obvious correlation between huge selling and a market trough.
Let’s dig deeper into the data. I mentioned that the QQQ fell by more than 3.5% last Wednesday. I looked at the historic data, and since 2004 (20 years) it has fallen -3.5% or more 66 times out of 5,225 total trading days, or just 1.26% of the time. The forward returns after those 66 big drops were outstanding:
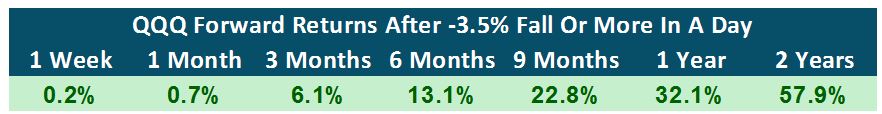
Graphs are for illustrative and discussion purposes only. Please read important disclosures at the end of this commentary.
Next, when we look across the sectors, the selling was heavy. It was the heaviest selling of the year, or very close to the heaviest selling, for the nine of the 11 S&P sectors:

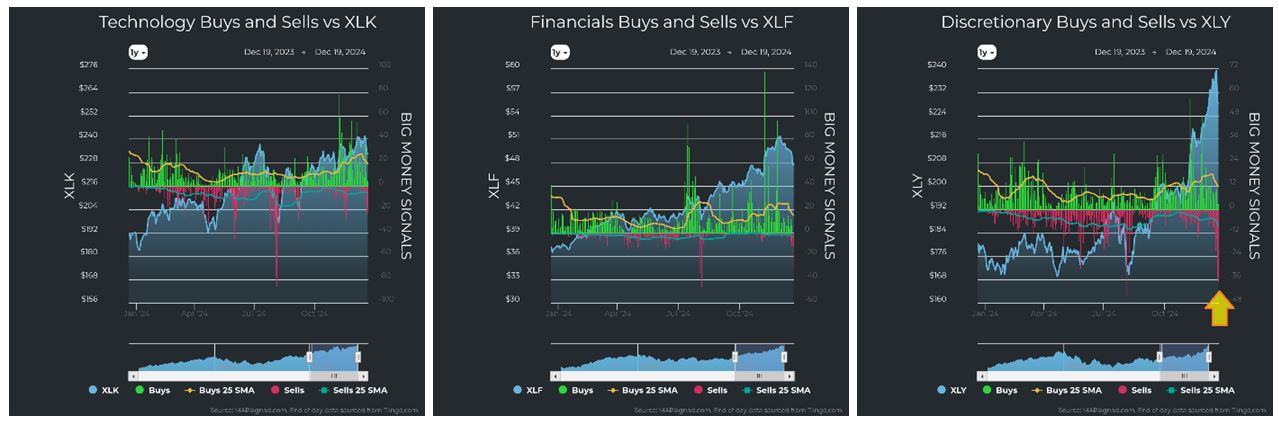
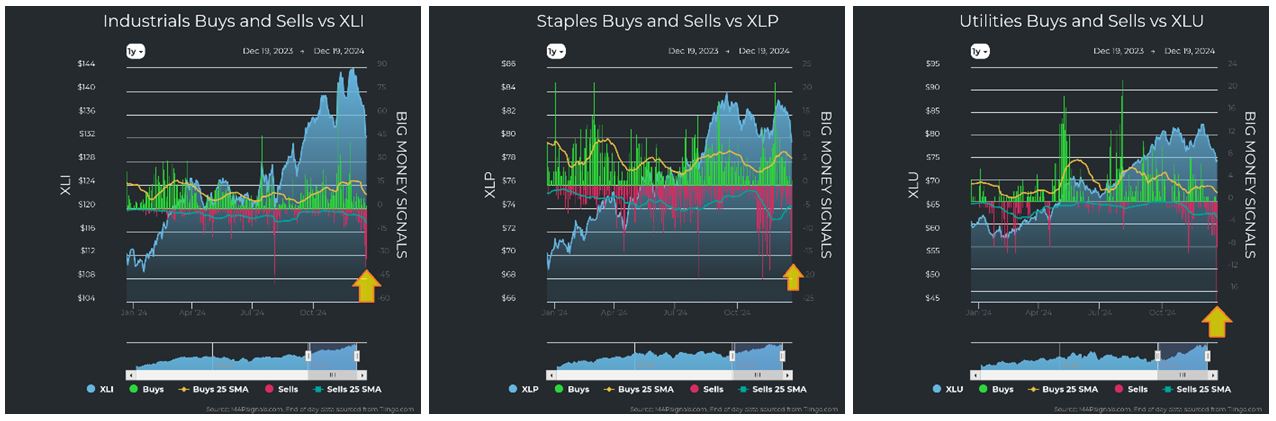
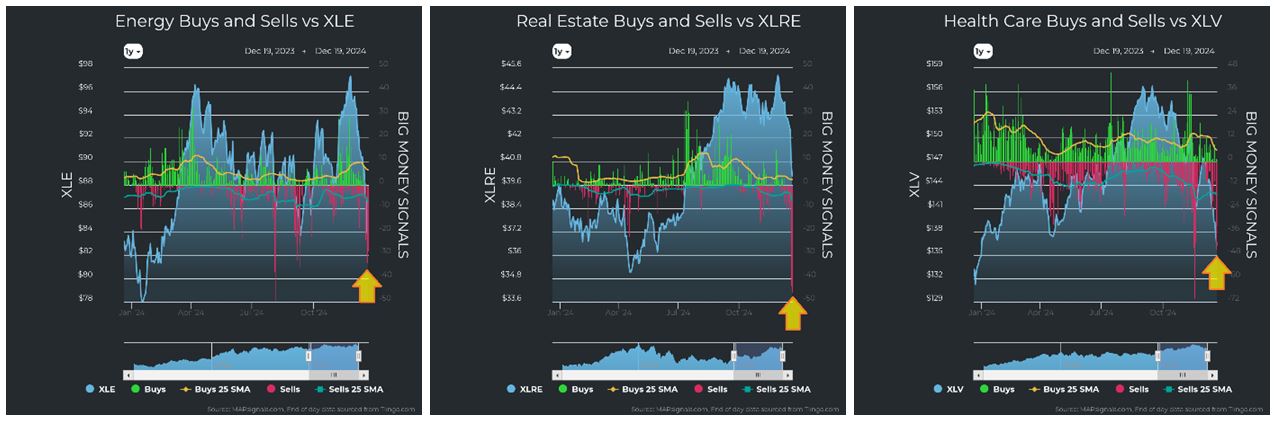
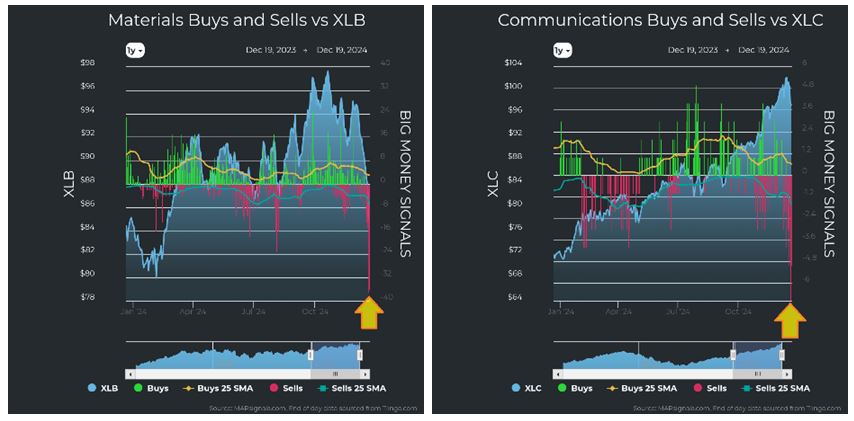
Graphs are for illustrative and discussion purposes only. Please read important disclosures at the end of this commentary.
The good news is that we don’t historically have to wait long for a nice bounce in all 11 sectors! I looked back 20 years and ran the same returns for each sector ETF (Note: Real Estate and Communications did not exist until 2015 and 2018, respectively). Here are the returns – revealing a lot of long-term green:
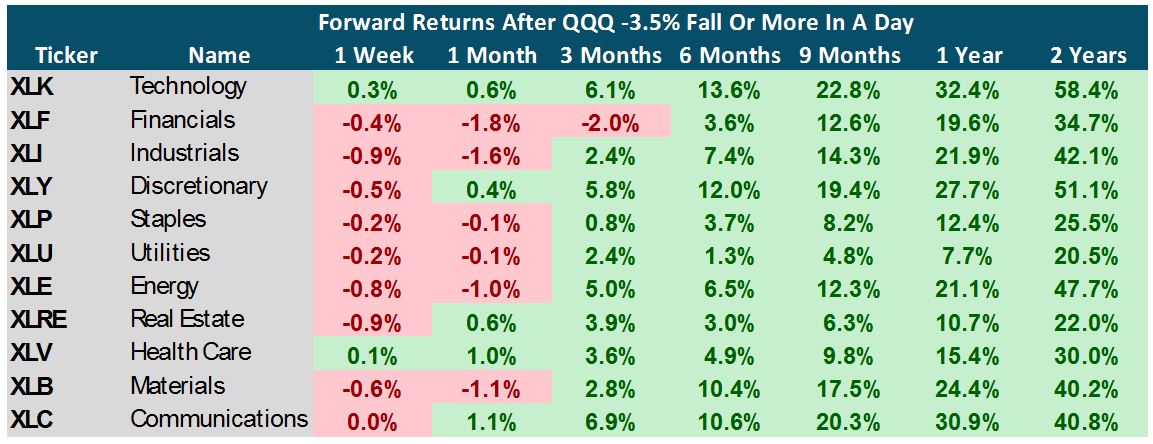
Graphs are for illustrative and discussion purposes only. Please read important disclosures at the end of this commentary.
While we’re on the topic of sectors, here is the most recent ranking of sector strength and weakness. We can see that Technology, Financials, Industrials and Discretionary are at the top of the list. Except for Financials, these are growth engines of a normal bull market and an economy. This is what I like to see:
![]()
Graphs are for illustrative and discussion purposes only. Please read important disclosures at the end of this commentary.
The forward data looks good for market down days like last Wednesday. It also looks good for the sectors seeing huge selling. Next, let’s look at unusually large selling data from MAPsignals.
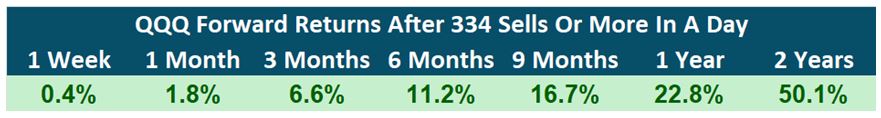
Wednesday December 18th logged 334 unusually large sell signals. I looked back to find similar times in history. Since 2024, there were 94 prior instances out of 5,225 trading days, or 1.8% of the time.
You might expect what comes next – more juicy forward returns, historically speaking:
Graphs are for illustrative and discussion purposes only. Please read important disclosures at the end of this commentary.
Inflation may seem high, but it’s not. The CPI for November was 2.7%, which a little bit hotter than the Fed’s long-term goal of 2%. It is important to note, however, that the CPI historical average since 1960 is 3.77%. So, while 2.7 is higher than desired, it is still far lower (30% lower) than the 64-year average!
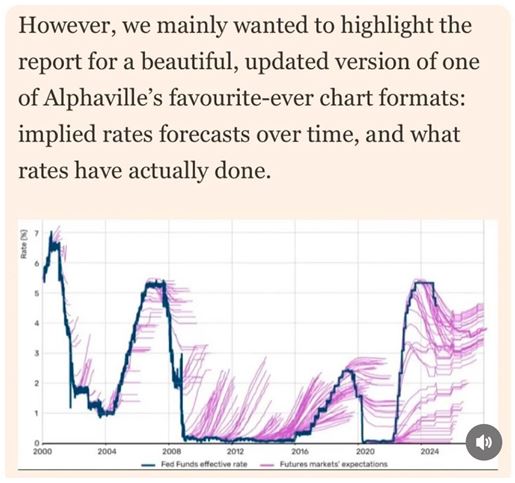
Secondly, it appears that the futures market has the same predictive power of the bears who successfully predicted 28 of the last two bear markets. I found this on the Financial Times. The wispy purple lines are predictions. The solid blue is reality. Look at the beautifully wrong track record of rates predictions:
Graphs are for illustrative and discussion purposes only. Please read important disclosures at the end of this commentary.
Let that sink in for a moment… The market reacts today to what it thinks will happen several months from now. And as it pertains to rates… well, let’s just say that I wouldn’t trust it that much.
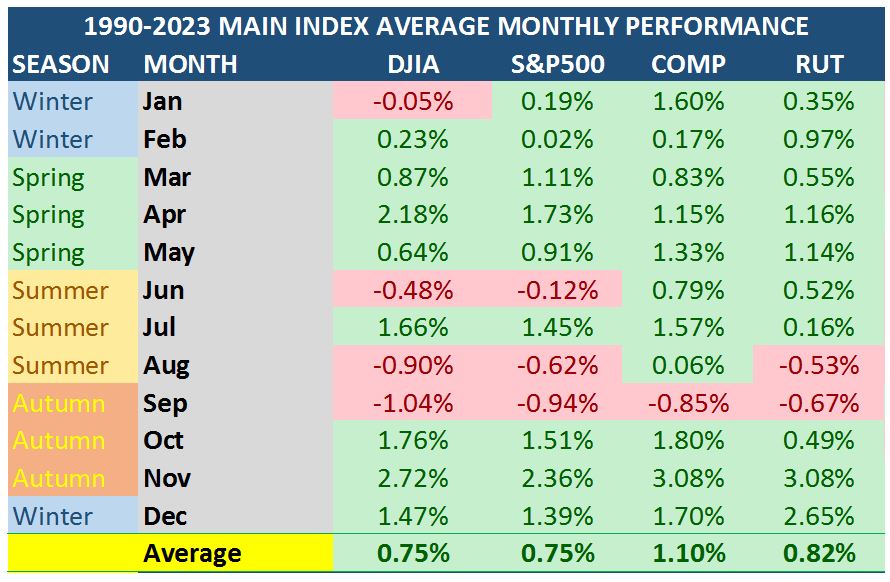
The end of the year is here. I expect the Santa rally to bring us to January. Then seasonality tells us that January through May is a strong time of year for stocks:
Graphs are for illustrative and discussion purposes only. Please read important disclosures at the end of this commentary.
So, relax and enjoy some time with your family. It’s the most wonderful time of the year.
Tonight, Monday, I will watch my New York Rangers play the red-hot New Jersey Devils (2nd in the East) and trust that the Rangers will turn it around by playoff time. I’ll try not to get mired in the emotion of a loss. I suggest investors do the same. Focus on the data, which tells us we have much to look forward to.
As Dale Carnegie said: “When dealing with people, remember you are not dealing with creatures of logic, but creatures of emotion.”
All content above represents the opinion of Jason Bodner of Navellier & Associates, Inc.
Also In This Issue
A Look Ahead by Louis Navellier
My Six Predictions for 2025 – Part 1 (of 2)
Income Mail by Bryan Perry
The Fed’s Favorite Inflation Gauge Spiked the Market’s Punch Bowl
Growth Mail by Gary Alexander
My Top 10 (or 12) Books From 2024 – For Profiting from 2025
Global Mail by Ivan Martchev
Jerome Powell was a Party Pooper – Once Again
Sector Spotlight by Jason Bodner
When Good Stocks Tumble, Relax! They Will Rise Again
View Full Archive
Read Past Issues Here

Jason Bodner
MARKETMAIL EDITOR FOR SECTOR SPOTLIGHT
Jason Bodner writes Sector Spotlight in the weekly Marketmail publication and has authored several white papers for the company. He is also Co-Founder of Macro Analytics for Professionals which produces proprietary equity accumulation and distribution research for its clients. Previously, Mr. Bodner served as Director of European Equity Derivatives for Cantor Fitzgerald Europe in London, then moved to the role of Head of Equity Derivatives North America for the same company in New York. He also served as S.V.P. Equity Derivatives for Jefferies, LLC. He received a B.S. in business administration in 1996, with honors, from Skidmore College as a member of the Periclean Honors Society. All content of “Sector Spotlight” represents the opinion of Jason Bodner
Important Disclosures:
Jason Bodner is a co-founder and co-owner of Mapsignals. Mr. Bodner is an independent contractor who is occasionally hired by Navellier & Associates to write an article and or provide opinions for possible use in articles that appear in Navellier & Associates weekly Market Mail. Mr. Bodner is not employed or affiliated with Louis Navellier, Navellier & Associates, Inc., or any other Navellier owned entity. The opinions and statements made here are those of Mr. Bodner and not necessarily those of any other persons or entities. This is not an endorsement, or solicitation or testimonial or investment advice regarding the BMI Index or any statements or recommendations or analysis in the article or the BMI Index or Mapsignals or its products or strategies.
Although information in these reports has been obtained from and is based upon sources that Navellier believes to be reliable, Navellier does not guarantee its accuracy and it may be incomplete or condensed. All opinions and estimates constitute Navellier’s judgment as of the date the report was created and are subject to change without notice. These reports are for informational purposes only and are not a solicitation for the purchase or sale of a security. Any decision to purchase securities mentioned in these reports must take into account existing public information on such securities or any registered prospectus.To the extent permitted by law, neither Navellier & Associates, Inc., nor any of its affiliates, agents, or service providers assumes any liability or responsibility nor owes any duty of care for any consequences of any person acting or refraining to act in reliance on the information contained in this communication or for any decision based on it.
Past performance is no indication of future results. Investment in securities involves significant risk and has the potential for partial or complete loss of funds invested. It should not be assumed that any securities recommendations made by Navellier. in the future will be profitable or equal the performance of securities made in this report. Dividend payments are not guaranteed. The amount of a dividend payment, if any, can vary over time and issuers may reduce dividends paid on securities in the event of a recession or adverse event affecting a specific industry or issuer.
None of the stock information, data, and company information presented herein constitutes a recommendation by Navellier or a solicitation to buy or sell any securities. Any specific securities identified and described do not represent all of the securities purchased, sold, or recommended for advisory clients. The holdings identified do not represent all of the securities purchased, sold, or recommended for advisory clients and the reader should not assume that investments in the securities identified and discussed were or will be profitable.
Information presented is general information that does not take into account your individual circumstances, financial situation, or needs, nor does it present a personalized recommendation to you. Individual stocks presented may not be suitable for every investor. Investment in securities involves significant risk and has the potential for partial or complete loss of funds invested. Investment in fixed income securities has the potential for the investment return and principal value of an investment to fluctuate so that an investor’s holdings, when redeemed, may be worth less than their original cost.
One cannot invest directly in an index. Index is unmanaged and index performance does not reflect deduction of fees, expenses, or taxes. Presentation of Index data does not reflect a belief by Navellier that any stock index constitutes an investment alternative to any Navellier equity strategy or is necessarily comparable to such strategies. Among the most important differences between the Indices and Navellier strategies are that the Navellier equity strategies may (1) incur material management fees, (2) concentrate its investments in relatively few stocks, industries, or sectors, (3) have significantly greater trading activity and related costs, and (4) be significantly more or less volatile than the Indices.
ETF Risk: We may invest in exchange traded funds (“ETFs”) and some of our investment strategies are generally fully invested in ETFs. Like traditional mutual funds, ETFs charge asset-based fees, but they generally do not charge initial sales charges or redemption fees and investors typically pay only customary brokerage fees to buy and sell ETF shares. The fees and costs charged by ETFs held in client accounts will not be deducted from the compensation the client pays Navellier. ETF prices can fluctuate up or down, and a client account could lose money investing in an ETF if the prices of the securities owned by the ETF go down. ETFs are subject to additional risks:
- ETF shares may trade above or below their net asset value;
- An active trading market for an ETF’s shares may not develop or be maintained;
- The value of an ETF may be more volatile than the underlying portfolio of securities the ETF is designed to track;
- The cost of owning shares of the ETF may exceed those a client would incur by directly investing in the underlying securities and;
- Trading of an ETF’s shares may be halted if the listing exchange’s officials deem it appropriate, the shares are delisted from the exchange, or the activation of market-wide “circuit breakers” (which are tied to large decreases in stock prices) halts stock trading generally.
Grader Disclosures: Investment in equity strategies involves substantial risk and has the potential for partial or complete loss of funds invested. The sample portfolio and any accompanying charts are for informational purposes only and are not to be construed as a solicitation to buy or sell any financial instrument and should not be relied upon as the sole factor in an investment making decision. As a matter of normal and important disclosures to you, as a potential investor, please consider the following: The performance presented is not based on any actual securities trading, portfolio, or accounts, and the reported performance of the A, B, C, D, and F portfolios (collectively the “model portfolios”) should be considered mere “paper” or pro forma performance results based on Navellier’s research.
Investors evaluating any of Navellier & Associates, Inc.’s, (or its affiliates’) Investment Products must not use any information presented here, including the performance figures of the model portfolios, in their evaluation of any Navellier Investment Products. Navellier Investment Products include the firm’s mutual funds and managed accounts. The model portfolios, charts, and other information presented do not represent actual funded trades and are not actual funded portfolios. There are material differences between Navellier Investment Products’ portfolios and the model portfolios, research, and performance figures presented here. The model portfolios and the research results (1) may contain stocks or ETFs that are illiquid and difficult to trade; (2) may contain stock or ETF holdings materially different from actual funded Navellier Investment Product portfolios; (3) include the reinvestment of all dividends and other earnings, estimated trading costs, commissions, or management fees; and, (4) may not reflect prices obtained in an actual funded Navellier Investment Product portfolio. For these and other reasons, the reported performances of model portfolios do not reflect the performance results of Navellier’s actually funded and traded Investment Products. In most cases, Navellier’s Investment Products have materially lower performance results than the performances of the model portfolios presented.
This report contains statements that are, or may be considered to be, forward-looking statements. All statements that are not historical facts, including statements about our beliefs or expectations, are “forward-looking statements” within the meaning of The U.S. Private Securities Litigation Reform Act of 1995. These statements may be identified by such forward-looking terminology as “expect,” “estimate,” “plan,” “intend,” “believe,” “anticipate,” “may,” “will,” “should,” “could,” “continue,” “project,” or similar statements or variations of such terms. Our forward-looking statements are based on a series of expectations, assumptions, and projections, are not guarantees of future results or performance, and involve substantial risks and uncertainty as described in Form ADV Part 2A of our filing with the Securities and Exchange Commission (SEC), which is available at www.adviserinfo.sec.gov or by requesting a copy by emailing info@navellier.com. All of our forward-looking statements are as of the date of this report only. We can give no assurance that such expectations or forward-looking statements will prove to be correct. Actual results may differ materially. You are urged to carefully consider all such factors.
FEDERAL TAX ADVICE DISCLAIMER: As required by U.S. Treasury Regulations, you are informed that, to the extent this presentation includes any federal tax advice, the presentation is not written by Navellier to be used, and cannot be used, for the purpose of avoiding federal tax penalties. Navellier does not advise on any income tax requirements or issues. Use of any information presented by Navellier is for general information only and does not represent tax advice either express or implied. You are encouraged to seek professional tax advice for income tax questions and assistance.
IMPORTANT NEWSLETTER DISCLOSURE:The hypothetical performance results for investment newsletters that are authored or edited by Louis Navellier, including Louis Navellier’s Growth Investor, Louis Navellier’s Breakthrough Stocks, Louis Navellier’s Accelerated Profits, and Louis Navellier’s Platinum Club, are not based on any actual securities trading, portfolio, or accounts, and the newsletters’ reported hypothetical performances should be considered mere “paper” or proforma hypothetical performance results and are not actual performance of real world trades. Navellier & Associates, Inc. does not have any relation to or affiliation with the owner of these newsletters. There are material differences between Navellier Investment Products’ portfolios and the InvestorPlace Media, LLC newsletter portfolios authored by Louis Navellier. The InvestorPlace Media, LLC newsletters contain hypothetical performance that do not include transaction costs, advisory fees, or other fees a client might incur if actual investments and trades were being made by an investor. As a result, newsletter performance should not be used to evaluate Navellier Investment services which are separate and different from the newsletters. The owner of the newsletters is InvestorPlace Media, LLC and any questions concerning the newsletters, including any newsletter advertising or hypothetical Newsletter performance claims, (which are calculated solely by Investor Place Media and not Navellier) should be referred to InvestorPlace Media, LLC at (800) 718-8289.
Please note that Navellier & Associates and the Navellier Private Client Group are managed completely independent of the newsletters owned and published by InvestorPlace Media, LLC and written and edited by Louis Navellier, and investment performance of the newsletters should in no way be considered indicative of potential future investment performance for any Navellier & Associates separately managed account portfolio. Potential investors should consult with their financial advisor before investing in any Navellier Investment Product.
Navellier claims compliance with Global Investment Performance Standards (GIPS). To receive a complete list and descriptions of Navellier’s composites and/or a presentation that adheres to the GIPS standards, please contact Navellier or click here. It should not be assumed that any securities recommendations made by Navellier & Associates, Inc. in the future will be profitable or equal the performance of securities made in this report.
FactSet Disclosure: Navellier does not independently calculate the statistical information included in the attached report. The calculation and the information are provided by FactSet, a company not related to Navellier. Although information contained in the report has been obtained from FactSet and is based on sources Navellier believes to be reliable, Navellier does not guarantee its accuracy, and it may be incomplete or condensed. The report and the related FactSet sourced information are provided on an “as is” basis. The user assumes the entire risk of any use made of this information. Investors should consider the report as only a single factor in making their investment decision. The report is for informational purposes only and is not intended as an offer or solicitation for the purchase or sale of a security. FactSet sourced information is the exclusive property of FactSet. Without prior written permission of FactSet, this information may not be reproduced, disseminated or used to create any financial products. All indices are unmanaged and performance of the indices include reinvestment of dividends and interest income, unless otherwise noted, are not illustrative of any particular investment and an investment cannot be made in any index. Past performance is no guarantee of future results.