by Jason Bodner
December 23, 2025
It’s human to jump to premature conclusions. If I say the word “camel,” you probably picture a far-off desert in the Middle East, maybe in Saudi Arabia. You may see Bedouin tents flapping in dry winds and lanterns swaying as camels wait patiently outside. That image feels right. But did you know that Saudi Arabia actually import camels? Since the early 2000s, many of those camels have come from Australia.
Suddenly, the picture in your head no longer fits the new reality. Your brain filled in a familiar story of a desert caravan, even though the data said something else entirely. Markets work in the same way.
We all use mental shortcuts when investing. Early impressions, recent experiences, and emotional states shape how we interpret what we see. After a stressful week, for instance, we might fixate on the losses in our portfolios. When markets are calm and drifting higher, we often gloss over any risk and focus on what is working well. Two investors can look at the same market and come away with totally different conclusions, because their starting biases are different. But a fresh look at the data strips away emotion and narrative. It forces us to look at what is actually happening, not what we feel “should be” happening.
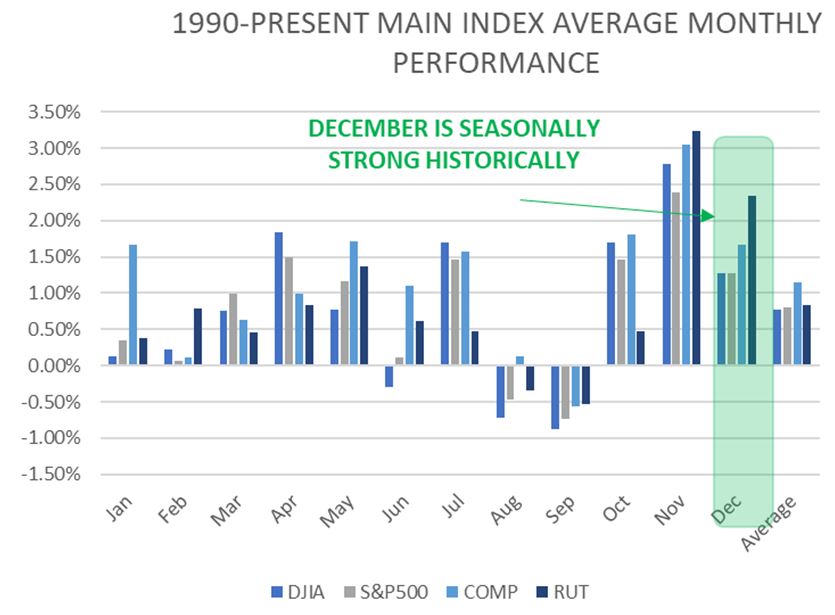
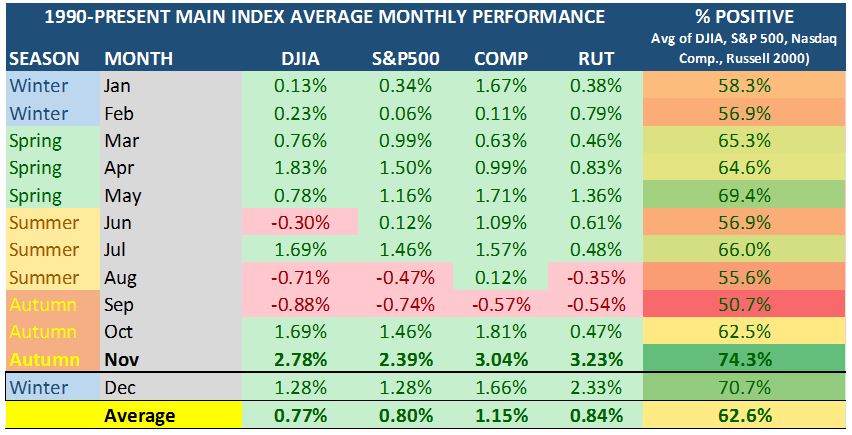
In December, to date, the S&P 500 is down slightly, -0.21% for the month. That alone has sparked plenty of chatter about whether the traditional Santa Claus rally will show up on time this year. Historically, December is a strong month. Since 1990, over 70% of Decembers have ended with positive returns.
Graphs are for illustrative and discussion purposes only. Please read important disclosures at the end of this commentary.
When markets deviate from the norm, it invites doubt… but instead of guessing, let’s turn to the data.
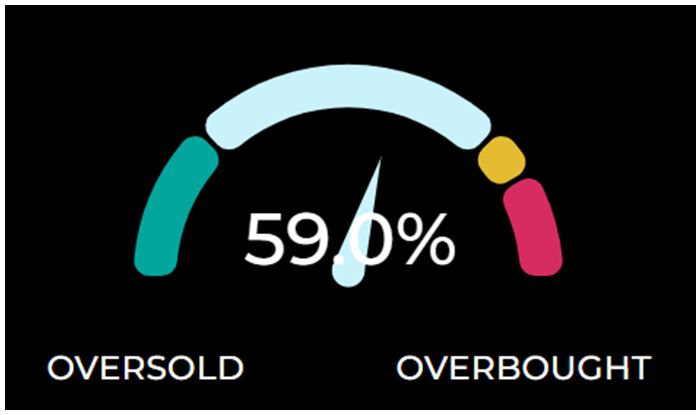
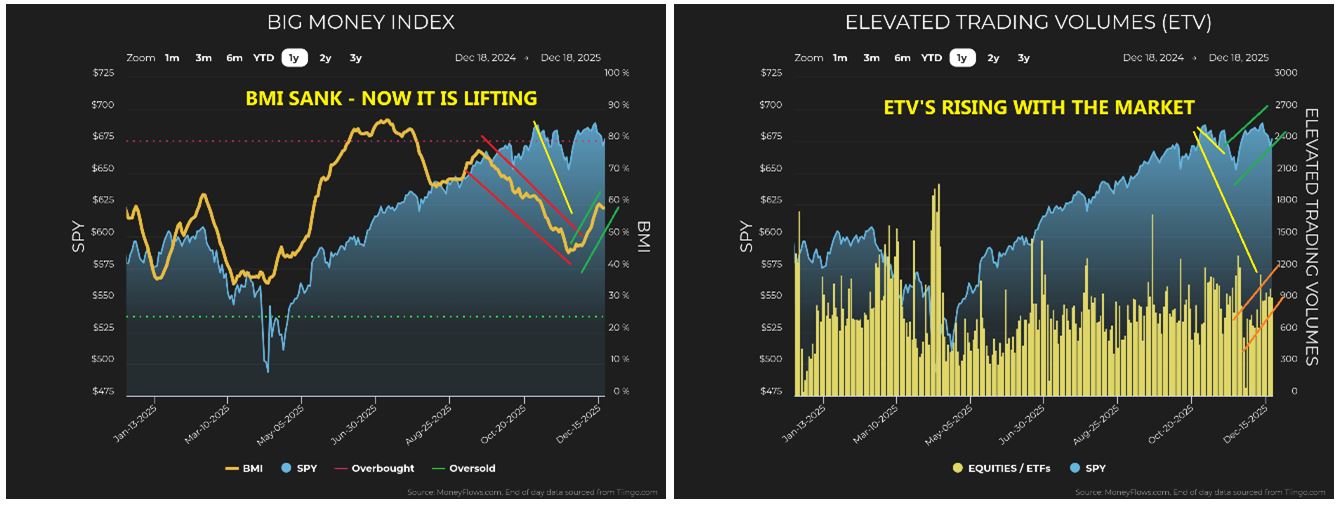
Our first look is at the Big Money Index (BMI). Since its November 20th low, the BMI has been trending higher. It climbed from roughly 45% to about 60% before cooling by a single-point during last week’s choppy action. That pause is not concerning. In fact, it is healthy. What matters is the broader trend, and the underlying metrics remain strong. This is not what a market rolling over typically looks like.
Next, look at Elevated Trading Volume (ETV). The rally off the November lows was accompanied by a surge in unusual volume. That is critical. Price moves backed by volume tend to have durability. Rallies without volume are suspect. Participation is evident this time, and that gives legitimacy to the recovery.
Graphs are for illustrative and discussion purposes only. Please read important disclosures at the end of this commentary.
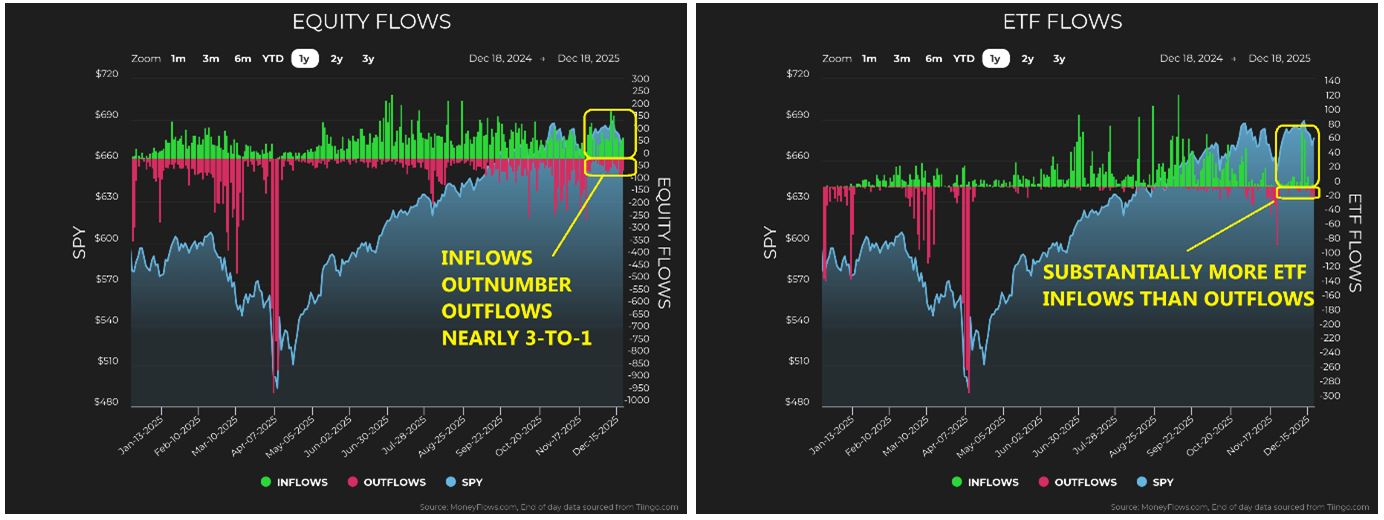
Money Flow data sharpens the picture further. Since November 21st, the day after the market trough, inflows have outweighed outflows by nearly three to one. The cumulative inflow bars have dominated the data, while outflows have remained muted. This is not just true for individual stocks. ETFs show the same pattern of inflows rising and outflows fading. That speaks to broad participation, not narrow speculation.
Graphs are for illustrative and discussion purposes only. Please read important disclosures at the end of this commentary.
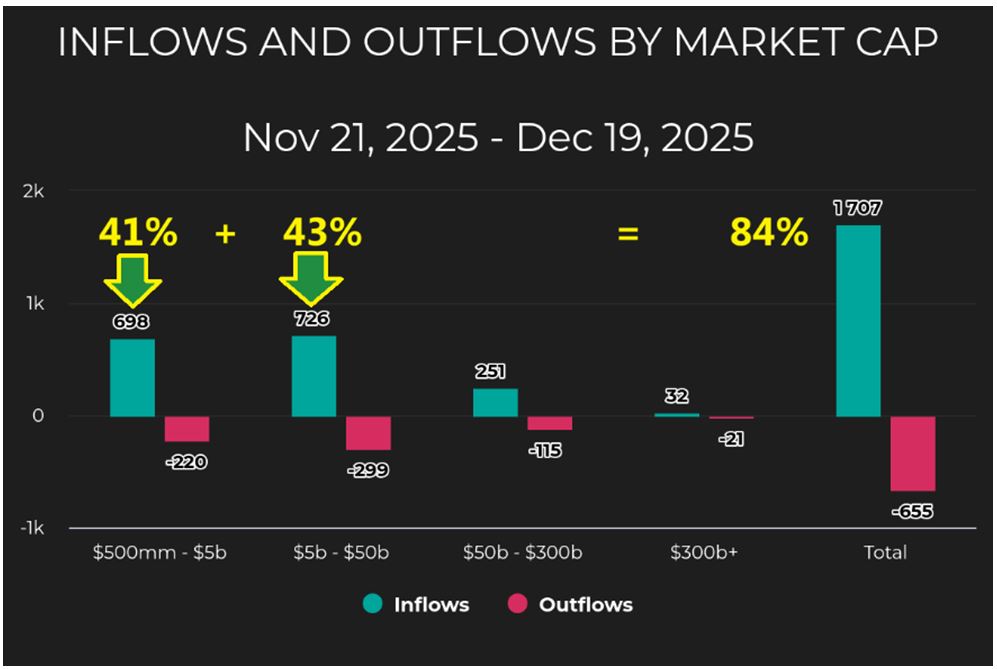
What is even more encouraging is that the money is flowing into growth sectors and smaller stocks. Nearly 84% of all inflow signals since the November lows have been concentrated in companies with market capitalization between $500-million and $5-billion, and $5-billion to $50-billion. These are small-cap and mid-cap companies, often the biggest growth engines of the market. Capital does not rotate into this part of the market when investors are fearful. It does so when confidence is returning.
Graphs are for illustrative and discussion purposes only. Please read important disclosures at the end of this commentary.
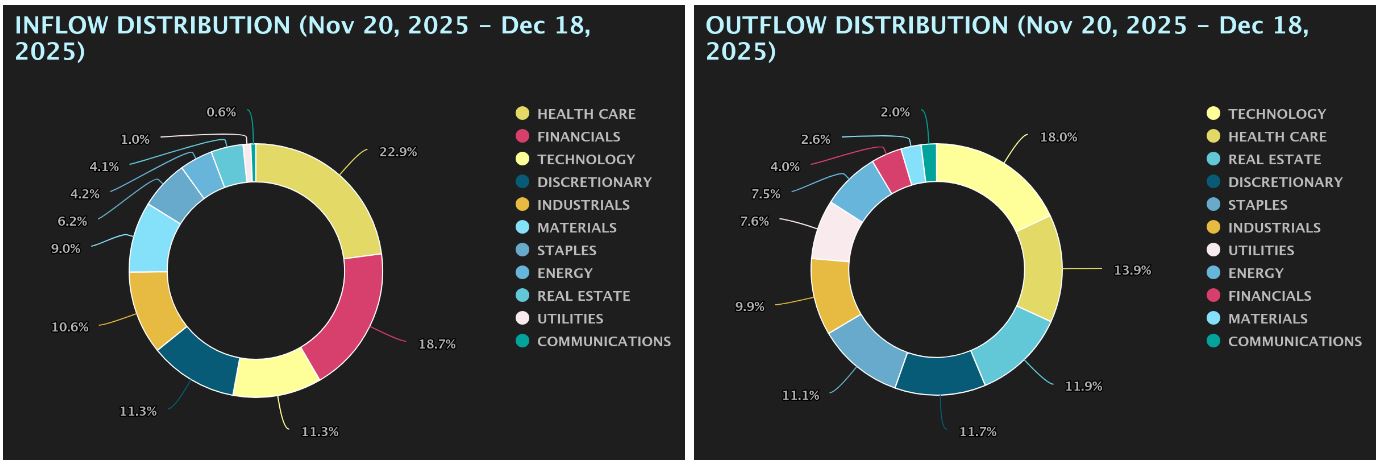
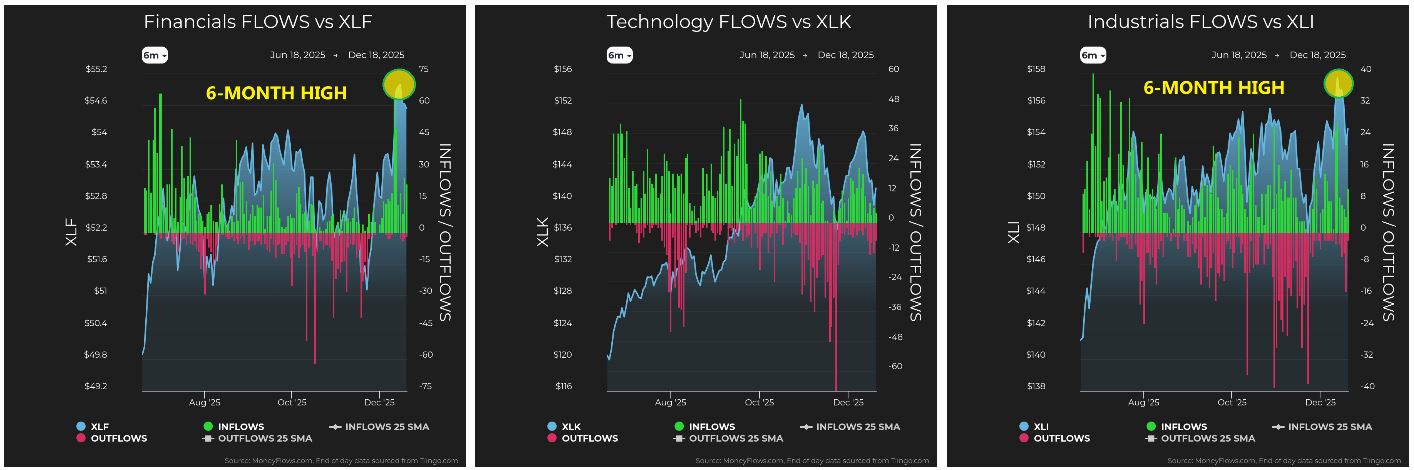
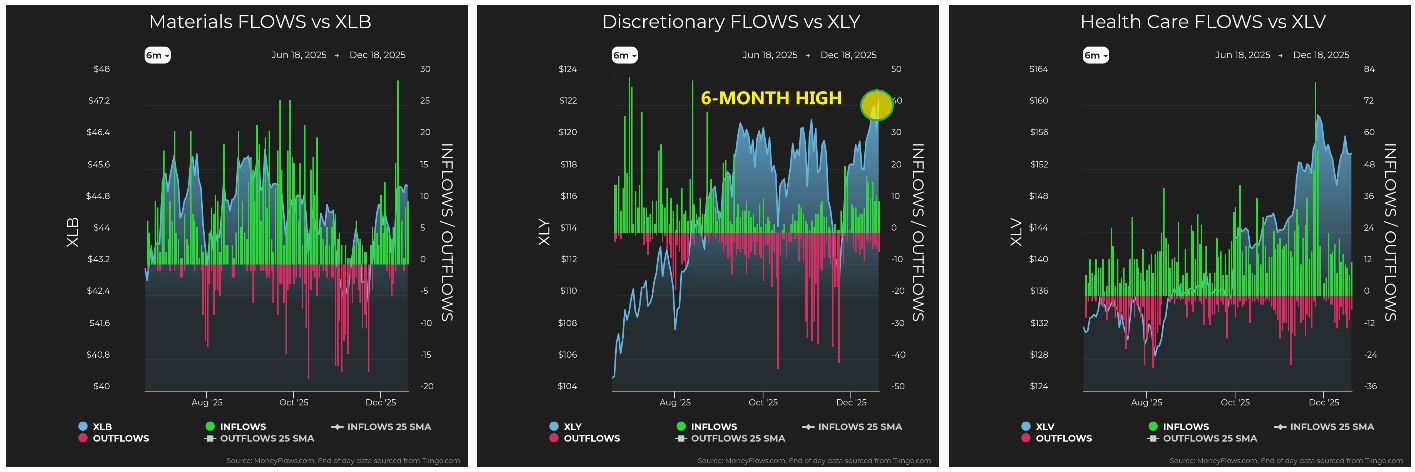
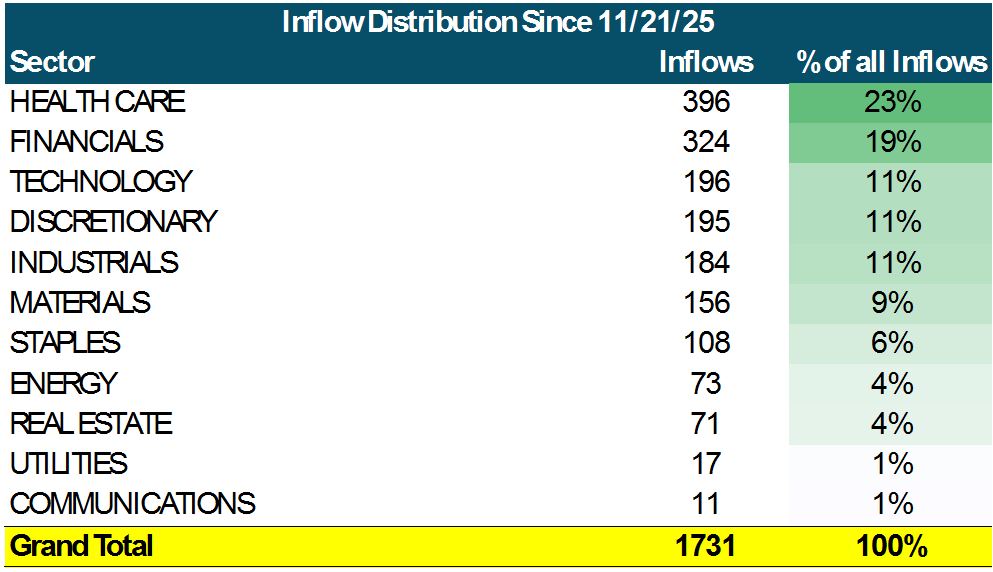
Sector flows reinforce that message. Since the November lows, the strongest inflows have gone to Technology, Health Care, Industrials, Energy, and Discretionary – all growth-oriented sectors. When these sectors are among the leaders, it tells us investors are positioning for expansion, not contraction.
Graphs are for illustrative and discussion purposes only. Please read important disclosures at the end of this commentary.
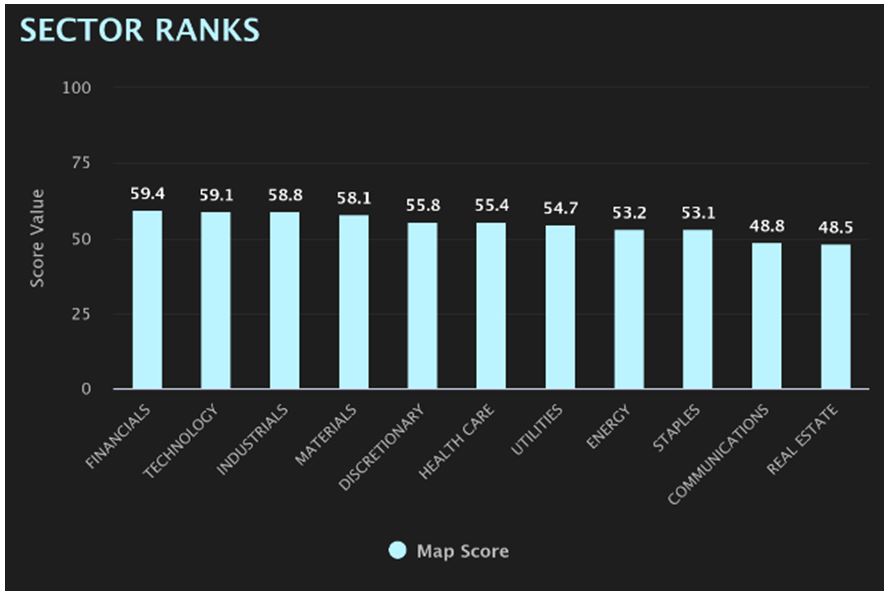
Sector rankings tell a similar story. Technology, Industrials, and Discretionary sit firmly in the top tier:
Graphs are for illustrative and discussion purposes only. Please read important disclosures at the end of this commentary.
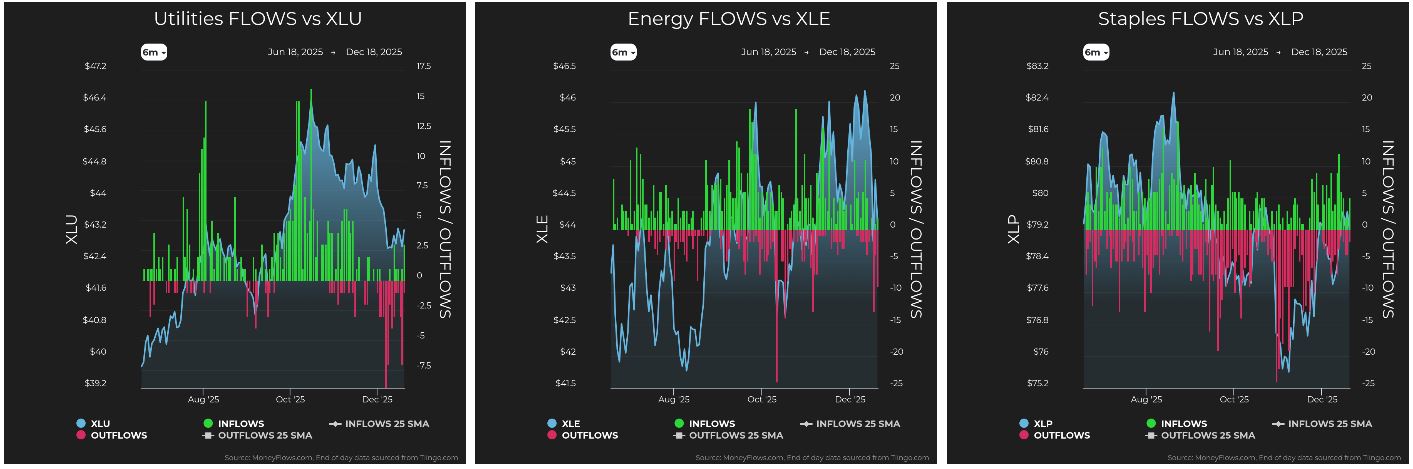
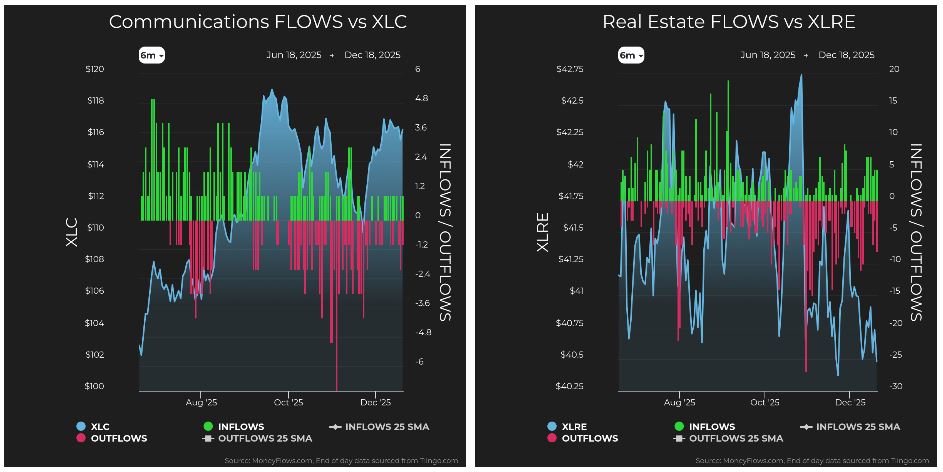
Financials recently pushed to a six-month high, as did Industrials. Discretionary are doing the same thing, and that is particularly important, as it signals confidence in the consumer and in disposable income flowing through the economy. Meanwhile, the weakest sectors are Utilities, Staples, and Real Estate.
In short, growth is acting like growth, and defense is acting defensive.
Graphs are for illustrative and discussion purposes only. Please read important disclosures at the end of this commentary.
That was not always the case. For a stretch, Utilities sat near the top of the rankings, albeit from a trend toward fervor over AI power. That inversion has now corrected. Utilities have slipped to the middle of the pack, and leadership has rotated back toward cyclical and growth-oriented areas of the market.
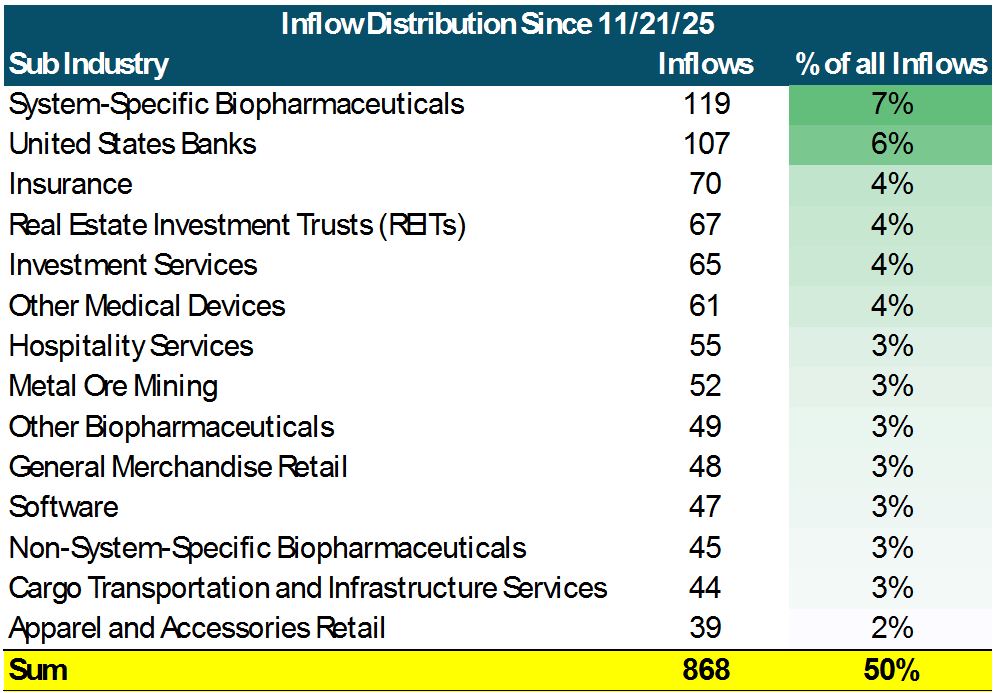
Looking deeper, the story is consistent. Since the November lows, Health Care, Financials, Technology, Discretionary, and Industrials have absorbed the majority of inflows. When we break this down further we see roughly half of all inflows have been in pharmaceuticals, banks, insurance, investment firms, hospitality, mining, software, and apparel. These are not hiding places. They reflect some risk appetite.
Graphs are for illustrative and discussion purposes only. Please read important disclosures at the end of this commentary.
I would like to see even more Technology and Discretionary representation here, but the trend is moving in the right direction. The groundwork is being laid. Taken together, the message is clear. Despite short-term noise, the market is behaving in a constructive way. Flows suggest a favorable setup for the final days of the year, with a reasonable chance of turning December positive. More importantly, the positioning sets the stage for momentum to carry into the new year and beyond.
Markets can deceive us, just like our assumptions about camels. What feels obvious is not always correct. That is why data, not narrative, deserves our attention. As investors, our job is not to predict. It is to observe, adapt, and follow where the money is actually going.
“Reality is merely an illusion, albeit a very persistent one.” – Albert Einstein
All content above represents the opinion of Jason Bodner of Navellier & Associates, Inc.
Also In This Issue
A Look Ahead by Louis Navellier
“Bad” Economic News Is Often Seen as Good Market News
Income Mail by Bryan Perry
Gold Has More Room to Rise in 2026
Growth Mail by Gary Alexander
My Top 10 Books from 2025 (Part 2: Conclusion)
Global Mail by Ivan Martchev
There is Still Time to Get to S&P 7,000 in 2025
Sector Spotlight by Jason Bodner
Seeing Beyond Our Stubborn Biases
View Full Archive
Read Past Issues Here

Jason Bodner
MARKETMAIL EDITOR FOR SECTOR SPOTLIGHT
Jason Bodner writes Sector Spotlight in the weekly Marketmail publication and has authored several white papers for the company. He is also Co-Founder of Macro Analytics for Professionals which produces proprietary equity accumulation and distribution research for its clients. Previously, Mr. Bodner served as Director of European Equity Derivatives for Cantor Fitzgerald Europe in London, then moved to the role of Head of Equity Derivatives North America for the same company in New York. He also served as S.V.P. Equity Derivatives for Jefferies, LLC. He received a B.S. in business administration in 1996, with honors, from Skidmore College as a member of the Periclean Honors Society. All content of “Sector Spotlight” represents the opinion of Jason Bodner
Important Disclosures:
Jason Bodner is a co-founder and co-owner of Mapsignals. Mr. Bodner is an independent contractor who is occasionally hired by Navellier & Associates to write an article and or provide opinions for possible use in articles that appear in Navellier & Associates weekly Market Mail. Mr. Bodner is not employed or affiliated with Louis Navellier, Navellier & Associates, Inc., or any other Navellier owned entity. The opinions and statements made here are those of Mr. Bodner and not necessarily those of any other persons or entities. This is not an endorsement, or solicitation or testimonial or investment advice regarding the BMI Index or any statements or recommendations or analysis in the article or the BMI Index or Mapsignals or its products or strategies.
Although information in these reports has been obtained from and is based upon sources that Navellier believes to be reliable, Navellier does not guarantee its accuracy and it may be incomplete or condensed. All opinions and estimates constitute Navellier’s judgment as of the date the report was created and are subject to change without notice. These reports are for informational purposes only and are not a solicitation for the purchase or sale of a security. Any decision to purchase securities mentioned in these reports must take into account existing public information on such securities or any registered prospectus.To the extent permitted by law, neither Navellier & Associates, Inc., nor any of its affiliates, agents, or service providers assumes any liability or responsibility nor owes any duty of care for any consequences of any person acting or refraining to act in reliance on the information contained in this communication or for any decision based on it.
Past performance is no indication of future results. Investment in securities involves significant risk and has the potential for partial or complete loss of funds invested. It should not be assumed that any securities recommendations made by Navellier. in the future will be profitable or equal the performance of securities made in this report. Dividend payments are not guaranteed. The amount of a dividend payment, if any, can vary over time and issuers may reduce dividends paid on securities in the event of a recession or adverse event affecting a specific industry or issuer.
None of the stock information, data, and company information presented herein constitutes a recommendation by Navellier or a solicitation to buy or sell any securities. Any specific securities identified and described do not represent all of the securities purchased, sold, or recommended for advisory clients. The holdings identified do not represent all of the securities purchased, sold, or recommended for advisory clients and the reader should not assume that investments in the securities identified and discussed were or will be profitable.
Information presented is general information that does not take into account your individual circumstances, financial situation, or needs, nor does it present a personalized recommendation to you. Individual stocks presented may not be suitable for every investor. Investment in securities involves significant risk and has the potential for partial or complete loss of funds invested. Investment in fixed income securities has the potential for the investment return and principal value of an investment to fluctuate so that an investor’s holdings, when redeemed, may be worth less than their original cost.
One cannot invest directly in an index. Index is unmanaged and index performance does not reflect deduction of fees, expenses, or taxes. Presentation of Index data does not reflect a belief by Navellier that any stock index constitutes an investment alternative to any Navellier equity strategy or is necessarily comparable to such strategies. Among the most important differences between the Indices and Navellier strategies are that the Navellier equity strategies may (1) incur material management fees, (2) concentrate its investments in relatively few stocks, industries, or sectors, (3) have significantly greater trading activity and related costs, and (4) be significantly more or less volatile than the Indices.
ETF Risk: We may invest in exchange traded funds (“ETFs”) and some of our investment strategies are generally fully invested in ETFs. Like traditional mutual funds, ETFs charge asset-based fees, but they generally do not charge initial sales charges or redemption fees and investors typically pay only customary brokerage fees to buy and sell ETF shares. The fees and costs charged by ETFs held in client accounts will not be deducted from the compensation the client pays Navellier. ETF prices can fluctuate up or down, and a client account could lose money investing in an ETF if the prices of the securities owned by the ETF go down. ETFs are subject to additional risks:
- ETF shares may trade above or below their net asset value;
- An active trading market for an ETF’s shares may not develop or be maintained;
- The value of an ETF may be more volatile than the underlying portfolio of securities the ETF is designed to track;
- The cost of owning shares of the ETF may exceed those a client would incur by directly investing in the underlying securities and;
- Trading of an ETF’s shares may be halted if the listing exchange’s officials deem it appropriate, the shares are delisted from the exchange, or the activation of market-wide “circuit breakers” (which are tied to large decreases in stock prices) halts stock trading generally.
Grader Disclosures: Investment in equity strategies involves substantial risk and has the potential for partial or complete loss of funds invested. The sample portfolio and any accompanying charts are for informational purposes only and are not to be construed as a solicitation to buy or sell any financial instrument and should not be relied upon as the sole factor in an investment making decision. As a matter of normal and important disclosures to you, as a potential investor, please consider the following: The performance presented is not based on any actual securities trading, portfolio, or accounts, and the reported performance of the A, B, C, D, and F portfolios (collectively the “model portfolios”) should be considered mere “paper” or pro forma performance results based on Navellier’s research.
Investors evaluating any of Navellier & Associates, Inc.’s, (or its affiliates’) Investment Products must not use any information presented here, including the performance figures of the model portfolios, in their evaluation of any Navellier Investment Products. Navellier Investment Products include the firm’s mutual funds and managed accounts. The model portfolios, charts, and other information presented do not represent actual funded trades and are not actual funded portfolios. There are material differences between Navellier Investment Products’ portfolios and the model portfolios, research, and performance figures presented here. The model portfolios and the research results (1) may contain stocks or ETFs that are illiquid and difficult to trade; (2) may contain stock or ETF holdings materially different from actual funded Navellier Investment Product portfolios; (3) include the reinvestment of all dividends and other earnings, estimated trading costs, commissions, or management fees; and, (4) may not reflect prices obtained in an actual funded Navellier Investment Product portfolio. For these and other reasons, the reported performances of model portfolios do not reflect the performance results of Navellier’s actually funded and traded Investment Products. In most cases, Navellier’s Investment Products have materially lower performance results than the performances of the model portfolios presented.
This report contains statements that are, or may be considered to be, forward-looking statements. All statements that are not historical facts, including statements about our beliefs or expectations, are “forward-looking statements” within the meaning of The U.S. Private Securities Litigation Reform Act of 1995. These statements may be identified by such forward-looking terminology as “expect,” “estimate,” “plan,” “intend,” “believe,” “anticipate,” “may,” “will,” “should,” “could,” “continue,” “project,” or similar statements or variations of such terms. Our forward-looking statements are based on a series of expectations, assumptions, and projections, are not guarantees of future results or performance, and involve substantial risks and uncertainty as described in Form ADV Part 2A of our filing with the Securities and Exchange Commission (SEC), which is available at www.adviserinfo.sec.gov or by requesting a copy by emailing info@navellier.com. All of our forward-looking statements are as of the date of this report only. We can give no assurance that such expectations or forward-looking statements will prove to be correct. Actual results may differ materially. You are urged to carefully consider all such factors.
FEDERAL TAX ADVICE DISCLAIMER: As required by U.S. Treasury Regulations, you are informed that, to the extent this presentation includes any federal tax advice, the presentation is not written by Navellier to be used, and cannot be used, for the purpose of avoiding federal tax penalties. Navellier does not advise on any income tax requirements or issues. Use of any information presented by Navellier is for general information only and does not represent tax advice either express or implied. You are encouraged to seek professional tax advice for income tax questions and assistance.
IMPORTANT NEWSLETTER DISCLOSURE:The hypothetical performance results for investment newsletters that are authored or edited by Louis Navellier, including Louis Navellier’s Growth Investor, Louis Navellier’s Breakthrough Stocks, Louis Navellier’s Accelerated Profits, and Louis Navellier’s Platinum Club, are not based on any actual securities trading, portfolio, or accounts, and the newsletters’ reported hypothetical performances should be considered mere “paper” or proforma hypothetical performance results and are not actual performance of real world trades. Navellier & Associates, Inc. does not have any relation to or affiliation with the owner of these newsletters. There are material differences between Navellier Investment Products’ portfolios and the InvestorPlace Media, LLC newsletter portfolios authored by Louis Navellier. The InvestorPlace Media, LLC newsletters contain hypothetical performance that do not include transaction costs, advisory fees, or other fees a client might incur if actual investments and trades were being made by an investor. As a result, newsletter performance should not be used to evaluate Navellier Investment services which are separate and different from the newsletters. The owner of the newsletters is InvestorPlace Media, LLC and any questions concerning the newsletters, including any newsletter advertising or hypothetical Newsletter performance claims, (which are calculated solely by Investor Place Media and not Navellier) should be referred to InvestorPlace Media, LLC at (800) 718-8289.
Please note that Navellier & Associates and the Navellier Private Client Group are managed completely independent of the newsletters owned and published by InvestorPlace Media, LLC and written and edited by Louis Navellier, and investment performance of the newsletters should in no way be considered indicative of potential future investment performance for any Navellier & Associates separately managed account portfolio. Potential investors should consult with their financial advisor before investing in any Navellier Investment Product.
Navellier claims compliance with Global Investment Performance Standards (GIPS). To receive a complete list and descriptions of Navellier’s composites and/or a presentation that adheres to the GIPS standards, please contact Navellier or click here. It should not be assumed that any securities recommendations made by Navellier & Associates, Inc. in the future will be profitable or equal the performance of securities made in this report.
FactSet Disclosure: Navellier does not independently calculate the statistical information included in the attached report. The calculation and the information are provided by FactSet, a company not related to Navellier. Although information contained in the report has been obtained from FactSet and is based on sources Navellier believes to be reliable, Navellier does not guarantee its accuracy, and it may be incomplete or condensed. The report and the related FactSet sourced information are provided on an “as is” basis. The user assumes the entire risk of any use made of this information. Investors should consider the report as only a single factor in making their investment decision. The report is for informational purposes only and is not intended as an offer or solicitation for the purchase or sale of a security. FactSet sourced information is the exclusive property of FactSet. Without prior written permission of FactSet, this information may not be reproduced, disseminated or used to create any financial products. All indices are unmanaged and performance of the indices include reinvestment of dividends and interest income, unless otherwise noted, are not illustrative of any particular investment and an investment cannot be made in any index. Past performance is no guarantee of future results.