by Jason Bodner
November 11, 2025
Before the current TSA backlog, during any normal business day there are 12,000 to 14,000-commercial planes in the sky at any given moment, and more than 20,000-flights, if you include military, private, and cargo-planes, carrying a combined 3.2-million people. Despite that seemingly crowded sky above us, the global all-accident rate for commercial aviation in 2024 was just 1.13-accidents per-million flights – or about one-accident for every 880,000-flights. In other words, 99.99+% of all flights are accident-free.
But not all flights are smooth. If I were the captain of a flight, I’d say: “Please remain seated and keep your seat-belt fastened. We’re likely to hit turbulence at any time, as we usually suffer bumpy-patches.”
Investing is like any other journey: The route from point A to point B is rarely a straight-line. Twists and turns make life interesting, but they also make some investors impatient and anxious. Right now, despite expecting clear skies for a historically strong seasonal month, early November is encountering turbulence.
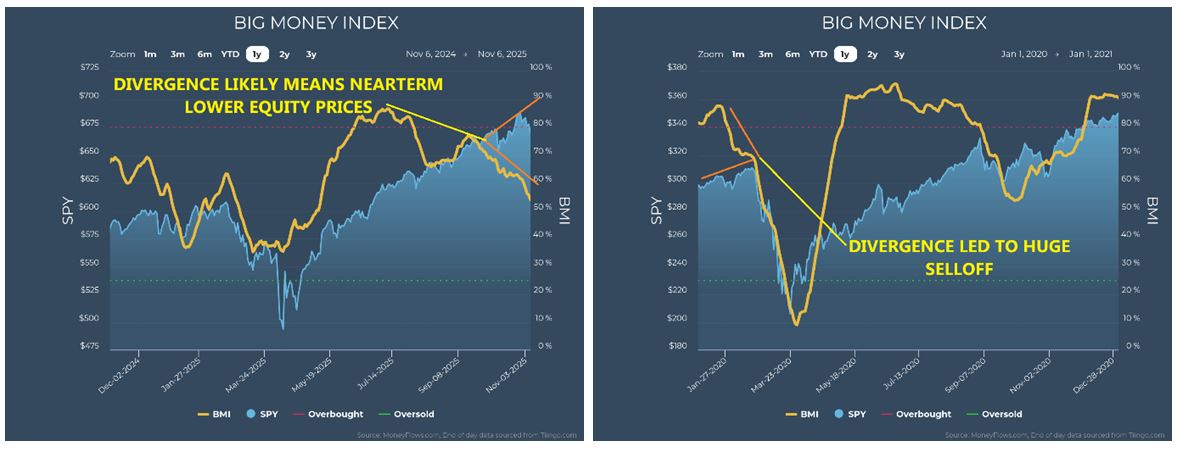
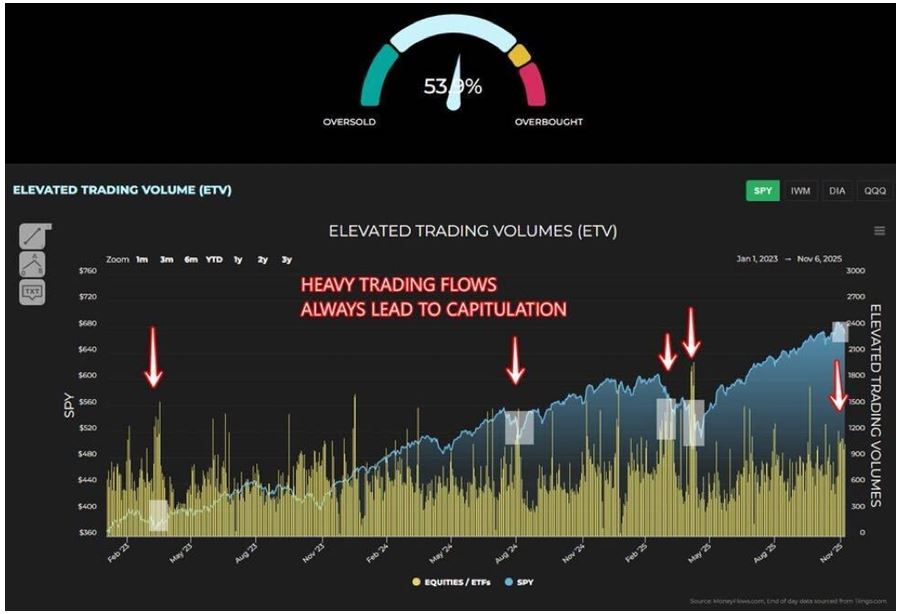
Under the surface, there is wicked volatility going on. Proof? Let’s begin with the Big Money Index (BMI), the MoneyFlows.com indicator of unusually large money flows. This is a 25-day moving average of all heavy inflows and outflows. Dipping below 54%, it is sinking – and has been since mid-September.

Most indexes hit new highs recently, but I don’t think that surge will continue, short-term. If I were a doom-and-gloom pessimist, I could scare you by saying the most obvious analog to today’s situation was in January of 2020, when the same divergence pattern led to an historic drop – CoVID-induced, of course.
Graphs are for illustrative and discussion purposes only. Please read important disclosures at the end of this commentary.
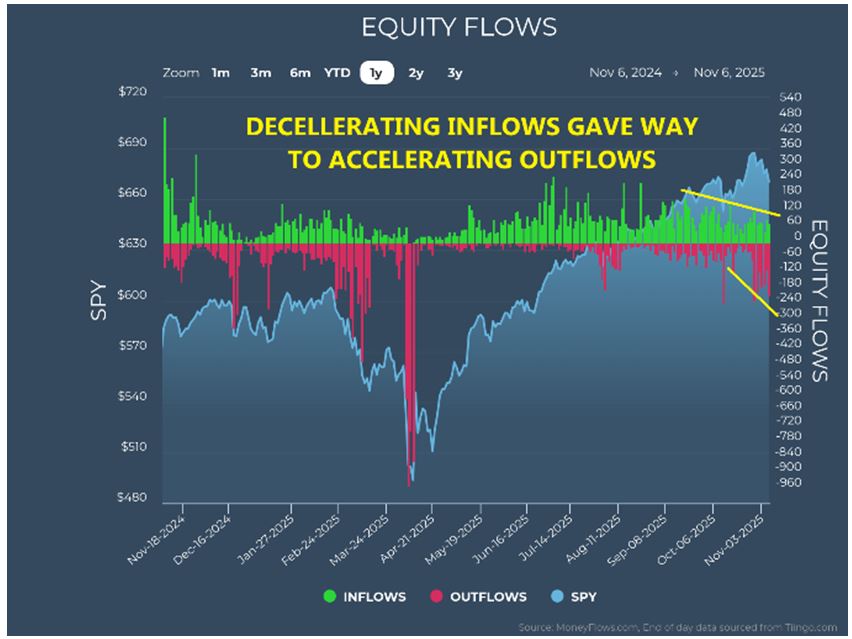
But I’m no Debbie-Downer and this isn’t 2020. Conditions today are far healthier. Early in this BMI slide, inflows decelerated; only in the last few sessions did outflows start to accelerate.
Graphs are for illustrative and discussion purposes only. Please read important disclosures at the end of this commentary.
Will that shift spread into a broader market correction? Possibly. There are several factors to consider:
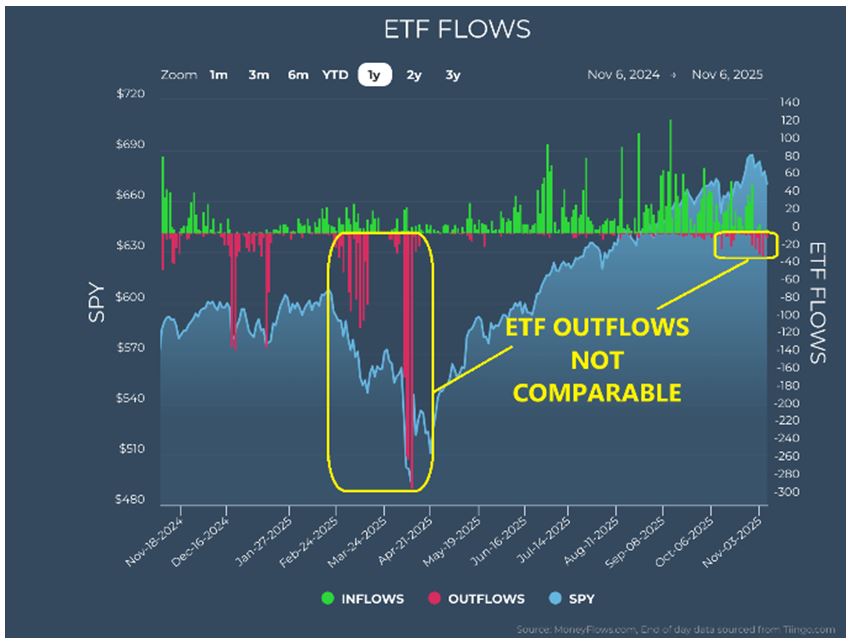
First, when corrections deepen and ultimately reach peak intensity, outflows are everywhere.
ETFs are a great measure for monitoring when the herd starts rushing for the exits. Look at the ETF flows chart, and you’ll clearly see April saw immense and unsustainable outflows from ETFs. By comparison, the recent air-pocket has yielded only a slight-elevation in outflows:
Graphs are for illustrative and discussion purposes only. Please read important disclosures at the end of this commentary.
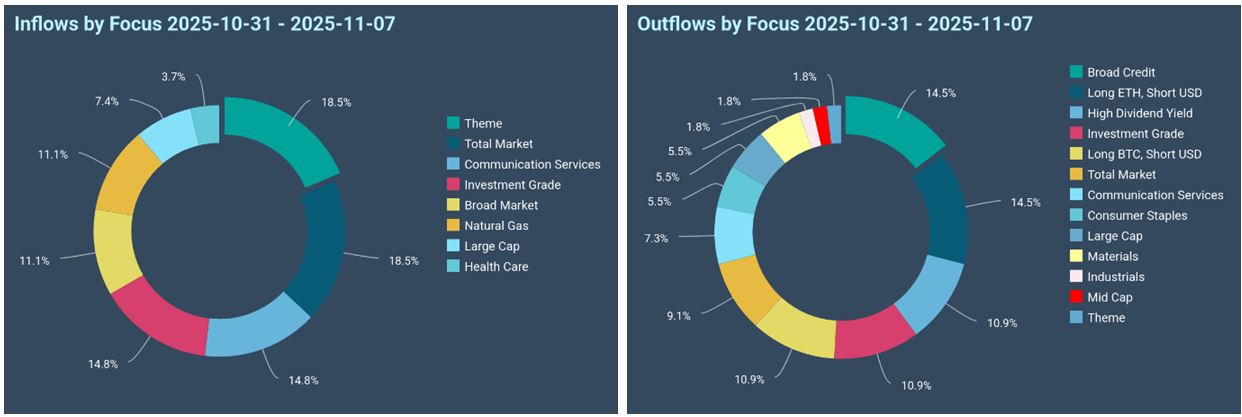
It is important to qualify the distribution of flows for ETFs. Below, we can see inflows on the left, and outflows on the right. Money is rushing out of credit and crypto-currency. Inflows are moving into more defensive areas like Investment Grade, Communications, and diversified Total Market.
That said, don’t put too much weight on inflows, because they have been scarce in the last week.
Graphs are for illustrative and discussion purposes only. Please read important disclosures at the end of this commentary.
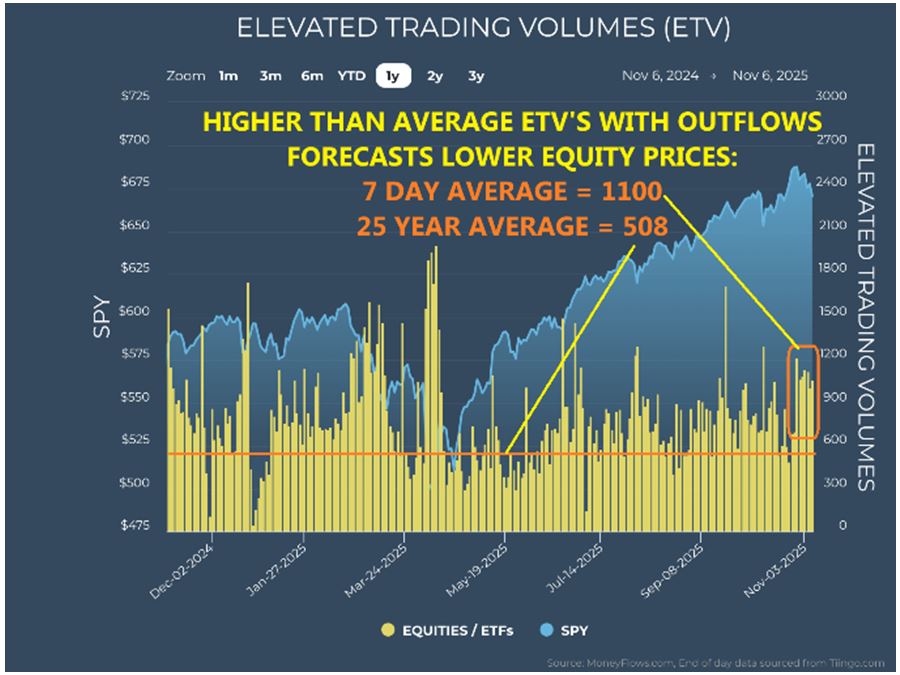
Next, we’ll look at ETVs (Elevated Trading Volumes). Think of these yellow-bars as unusually large trades. The past six-sessions have seen higher-than-average trading activity. Historically, this type of above-average volume is associated with pressure in the equity market.
The good news is that, when it subsides, it is usually associated with a bounce.
Graphs are for illustrative and discussion purposes only. Please read important disclosures at the end of this commentary.
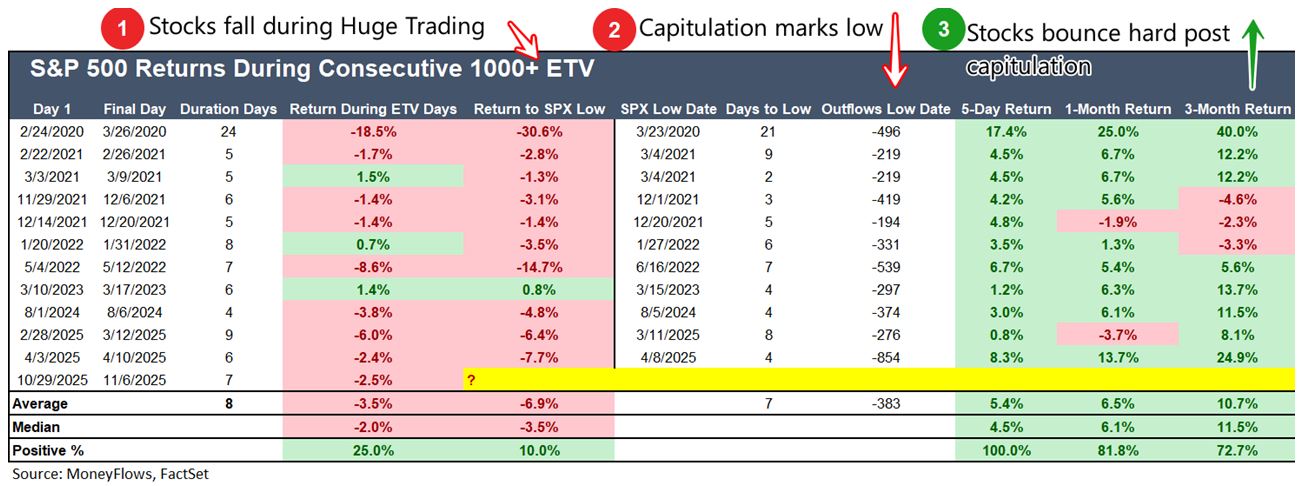
If this continues, the historical playbook (sampled below) makes the turbulence bearable:
- Step 1: Huge volumes trigger sell-off.
- Step 2: Capitulation marks the bottom.
- Step 3: A huge rally follows.
Here is a diagnostic table of how that playbook has repeated itself, just since 2020:
Graphs are for illustrative and discussion purposes only. Please read important disclosures at the end of this commentary.
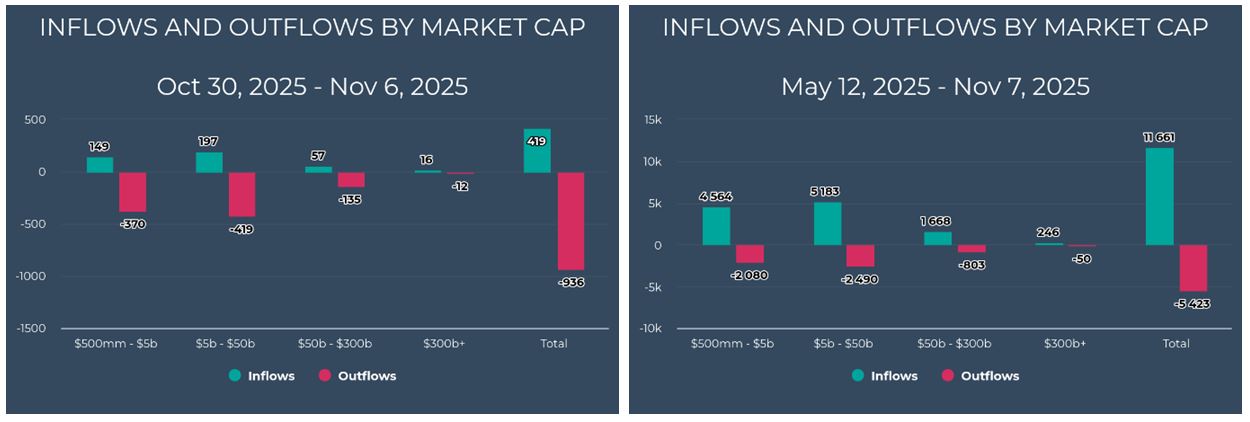
Looking at how equity flows are distributed helps us contextualize history versus today. Since outflows started picking up just before Halloween, small-cap and mid-cap stocks have borne the brunt of selling. That is notable because they have been the biggest beneficiaries, by far, since Trump delayed tariffs on May 12.
Graphs are for illustrative and discussion purposes only. Please read important disclosures at the end of this commentary.
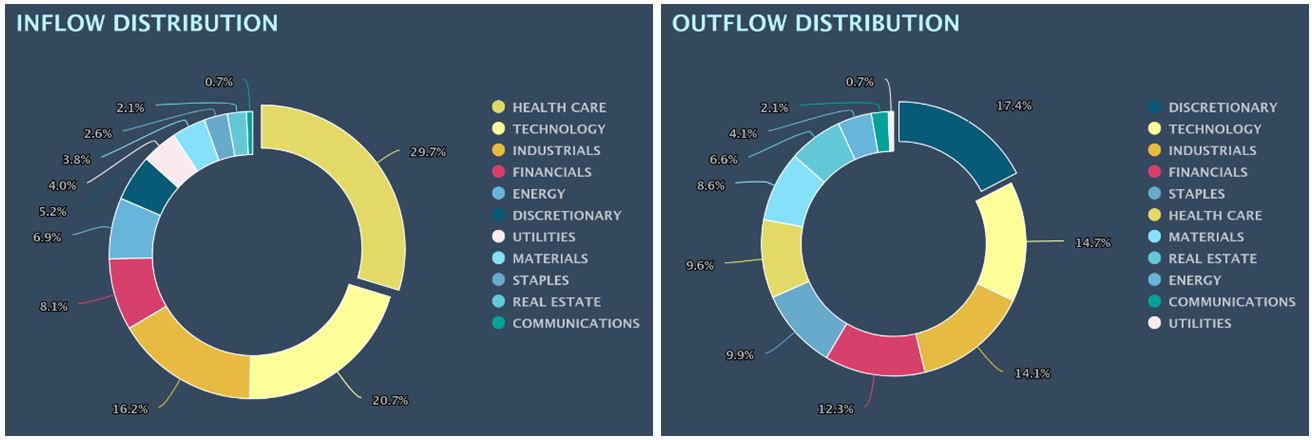
Turning our attention to sector-flows, we again must not put too much weight on inflows as they have been lower (in number) compared to outflows. Again, flows into Technology and Industrials are encouraging – those are growth-heavy sectors. The outflows are more disconcerting. Discretionary, Technology, Industrials, and Financials have led the market higher since the spring. Over the last week, they are feeling the burn.
Graphs are for illustrative and discussion purposes only. Please read important disclosures at the end of this commentary.
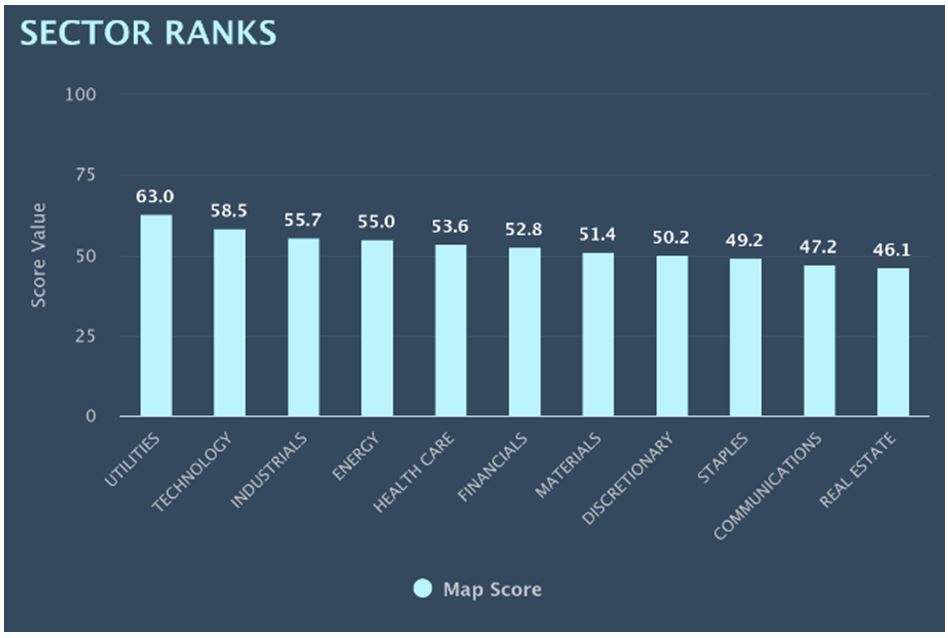
This sudden shift is naturally affecting sector ranks. Utilities are pulling away from the pack as investors rotate into safety. Note that Discretionary remains near the bottom of the ranks. We like to see strong Discretionary stocks indicating a healthy consumer and positive sentiment. We aren’t seeing that now.
Graphs are for illustrative and discussion purposes only. Please read important disclosures at the end of this commentary.
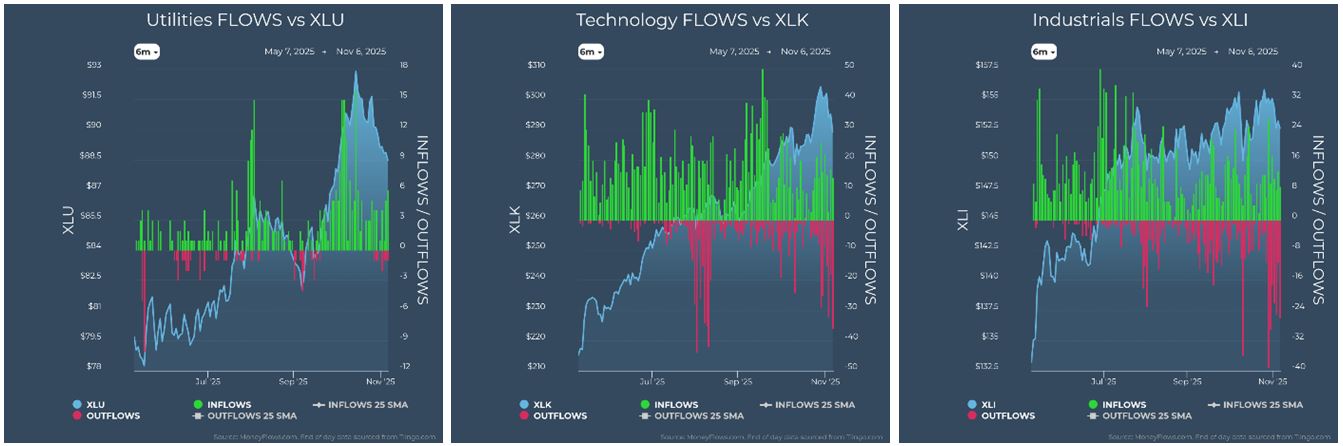
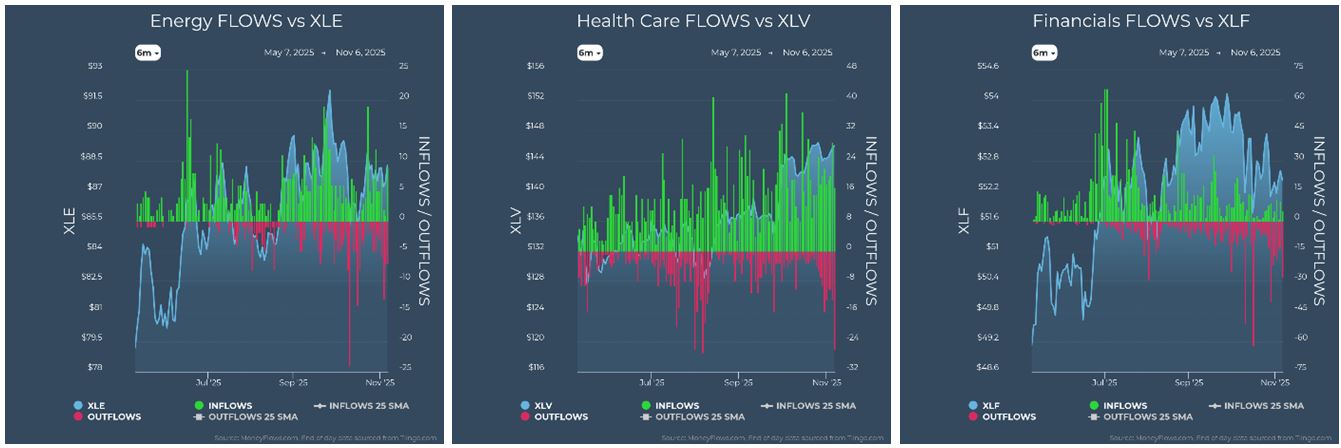
Setting our sights on individual sector activity, there is some strange stuff happening. XLU – the Utilities sector ETF – is falling while registering net inflows. That’s odd, but Utilities and Technology have been parabolic, so a pullback was expected. Both pulled back, although Technology saw outflow signals. Industrials, despite trading near-highs, are seeing net outflows. Health Care has slight net inflows and is trading at 6-month highs. Financials (XLF) are sagging, with only minor net outflows. Materials and Staples exhibit behavior you’d expect – outflows driving down the sector. Discretionary is concerning because XLY is at 6-month highs yet seeing hefty outflows. Real Estate has had sharp swings as it dropped from its high suddenly.
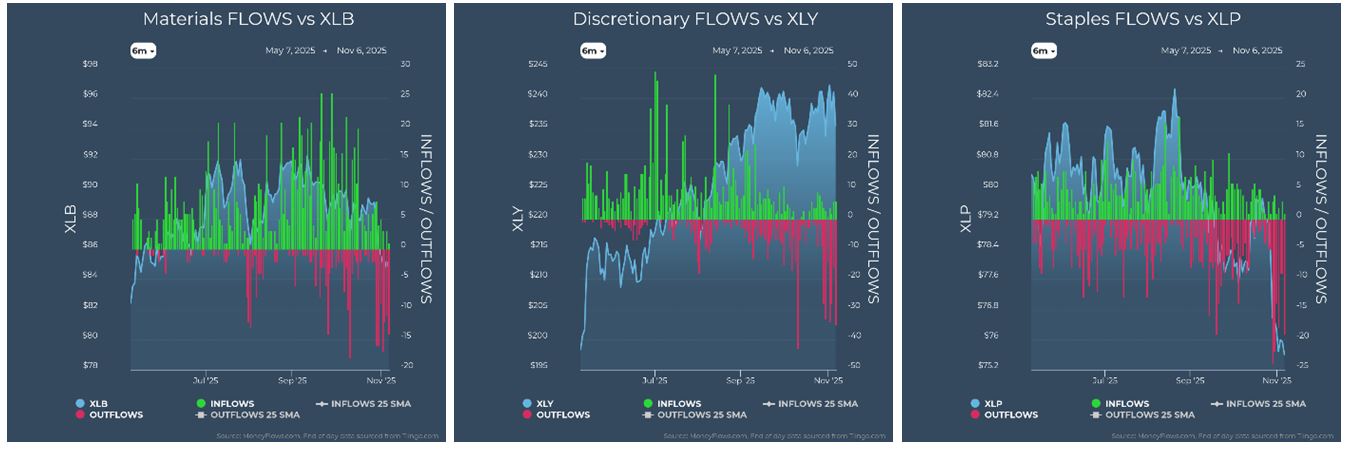
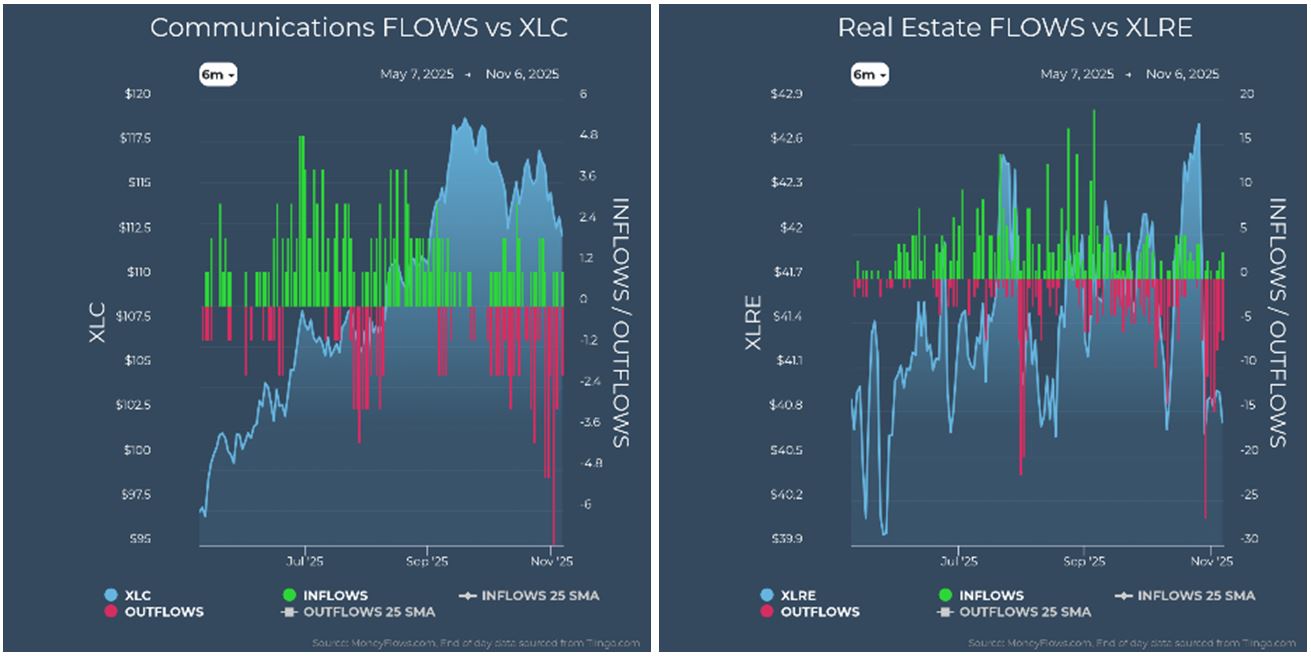
Graphs are for illustrative and discussion purposes only. Please read important disclosures at the end of this commentary.
This is what you’d expect to see when clear-air turns suddenly rough.
After reviewing the data, here is what I think will happen: Markets rise long-term, but not uninterrupted. Healthy corrections are good. Long, unchecked bull-runs can create conditions for major volatility spikes. Negative news weighs-heavy on stocks. Elections might shift the sentiment. The shut-down drags on to record-lengths. The FAA may ground 10% of flights ahead of Thanksgiving week. The downside is the stalemate intensifies, but when issues regularly affect every day Americans, we get closer to resolution.
A pullback is good and healthy. It helps keep markets regular, and it offers a buying opportunity.
Let’s not forget these macro tailwinds:
- Rates must fall and they will – a boost to bottom lines for borrower.
- Taxes are lowering – also a boost to bottom lines.
- Earnings are great. As of November 7th for Q3 2025 (with 91% of S&P 500 companies reporting), 82% beat earnings expectations and 77% beat sales expectations.
Markets get moody sometimes, and that’s where we are, but systemically there is nothing wrong. Sentimentally, there is. Try not fretting about what will be. History shows us that we will be fine.
“True happiness is… to enjoy the present, without anxious dependence upon the future.” – Seneca
All content above represents the opinion of Jason Bodner of Navellier & Associates, Inc.
Also In This Issue
A Look Ahead by Louis Navellier
Is This the Start of a “Roaring ‘20s” Market and Economy?
Income Mail by Bryan Perry
Musings from a Mixed-Up Early November Market
Growth Mail by Gary Alexander
Veterans Day Market (and Military) Milestones
Global Mail by Ivan Martchev
The Pullback is Over, If….
Sector Spotlight by Jason Bodner
Turbulence Strikes During Most Flights…and in Most Market Months
View Full Archive
Read Past Issues Here

Jason Bodner
MARKETMAIL EDITOR FOR SECTOR SPOTLIGHT
Jason Bodner writes Sector Spotlight in the weekly Marketmail publication and has authored several white papers for the company. He is also Co-Founder of Macro Analytics for Professionals which produces proprietary equity accumulation and distribution research for its clients. Previously, Mr. Bodner served as Director of European Equity Derivatives for Cantor Fitzgerald Europe in London, then moved to the role of Head of Equity Derivatives North America for the same company in New York. He also served as S.V.P. Equity Derivatives for Jefferies, LLC. He received a B.S. in business administration in 1996, with honors, from Skidmore College as a member of the Periclean Honors Society. All content of “Sector Spotlight” represents the opinion of Jason Bodner
Important Disclosures:
Jason Bodner is a co-founder and co-owner of Mapsignals. Mr. Bodner is an independent contractor who is occasionally hired by Navellier & Associates to write an article and or provide opinions for possible use in articles that appear in Navellier & Associates weekly Market Mail. Mr. Bodner is not employed or affiliated with Louis Navellier, Navellier & Associates, Inc., or any other Navellier owned entity. The opinions and statements made here are those of Mr. Bodner and not necessarily those of any other persons or entities. This is not an endorsement, or solicitation or testimonial or investment advice regarding the BMI Index or any statements or recommendations or analysis in the article or the BMI Index or Mapsignals or its products or strategies.
Although information in these reports has been obtained from and is based upon sources that Navellier believes to be reliable, Navellier does not guarantee its accuracy and it may be incomplete or condensed. All opinions and estimates constitute Navellier’s judgment as of the date the report was created and are subject to change without notice. These reports are for informational purposes only and are not a solicitation for the purchase or sale of a security. Any decision to purchase securities mentioned in these reports must take into account existing public information on such securities or any registered prospectus.To the extent permitted by law, neither Navellier & Associates, Inc., nor any of its affiliates, agents, or service providers assumes any liability or responsibility nor owes any duty of care for any consequences of any person acting or refraining to act in reliance on the information contained in this communication or for any decision based on it.
Past performance is no indication of future results. Investment in securities involves significant risk and has the potential for partial or complete loss of funds invested. It should not be assumed that any securities recommendations made by Navellier. in the future will be profitable or equal the performance of securities made in this report. Dividend payments are not guaranteed. The amount of a dividend payment, if any, can vary over time and issuers may reduce dividends paid on securities in the event of a recession or adverse event affecting a specific industry or issuer.
None of the stock information, data, and company information presented herein constitutes a recommendation by Navellier or a solicitation to buy or sell any securities. Any specific securities identified and described do not represent all of the securities purchased, sold, or recommended for advisory clients. The holdings identified do not represent all of the securities purchased, sold, or recommended for advisory clients and the reader should not assume that investments in the securities identified and discussed were or will be profitable.
Information presented is general information that does not take into account your individual circumstances, financial situation, or needs, nor does it present a personalized recommendation to you. Individual stocks presented may not be suitable for every investor. Investment in securities involves significant risk and has the potential for partial or complete loss of funds invested. Investment in fixed income securities has the potential for the investment return and principal value of an investment to fluctuate so that an investor’s holdings, when redeemed, may be worth less than their original cost.
One cannot invest directly in an index. Index is unmanaged and index performance does not reflect deduction of fees, expenses, or taxes. Presentation of Index data does not reflect a belief by Navellier that any stock index constitutes an investment alternative to any Navellier equity strategy or is necessarily comparable to such strategies. Among the most important differences between the Indices and Navellier strategies are that the Navellier equity strategies may (1) incur material management fees, (2) concentrate its investments in relatively few stocks, industries, or sectors, (3) have significantly greater trading activity and related costs, and (4) be significantly more or less volatile than the Indices.
ETF Risk: We may invest in exchange traded funds (“ETFs”) and some of our investment strategies are generally fully invested in ETFs. Like traditional mutual funds, ETFs charge asset-based fees, but they generally do not charge initial sales charges or redemption fees and investors typically pay only customary brokerage fees to buy and sell ETF shares. The fees and costs charged by ETFs held in client accounts will not be deducted from the compensation the client pays Navellier. ETF prices can fluctuate up or down, and a client account could lose money investing in an ETF if the prices of the securities owned by the ETF go down. ETFs are subject to additional risks:
- ETF shares may trade above or below their net asset value;
- An active trading market for an ETF’s shares may not develop or be maintained;
- The value of an ETF may be more volatile than the underlying portfolio of securities the ETF is designed to track;
- The cost of owning shares of the ETF may exceed those a client would incur by directly investing in the underlying securities and;
- Trading of an ETF’s shares may be halted if the listing exchange’s officials deem it appropriate, the shares are delisted from the exchange, or the activation of market-wide “circuit breakers” (which are tied to large decreases in stock prices) halts stock trading generally.
Grader Disclosures: Investment in equity strategies involves substantial risk and has the potential for partial or complete loss of funds invested. The sample portfolio and any accompanying charts are for informational purposes only and are not to be construed as a solicitation to buy or sell any financial instrument and should not be relied upon as the sole factor in an investment making decision. As a matter of normal and important disclosures to you, as a potential investor, please consider the following: The performance presented is not based on any actual securities trading, portfolio, or accounts, and the reported performance of the A, B, C, D, and F portfolios (collectively the “model portfolios”) should be considered mere “paper” or pro forma performance results based on Navellier’s research.
Investors evaluating any of Navellier & Associates, Inc.’s, (or its affiliates’) Investment Products must not use any information presented here, including the performance figures of the model portfolios, in their evaluation of any Navellier Investment Products. Navellier Investment Products include the firm’s mutual funds and managed accounts. The model portfolios, charts, and other information presented do not represent actual funded trades and are not actual funded portfolios. There are material differences between Navellier Investment Products’ portfolios and the model portfolios, research, and performance figures presented here. The model portfolios and the research results (1) may contain stocks or ETFs that are illiquid and difficult to trade; (2) may contain stock or ETF holdings materially different from actual funded Navellier Investment Product portfolios; (3) include the reinvestment of all dividends and other earnings, estimated trading costs, commissions, or management fees; and, (4) may not reflect prices obtained in an actual funded Navellier Investment Product portfolio. For these and other reasons, the reported performances of model portfolios do not reflect the performance results of Navellier’s actually funded and traded Investment Products. In most cases, Navellier’s Investment Products have materially lower performance results than the performances of the model portfolios presented.
This report contains statements that are, or may be considered to be, forward-looking statements. All statements that are not historical facts, including statements about our beliefs or expectations, are “forward-looking statements” within the meaning of The U.S. Private Securities Litigation Reform Act of 1995. These statements may be identified by such forward-looking terminology as “expect,” “estimate,” “plan,” “intend,” “believe,” “anticipate,” “may,” “will,” “should,” “could,” “continue,” “project,” or similar statements or variations of such terms. Our forward-looking statements are based on a series of expectations, assumptions, and projections, are not guarantees of future results or performance, and involve substantial risks and uncertainty as described in Form ADV Part 2A of our filing with the Securities and Exchange Commission (SEC), which is available at www.adviserinfo.sec.gov or by requesting a copy by emailing info@navellier.com. All of our forward-looking statements are as of the date of this report only. We can give no assurance that such expectations or forward-looking statements will prove to be correct. Actual results may differ materially. You are urged to carefully consider all such factors.
FEDERAL TAX ADVICE DISCLAIMER: As required by U.S. Treasury Regulations, you are informed that, to the extent this presentation includes any federal tax advice, the presentation is not written by Navellier to be used, and cannot be used, for the purpose of avoiding federal tax penalties. Navellier does not advise on any income tax requirements or issues. Use of any information presented by Navellier is for general information only and does not represent tax advice either express or implied. You are encouraged to seek professional tax advice for income tax questions and assistance.
IMPORTANT NEWSLETTER DISCLOSURE:The hypothetical performance results for investment newsletters that are authored or edited by Louis Navellier, including Louis Navellier’s Growth Investor, Louis Navellier’s Breakthrough Stocks, Louis Navellier’s Accelerated Profits, and Louis Navellier’s Platinum Club, are not based on any actual securities trading, portfolio, or accounts, and the newsletters’ reported hypothetical performances should be considered mere “paper” or proforma hypothetical performance results and are not actual performance of real world trades. Navellier & Associates, Inc. does not have any relation to or affiliation with the owner of these newsletters. There are material differences between Navellier Investment Products’ portfolios and the InvestorPlace Media, LLC newsletter portfolios authored by Louis Navellier. The InvestorPlace Media, LLC newsletters contain hypothetical performance that do not include transaction costs, advisory fees, or other fees a client might incur if actual investments and trades were being made by an investor. As a result, newsletter performance should not be used to evaluate Navellier Investment services which are separate and different from the newsletters. The owner of the newsletters is InvestorPlace Media, LLC and any questions concerning the newsletters, including any newsletter advertising or hypothetical Newsletter performance claims, (which are calculated solely by Investor Place Media and not Navellier) should be referred to InvestorPlace Media, LLC at (800) 718-8289.
Please note that Navellier & Associates and the Navellier Private Client Group are managed completely independent of the newsletters owned and published by InvestorPlace Media, LLC and written and edited by Louis Navellier, and investment performance of the newsletters should in no way be considered indicative of potential future investment performance for any Navellier & Associates separately managed account portfolio. Potential investors should consult with their financial advisor before investing in any Navellier Investment Product.
Navellier claims compliance with Global Investment Performance Standards (GIPS). To receive a complete list and descriptions of Navellier’s composites and/or a presentation that adheres to the GIPS standards, please contact Navellier or click here. It should not be assumed that any securities recommendations made by Navellier & Associates, Inc. in the future will be profitable or equal the performance of securities made in this report.
FactSet Disclosure: Navellier does not independently calculate the statistical information included in the attached report. The calculation and the information are provided by FactSet, a company not related to Navellier. Although information contained in the report has been obtained from FactSet and is based on sources Navellier believes to be reliable, Navellier does not guarantee its accuracy, and it may be incomplete or condensed. The report and the related FactSet sourced information are provided on an “as is” basis. The user assumes the entire risk of any use made of this information. Investors should consider the report as only a single factor in making their investment decision. The report is for informational purposes only and is not intended as an offer or solicitation for the purchase or sale of a security. FactSet sourced information is the exclusive property of FactSet. Without prior written permission of FactSet, this information may not be reproduced, disseminated or used to create any financial products. All indices are unmanaged and performance of the indices include reinvestment of dividends and interest income, unless otherwise noted, are not illustrative of any particular investment and an investment cannot be made in any index. Past performance is no guarantee of future results.