by Jason Bodner
October 8, 2024
October usually means a reduction in hurricane activity, but new potential threats are popping up. There are a few storms forming in the Atlantic and one possibly forming in the Gulf of Mexico with potentially the same path as Helene. And given Helene’s cataclysmic destruction, that’s very unwelcome news.
October 12th was the date when Christopher Columbus and his crew arrived in the New World in 1492. He, too, encountered hurricanes on his later voyages. In fact, in 1494, he wrote to Queen Isabella about a storm he has forced to go through, providing the first recorded description of a hurricane to Europeans.
October can be a perplexing month for stock investors, too. Before 1990, October was considered a scary month, but since 1990, the month has been strong. Still, it’s not quite that simple…October has been quite volatile. And then, we have Octobers in election years, like now. They often bring an “October Surprise.” These are market-moving scandals designed to embarrass a political opponent. For example: The Iran Contra Scandal, or a candidate’s drunk driving record, or Hunter Biden’s laptop, or Hillary’s emails.
It can leave us questioning how navigable the month really is.
This week, I will investigate what the data tell us about October, and what we might expect.
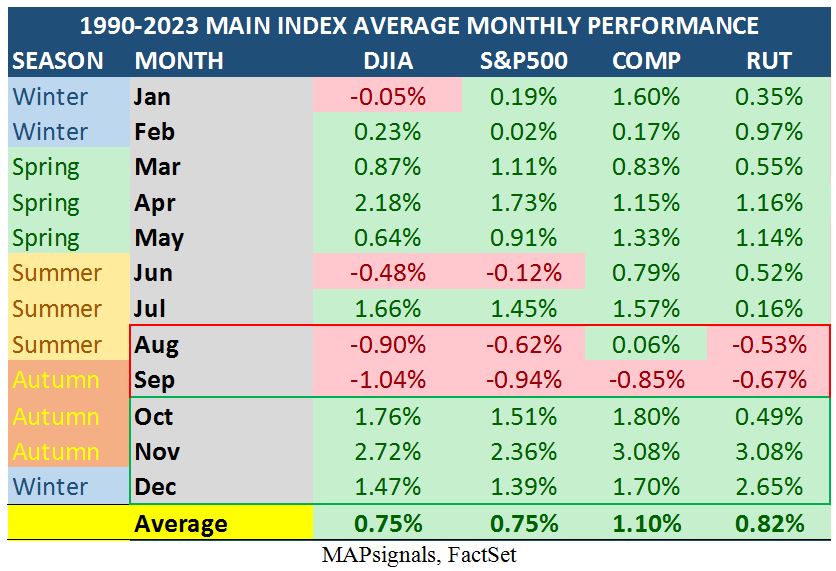
To begin, Octobers are the start of the seasonally strongest quarter of year. As seen in the table below, average returns for October, November and December, 1990 through 2023, are solidly positive:
Graphs are for illustrative and discussion purposes only. Please read important disclosures at the end of this commentary.
The one caveat is that 22 of the last 34 Octobers (since 1990) were positive for the S&P 500 – or 64.7% of the time. Contrast this with a stronger 73.5% for November and 76.5% for December. In any case – the fourth quarter was positive for the S&P 500 71.5% of the time since 1990, which is great!
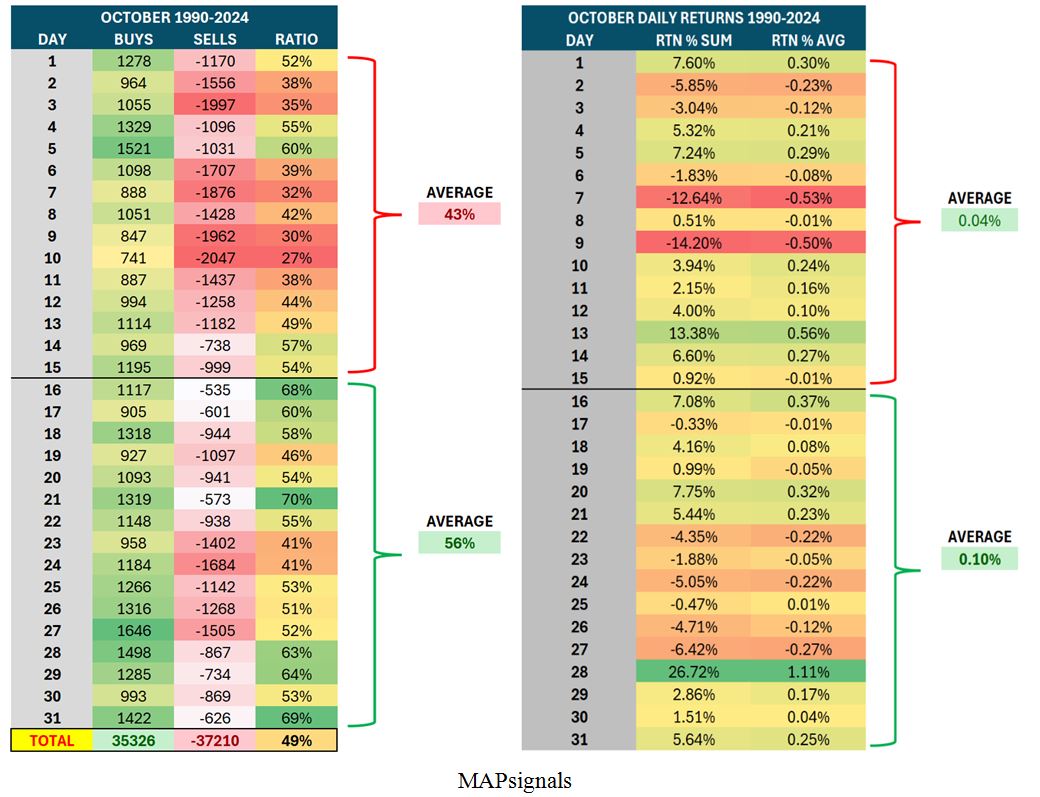
Octobers have a tumultuous side, too. It turns out that the first half of October is visibly weaker on average than the second half. I looked at all Octobers from 1990 to now and saw some interesting things.
First, in the table on the left, we see that the ratio of unusual buying to selling is in favor of the sellers. The average daily ratio from October 1-15 is 43%. There are 10 of 15 days where the ratio is below 50%.
In the chart on the right, we can see that the first half of the month was less strong than the back half. Note that October 28th sported an average +1.11% day or cumulative +26.7%!
Graphs are for illustrative and discussion purposes only. Please read important disclosures at the end of this commentary.
Naturally, results are skewed from some seriously volatile Octobers of years past, most notably: 2005, 2008, 2011, 2014, 2018, 2020, and 2023, not to mention that off-the-chart traumatic October in 1987.
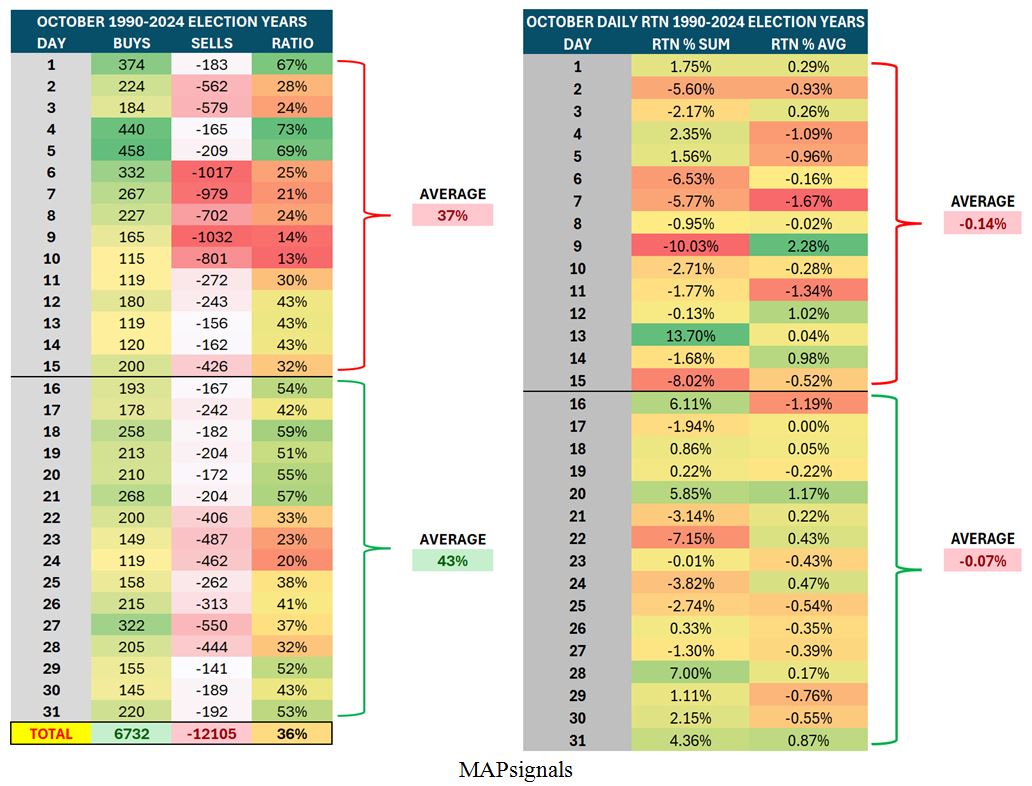
Now, let’s look at election years encompassing the potential October surprise. The election years in our survey were 1992, 1996, 2000, 2004, 2008, 2012, 2016, and 2020. The first thing we notice in the same chart is that the first half of election year Octobers are weaker than normal years. Election year second halves of October are stronger than regular years. Again, there are volatile years in there, such as 2008:
Graphs are for illustrative and discussion purposes only. Please read important disclosures at the end of this commentary.
What is also very striking is that Octobers during election years are negative, with an average return of -2.5% whereas the average of all Octobers is +1.5%. So, we shouldn’t sweat a choppy first two weeks, since they are expected. The last two weeks are usually quite good. Election years hold a little more volatility, but they still show a stronger back two weeks than first two weeks.
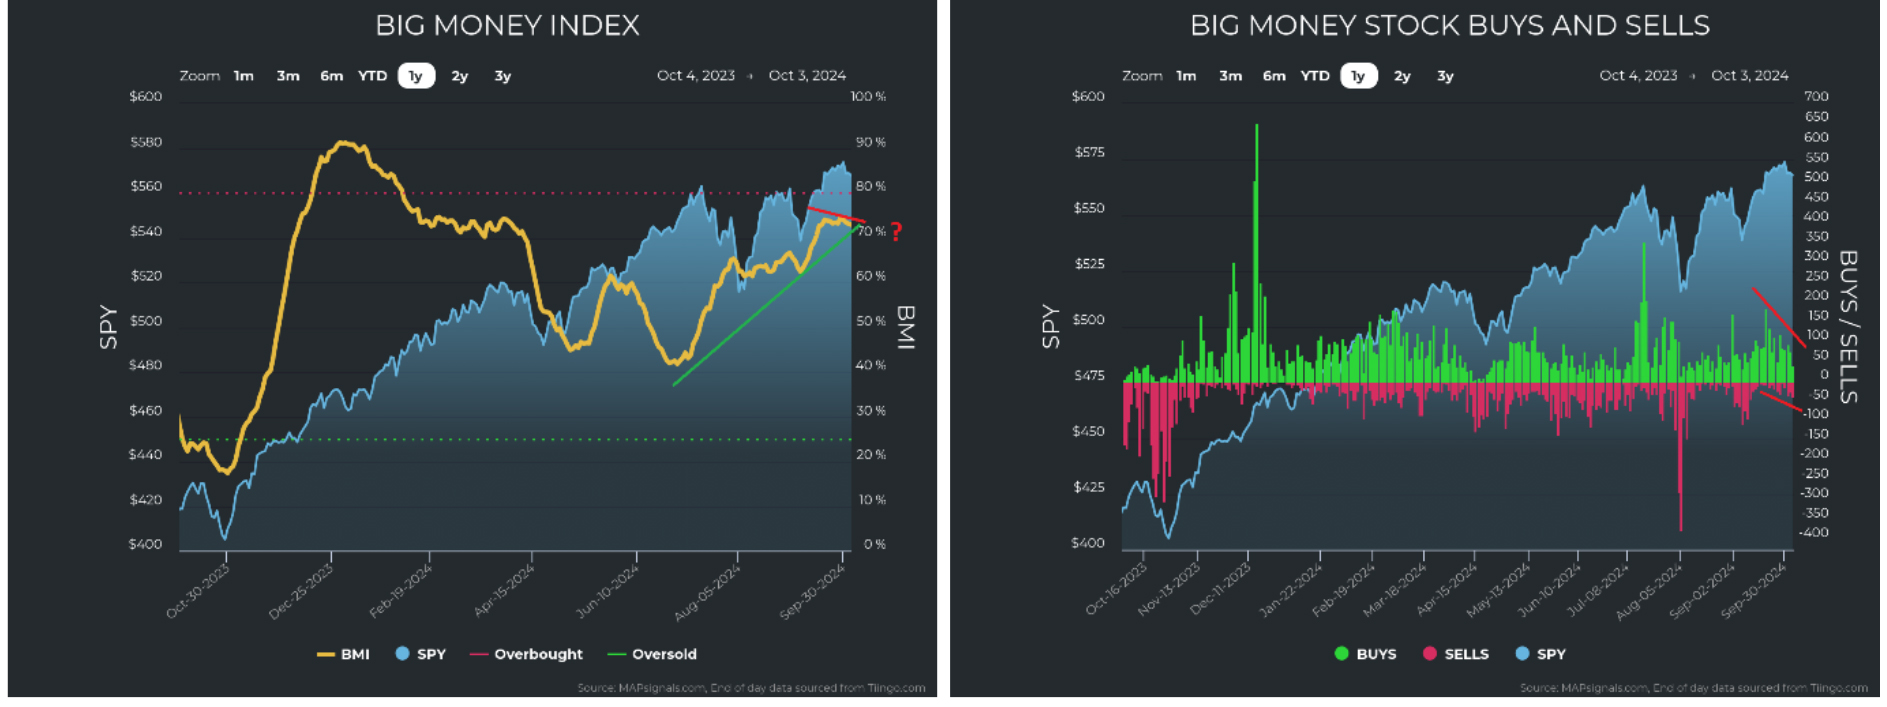
This is consistent with what I am seeing in the Big Money Index (BMI). We saw a mammoth rip in the BMI since July as money came flooding into stocks, although in a choppy path. The SPY (the S&P 500 tracking ETF) also rose during that time. Since late August, however, the BMI flattened-out and even down ticked over the past few days, from 74.5 on September 29th to 72.9 today. If October follows its historical implications, we might expect the BMI to fall in the first half of October (the left chart).
Graphs are for illustrative and discussion purposes only. Please read important disclosures at the end of this commentary.
We also need to keep an eye on unusual buying and selling. We can see in the chart on the right that buying hit a local peak on September 19th and has been steadily declining since. Selling has also seen a small uptick. I am not alarmed, but it would not be surprising to me to see some more October volatility.
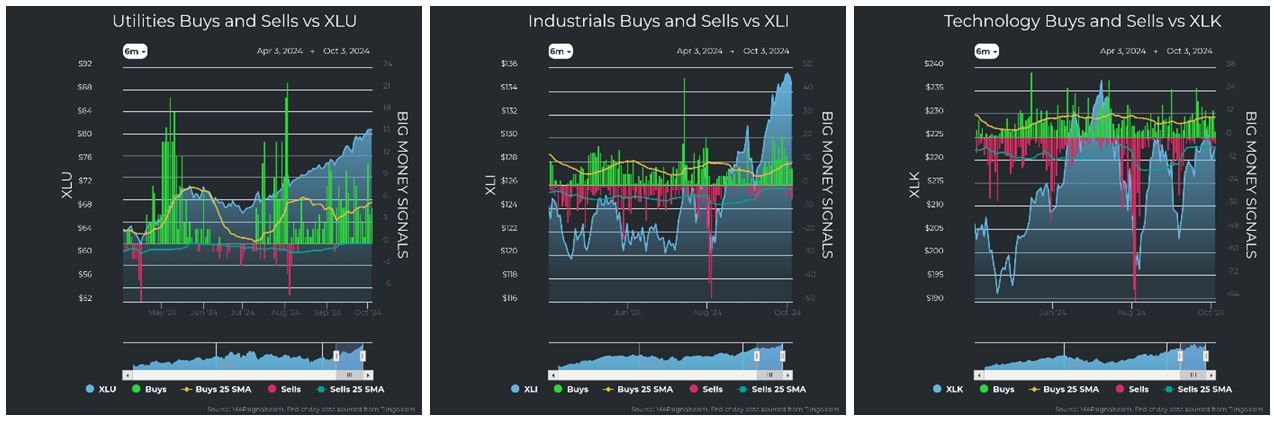
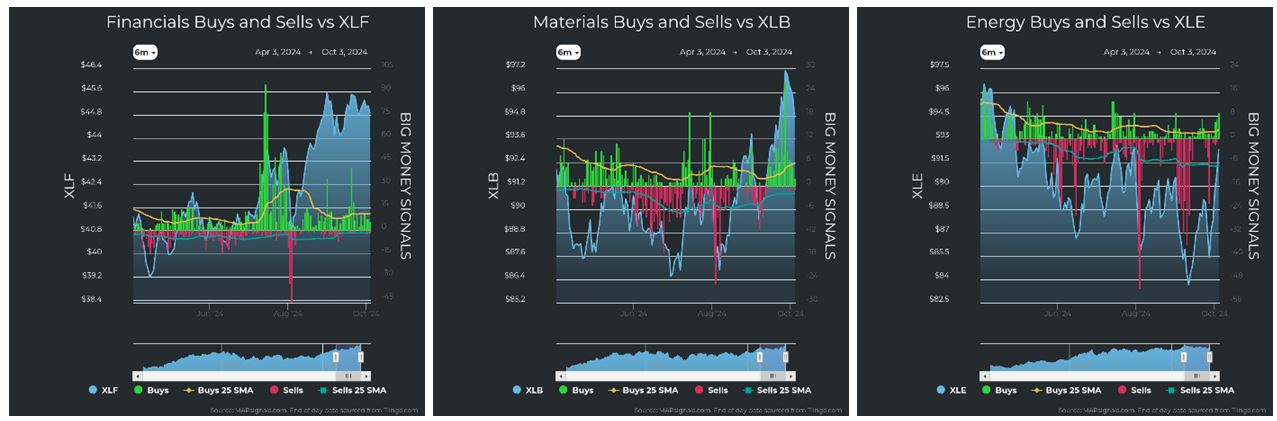
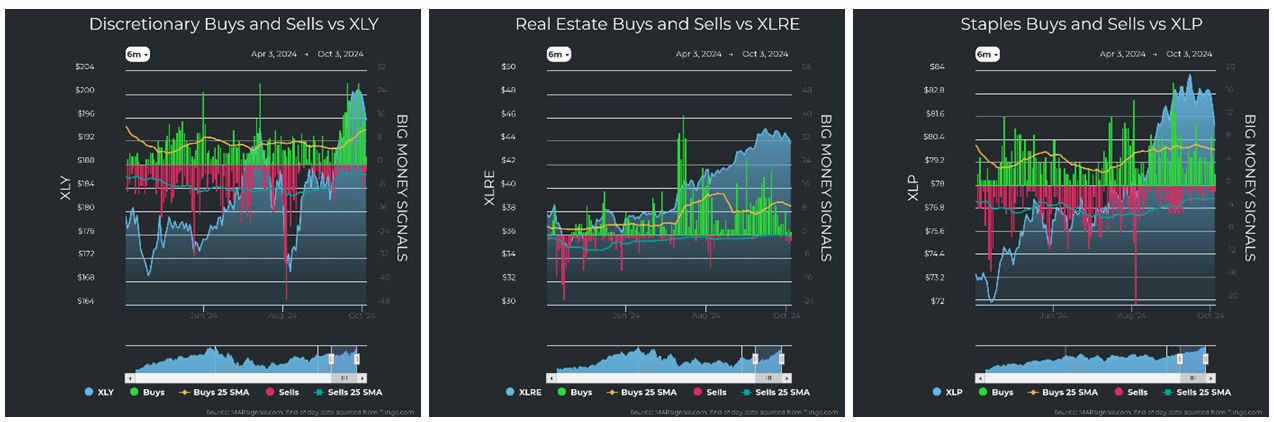
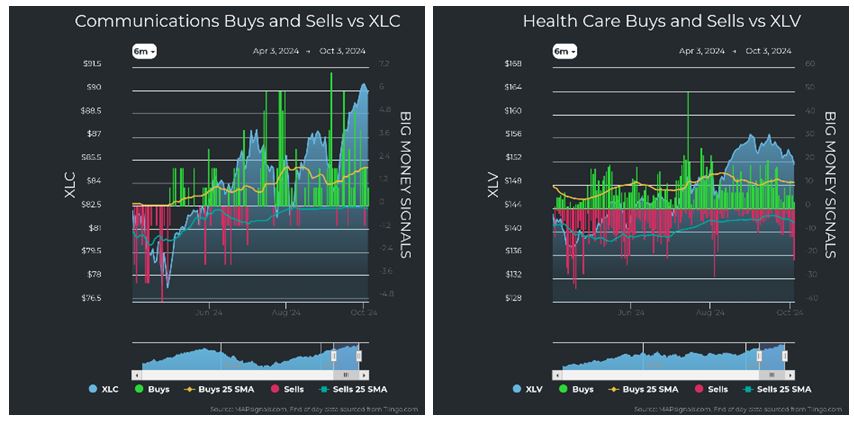
We can also see the stalling effect of the Fed’s rate cut. We saw explosive price action since the Fed announced their 50-basis-point cut on September 18th. But as you can see in the individual sector charts below, some sectors are running out of steam, although Utilities continues to power higher.
On the other hand, Industrials are giving some back after a parabolic move. Technology cannot pierce its prior highs. Financials, Materials, Discretionary, Real estate, Staples, Communications, and Health Care are all retreating from their highs. That is totally expected and normal after such strong runs, but it is something to take note of as we head into a historically bumpy two weeks:
Graphs are for illustrative and discussion purposes only. Please read important disclosures at the end of this commentary.
Energy is a notable pocket of strength on the heels of the inflamed situation in the Middle-East. The ongoing and developing skirmishes and putting upward pressure on the price of oil lifting the entire sector. That said, it still has a way to go to eclipse prior highs. Here is how the sector rankings shake out:
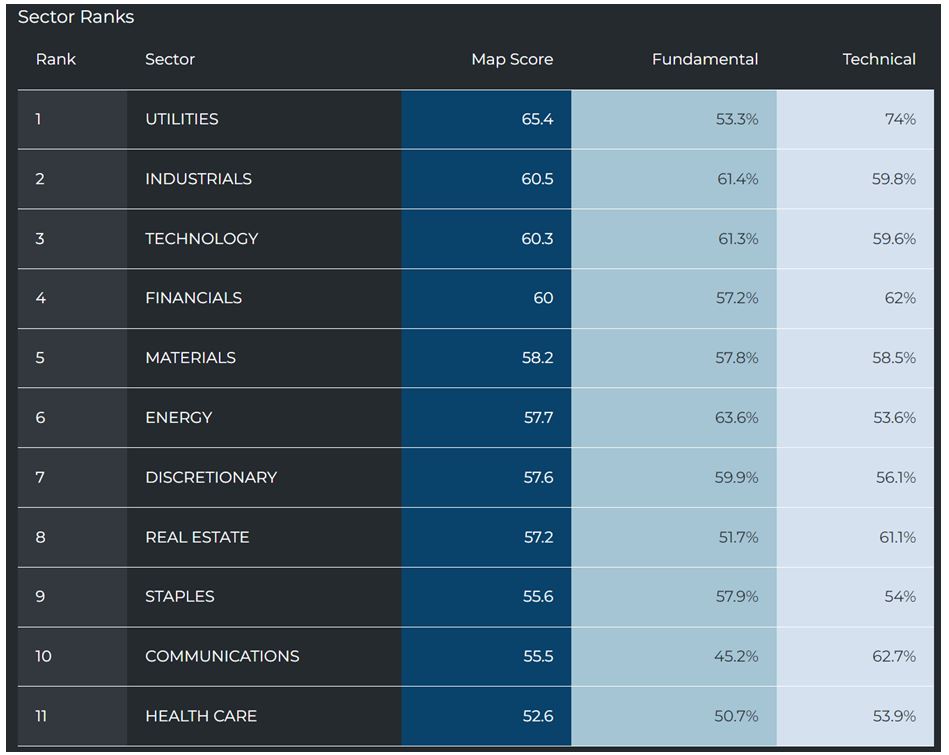
Graphs are for illustrative and discussion purposes only. Please read important disclosures at the end of this commentary.
Will we get an October surprise? History says there’s a good chance. It also says we should expect a lift in the back half of the month. Election years deliver more chances for volatility. The best part is November and December are probabilistically and seasonally the strongest months of the year.
Uncertain times don’t mean you should abandon course. When it comes to investing, remember Lao Tzu: “If you do not change direction, you may end up where you are heading.”
All content above represents the opinion of Jason Bodner of Navellier & Associates, Inc.
Also In This Issue
A Look Ahead by Louis Navellier
Positive Earnings Usually Deliver the Best October Surprises!
Income Mail by Bryan Perry
It’s Past Time for a Federal Government Spending Overhaul
Growth Mail by Gary Alexander
Economies Don’t “Land” (Hard or Soft), They Just Keep Growing
Global Mail by Ivan Martchev
Beware the Market’s “Geopolitical Overhang” in October
Sector Spotlight by Jason Bodner
October is a Month of Mysteries, Surprises and Split Personalities
View Full Archive
Read Past Issues Here

Jason Bodner
MARKETMAIL EDITOR FOR SECTOR SPOTLIGHT
Jason Bodner writes Sector Spotlight in the weekly Marketmail publication and has authored several white papers for the company. He is also Co-Founder of Macro Analytics for Professionals which produces proprietary equity accumulation and distribution research for its clients. Previously, Mr. Bodner served as Director of European Equity Derivatives for Cantor Fitzgerald Europe in London, then moved to the role of Head of Equity Derivatives North America for the same company in New York. He also served as S.V.P. Equity Derivatives for Jefferies, LLC. He received a B.S. in business administration in 1996, with honors, from Skidmore College as a member of the Periclean Honors Society. All content of “Sector Spotlight” represents the opinion of Jason Bodner
Important Disclosures:
Jason Bodner is a co-founder and co-owner of Mapsignals. Mr. Bodner is an independent contractor who is occasionally hired by Navellier & Associates to write an article and or provide opinions for possible use in articles that appear in Navellier & Associates weekly Market Mail. Mr. Bodner is not employed or affiliated with Louis Navellier, Navellier & Associates, Inc., or any other Navellier owned entity. The opinions and statements made here are those of Mr. Bodner and not necessarily those of any other persons or entities. This is not an endorsement, or solicitation or testimonial or investment advice regarding the BMI Index or any statements or recommendations or analysis in the article or the BMI Index or Mapsignals or its products or strategies.
Although information in these reports has been obtained from and is based upon sources that Navellier believes to be reliable, Navellier does not guarantee its accuracy and it may be incomplete or condensed. All opinions and estimates constitute Navellier’s judgment as of the date the report was created and are subject to change without notice. These reports are for informational purposes only and are not a solicitation for the purchase or sale of a security. Any decision to purchase securities mentioned in these reports must take into account existing public information on such securities or any registered prospectus.To the extent permitted by law, neither Navellier & Associates, Inc., nor any of its affiliates, agents, or service providers assumes any liability or responsibility nor owes any duty of care for any consequences of any person acting or refraining to act in reliance on the information contained in this communication or for any decision based on it.
Past performance is no indication of future results. Investment in securities involves significant risk and has the potential for partial or complete loss of funds invested. It should not be assumed that any securities recommendations made by Navellier. in the future will be profitable or equal the performance of securities made in this report. Dividend payments are not guaranteed. The amount of a dividend payment, if any, can vary over time and issuers may reduce dividends paid on securities in the event of a recession or adverse event affecting a specific industry or issuer.
None of the stock information, data, and company information presented herein constitutes a recommendation by Navellier or a solicitation to buy or sell any securities. Any specific securities identified and described do not represent all of the securities purchased, sold, or recommended for advisory clients. The holdings identified do not represent all of the securities purchased, sold, or recommended for advisory clients and the reader should not assume that investments in the securities identified and discussed were or will be profitable.
Information presented is general information that does not take into account your individual circumstances, financial situation, or needs, nor does it present a personalized recommendation to you. Individual stocks presented may not be suitable for every investor. Investment in securities involves significant risk and has the potential for partial or complete loss of funds invested. Investment in fixed income securities has the potential for the investment return and principal value of an investment to fluctuate so that an investor’s holdings, when redeemed, may be worth less than their original cost.
One cannot invest directly in an index. Index is unmanaged and index performance does not reflect deduction of fees, expenses, or taxes. Presentation of Index data does not reflect a belief by Navellier that any stock index constitutes an investment alternative to any Navellier equity strategy or is necessarily comparable to such strategies. Among the most important differences between the Indices and Navellier strategies are that the Navellier equity strategies may (1) incur material management fees, (2) concentrate its investments in relatively few stocks, industries, or sectors, (3) have significantly greater trading activity and related costs, and (4) be significantly more or less volatile than the Indices.
ETF Risk: We may invest in exchange traded funds (“ETFs”) and some of our investment strategies are generally fully invested in ETFs. Like traditional mutual funds, ETFs charge asset-based fees, but they generally do not charge initial sales charges or redemption fees and investors typically pay only customary brokerage fees to buy and sell ETF shares. The fees and costs charged by ETFs held in client accounts will not be deducted from the compensation the client pays Navellier. ETF prices can fluctuate up or down, and a client account could lose money investing in an ETF if the prices of the securities owned by the ETF go down. ETFs are subject to additional risks:
- ETF shares may trade above or below their net asset value;
- An active trading market for an ETF’s shares may not develop or be maintained;
- The value of an ETF may be more volatile than the underlying portfolio of securities the ETF is designed to track;
- The cost of owning shares of the ETF may exceed those a client would incur by directly investing in the underlying securities and;
- Trading of an ETF’s shares may be halted if the listing exchange’s officials deem it appropriate, the shares are delisted from the exchange, or the activation of market-wide “circuit breakers” (which are tied to large decreases in stock prices) halts stock trading generally.
Grader Disclosures: Investment in equity strategies involves substantial risk and has the potential for partial or complete loss of funds invested. The sample portfolio and any accompanying charts are for informational purposes only and are not to be construed as a solicitation to buy or sell any financial instrument and should not be relied upon as the sole factor in an investment making decision. As a matter of normal and important disclosures to you, as a potential investor, please consider the following: The performance presented is not based on any actual securities trading, portfolio, or accounts, and the reported performance of the A, B, C, D, and F portfolios (collectively the “model portfolios”) should be considered mere “paper” or pro forma performance results based on Navellier’s research.
Investors evaluating any of Navellier & Associates, Inc.’s, (or its affiliates’) Investment Products must not use any information presented here, including the performance figures of the model portfolios, in their evaluation of any Navellier Investment Products. Navellier Investment Products include the firm’s mutual funds and managed accounts. The model portfolios, charts, and other information presented do not represent actual funded trades and are not actual funded portfolios. There are material differences between Navellier Investment Products’ portfolios and the model portfolios, research, and performance figures presented here. The model portfolios and the research results (1) may contain stocks or ETFs that are illiquid and difficult to trade; (2) may contain stock or ETF holdings materially different from actual funded Navellier Investment Product portfolios; (3) include the reinvestment of all dividends and other earnings, estimated trading costs, commissions, or management fees; and, (4) may not reflect prices obtained in an actual funded Navellier Investment Product portfolio. For these and other reasons, the reported performances of model portfolios do not reflect the performance results of Navellier’s actually funded and traded Investment Products. In most cases, Navellier’s Investment Products have materially lower performance results than the performances of the model portfolios presented.
This report contains statements that are, or may be considered to be, forward-looking statements. All statements that are not historical facts, including statements about our beliefs or expectations, are “forward-looking statements” within the meaning of The U.S. Private Securities Litigation Reform Act of 1995. These statements may be identified by such forward-looking terminology as “expect,” “estimate,” “plan,” “intend,” “believe,” “anticipate,” “may,” “will,” “should,” “could,” “continue,” “project,” or similar statements or variations of such terms. Our forward-looking statements are based on a series of expectations, assumptions, and projections, are not guarantees of future results or performance, and involve substantial risks and uncertainty as described in Form ADV Part 2A of our filing with the Securities and Exchange Commission (SEC), which is available at www.adviserinfo.sec.gov or by requesting a copy by emailing info@navellier.com. All of our forward-looking statements are as of the date of this report only. We can give no assurance that such expectations or forward-looking statements will prove to be correct. Actual results may differ materially. You are urged to carefully consider all such factors.
FEDERAL TAX ADVICE DISCLAIMER: As required by U.S. Treasury Regulations, you are informed that, to the extent this presentation includes any federal tax advice, the presentation is not written by Navellier to be used, and cannot be used, for the purpose of avoiding federal tax penalties. Navellier does not advise on any income tax requirements or issues. Use of any information presented by Navellier is for general information only and does not represent tax advice either express or implied. You are encouraged to seek professional tax advice for income tax questions and assistance.
IMPORTANT NEWSLETTER DISCLOSURE:The hypothetical performance results for investment newsletters that are authored or edited by Louis Navellier, including Louis Navellier’s Growth Investor, Louis Navellier’s Breakthrough Stocks, Louis Navellier’s Accelerated Profits, and Louis Navellier’s Platinum Club, are not based on any actual securities trading, portfolio, or accounts, and the newsletters’ reported hypothetical performances should be considered mere “paper” or proforma hypothetical performance results and are not actual performance of real world trades. Navellier & Associates, Inc. does not have any relation to or affiliation with the owner of these newsletters. There are material differences between Navellier Investment Products’ portfolios and the InvestorPlace Media, LLC newsletter portfolios authored by Louis Navellier. The InvestorPlace Media, LLC newsletters contain hypothetical performance that do not include transaction costs, advisory fees, or other fees a client might incur if actual investments and trades were being made by an investor. As a result, newsletter performance should not be used to evaluate Navellier Investment services which are separate and different from the newsletters. The owner of the newsletters is InvestorPlace Media, LLC and any questions concerning the newsletters, including any newsletter advertising or hypothetical Newsletter performance claims, (which are calculated solely by Investor Place Media and not Navellier) should be referred to InvestorPlace Media, LLC at (800) 718-8289.
Please note that Navellier & Associates and the Navellier Private Client Group are managed completely independent of the newsletters owned and published by InvestorPlace Media, LLC and written and edited by Louis Navellier, and investment performance of the newsletters should in no way be considered indicative of potential future investment performance for any Navellier & Associates separately managed account portfolio. Potential investors should consult with their financial advisor before investing in any Navellier Investment Product.
Navellier claims compliance with Global Investment Performance Standards (GIPS). To receive a complete list and descriptions of Navellier’s composites and/or a presentation that adheres to the GIPS standards, please contact Navellier or click here. It should not be assumed that any securities recommendations made by Navellier & Associates, Inc. in the future will be profitable or equal the performance of securities made in this report.
FactSet Disclosure: Navellier does not independently calculate the statistical information included in the attached report. The calculation and the information are provided by FactSet, a company not related to Navellier. Although information contained in the report has been obtained from FactSet and is based on sources Navellier believes to be reliable, Navellier does not guarantee its accuracy, and it may be incomplete or condensed. The report and the related FactSet sourced information are provided on an “as is” basis. The user assumes the entire risk of any use made of this information. Investors should consider the report as only a single factor in making their investment decision. The report is for informational purposes only and is not intended as an offer or solicitation for the purchase or sale of a security. FactSet sourced information is the exclusive property of FactSet. Without prior written permission of FactSet, this information may not be reproduced, disseminated or used to create any financial products. All indices are unmanaged and performance of the indices include reinvestment of dividends and interest income, unless otherwise noted, are not illustrative of any particular investment and an investment cannot be made in any index. Past performance is no guarantee of future results.