by Bryan Perry
October 8, 2024
Last week launched a new federal fiscal year, so I have a modest proposal, but first – the jobs report:
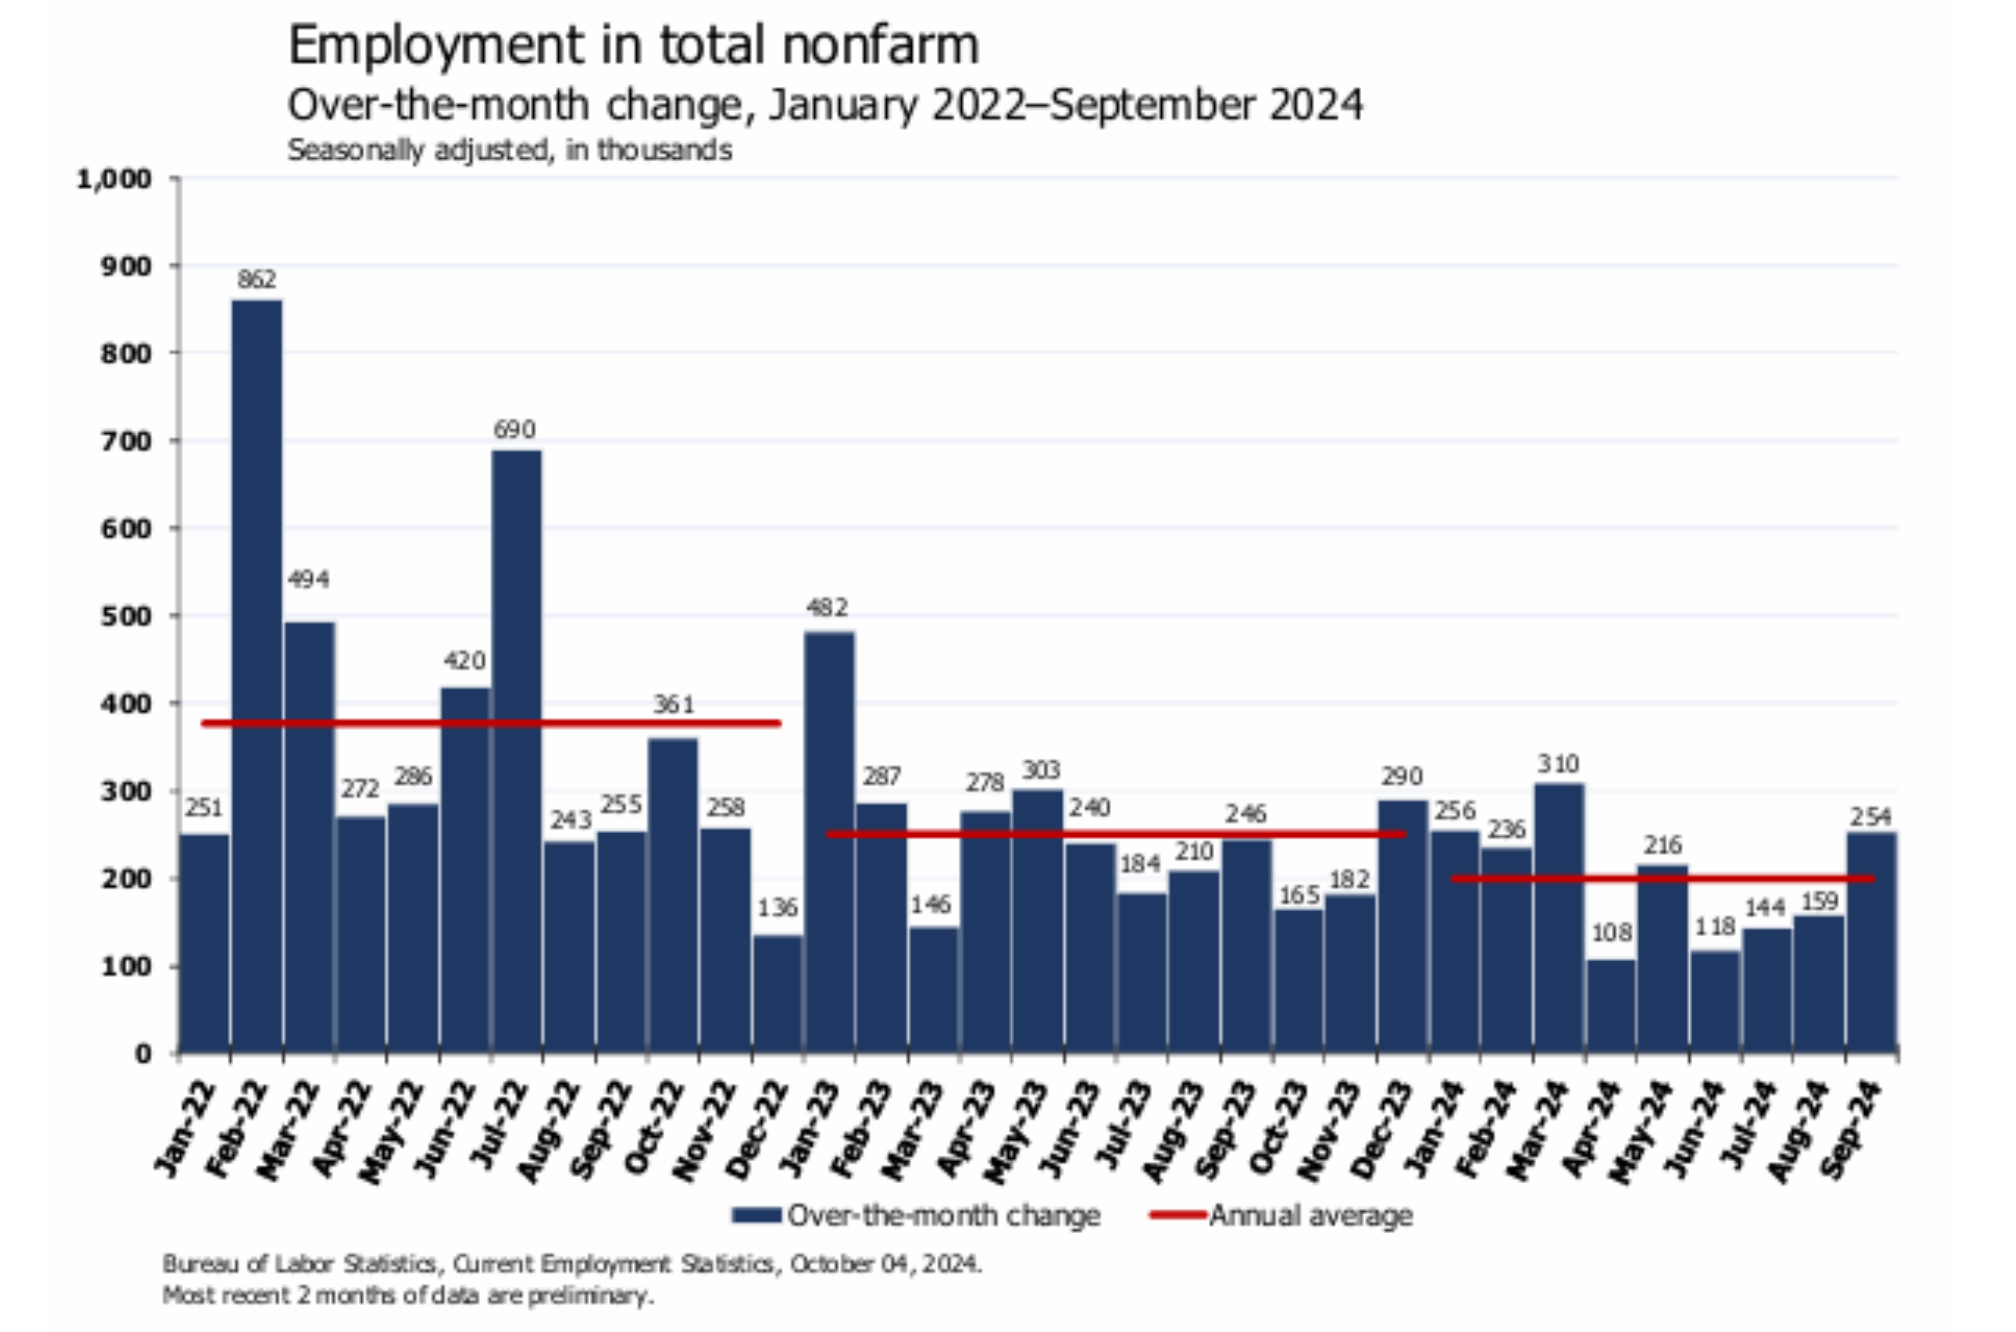
There sure was a lot of market excitement surrounding the Friday release of the employment numbers. The September employment report indicated that employers added 254,000 jobs, significantly more than the forecast of 140,000. The headlines boasted growth in sectors such as food services, health care, government, social assistance, and construction, and the unemployment rate also ticked down to 4.1% from 4.2%. The stock market glommed on to the headline numbers and stocks rallied big time.
Graphs are for illustrative and discussion purposes only. Please read important disclosures at the end of this commentary.
What a change from six weeks ago, when the U.S. Labor department revised down job growth by the most since the Great Recession in 2009, subtracting 818,000 jobs from what they had initially reported from April 2023 through March 2024. (In 2009, the BLS revised employment growth lower by 824,000.) That means the U.S. economy added 2.08 million jobs during this time frame instead of the 2.9 million jobs initially reported. The average monthly gains were closer to 178,000 instead of the robust 246,000.
In the September jobs data, released last Friday, the Labor Department released upward revisions. Non-farm payroll employment for July was revised up by 55,000, from 89,999 to 144,000, and the change for August was revised up by 17,000, from 142,000 to 159,000. As the last jobs report before election day, some skeptics said these numbers may have been manipulated, heavily influenced by political agendas.
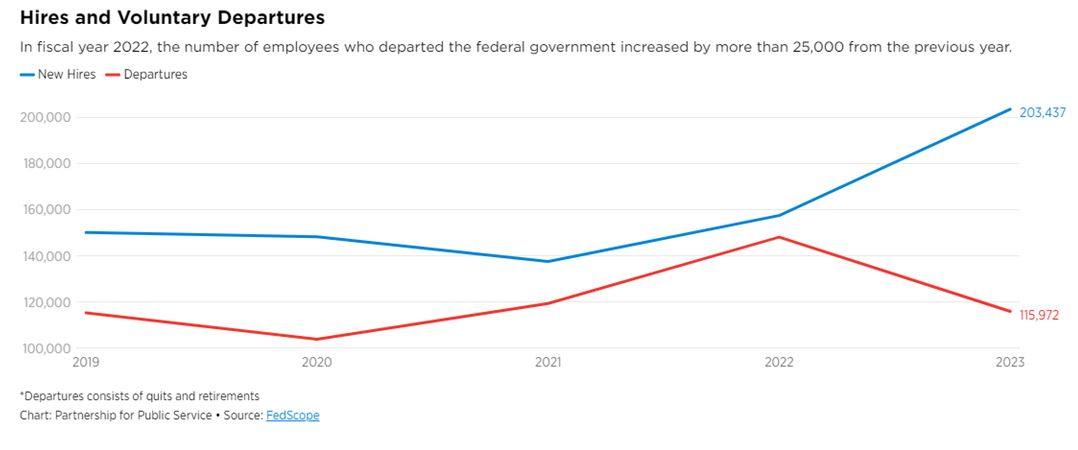
One area that comes under heavy scrutiny is the growth of federal government jobs. Big government costs big money. From 2010 to 2020, the average annual government growth rate was about 1.5%. However, recent years have seen a higher growth rate, with a notable increase of 4% in 2023 alone. Between 2019 and 2023, more than 140,000 employees joined the civil service, an increase of about 7%, according to data that the non-partisan, non-profit Partnership for Public Service compiled and released last week.
The latest increase brings the grand total of full-time federal employees to just over two million. In total, agencies hired more than 200,000 employees in the last fiscal year — an increase of more than 45,000 hires over the previous year, the Partnership said. That does not account for attrition due to retirements and others leaving the government. Adding in all changes, the net gain was about 87,000 employees.
Graphs are for illustrative and discussion purposes only. Please read important disclosures at the end of this commentary.
Models for Cutting Back Future Federal Spending
We entered a new federal fiscal year last week. By one accounting, the deficit for fiscal-year 2024 reached $2.3 trillion. Back when Ronald Reagan was President and budget deficits were rising, he rolled out the “New Federalism” program, aimed to shift more responsibilities from the federal government to state and local governments. The public was receptive to his ideas, the notion being that states and localities know best what the needs are for their citizens. Reagan used Congress and executive orders to implement many of his federalism reforms, but many more of his proposals failed after confronting special interest groups.
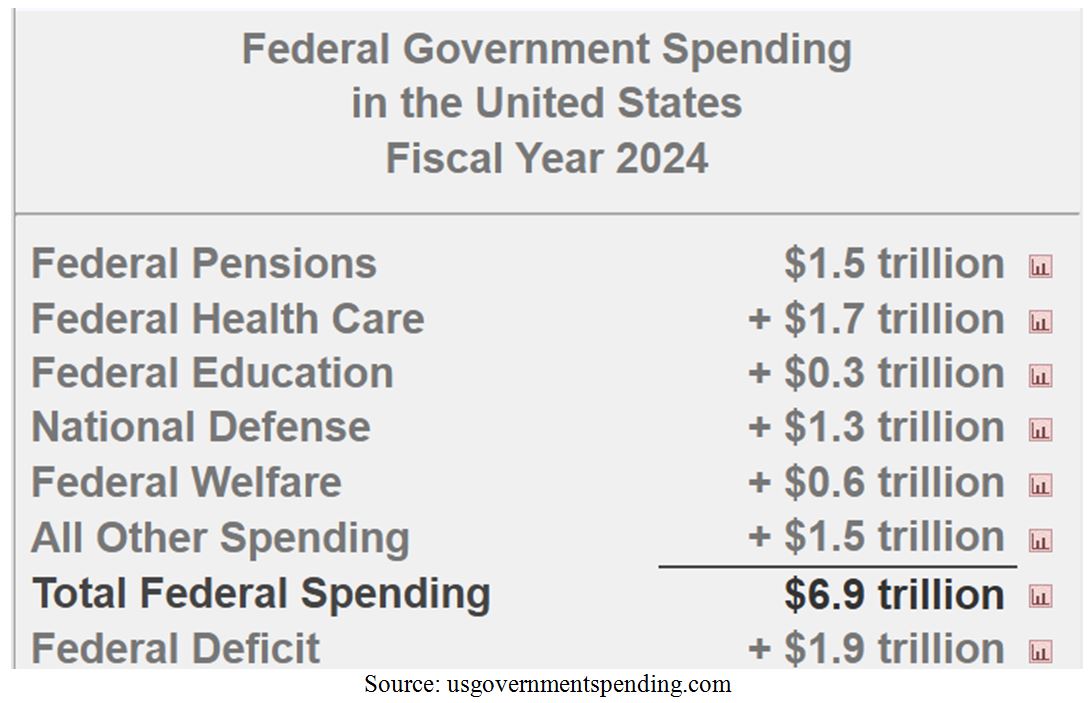
Reagan’s ideas were not new. At the time, his ideas captured and stimulated growing public opposition to big government, big business and big labor, prescribing a solution that appeared consistent with the ideas of the Constitution. Returning responsibility for domestic policies to state governments, he suggested, would give the states greater discretion in crafting and implementing the policies, require less federal monetary assistance, and reduce the need for federal regulations and oversight. Today, non-defense spending by the federal government topped $3.8 trillion for 2023, primarily funding Social Security, Medicare, Medicaid, federal pensions, health care, education, welfare, and other non-defense spending.
In fiscal 2024, total federal spending is budgeted to be $6.941 trillion, an astonishing 13.3% more than the total outlays of $6.135 trillion in fiscal-2023, according to the official budget for fiscal-2025.
Graphs are for illustrative and discussion purposes only. Please read important disclosures at the end of this commentary.
The federal government is facing several ticking time bombs that require the full attention of Congress to avoid major financial calamities down the road. First and worst, medical spending is projected to grow dramatically. The number of persons enrolled in Medicare is expected to increase from 47 million in 2010 to 80 million by 2030. The same demographic trends that affect Social Security also affect Medicare, but rapidly rising medical costs appear to be the fastest growing cause of projected spending increases.
We already have a model for what happens in nationalizing healthcare – the Veterans Administration, a subject of heavy criticism due to inadequate healthcare services, including long wait times and insufficient mental care, excessive spending, contradictory policies, a massive backlog of benefit claims, lack of protection for its staff and issues related to veterans’ access to private healthcare services. Universal healthcare run by the federal government could look like Canada’s long wait time on steroids.
The Congressional Budget Office (CBO) has indicated that, “Future growth in spending per beneficiary for Medicare and Medicaid—the federal government’s major health care programs—will be the most important determinant of long-term trends in federal spending. Changing those programs in ways that reduce the growth of costs—which will be difficult, in part because of the complexity of health policy choices—is ultimately the nation’s central long-term challenge in setting federal fiscal policy.” For 2024, federal healthcare accounts for approximately 6.3% of GDP, and is forecast to soar to 19.7% by 2030.
Social Security spending will increase sharply over the next decades, largely due to the retirement of the Baby Boom generation, born 1946 to 1964. The number of program recipients is expected to increase from 44 million in 2010 to 73 million in 2030. Program spending is projected to rise from 4.8% of GDP in 2010 to 5.9% of GDP by 2030. The solution to fixing a Social Security system, whose Trust Fund goes bankrupt around 2035, is likely to be an increase in payroll taxes and a reduction in the cost-of-living increases. This sacred cow is considered untouchable, but like health care, nibbling around the edges has the look and feel of rearranging the deck chairs on the Titanic if hard policy decisions aren’t made.
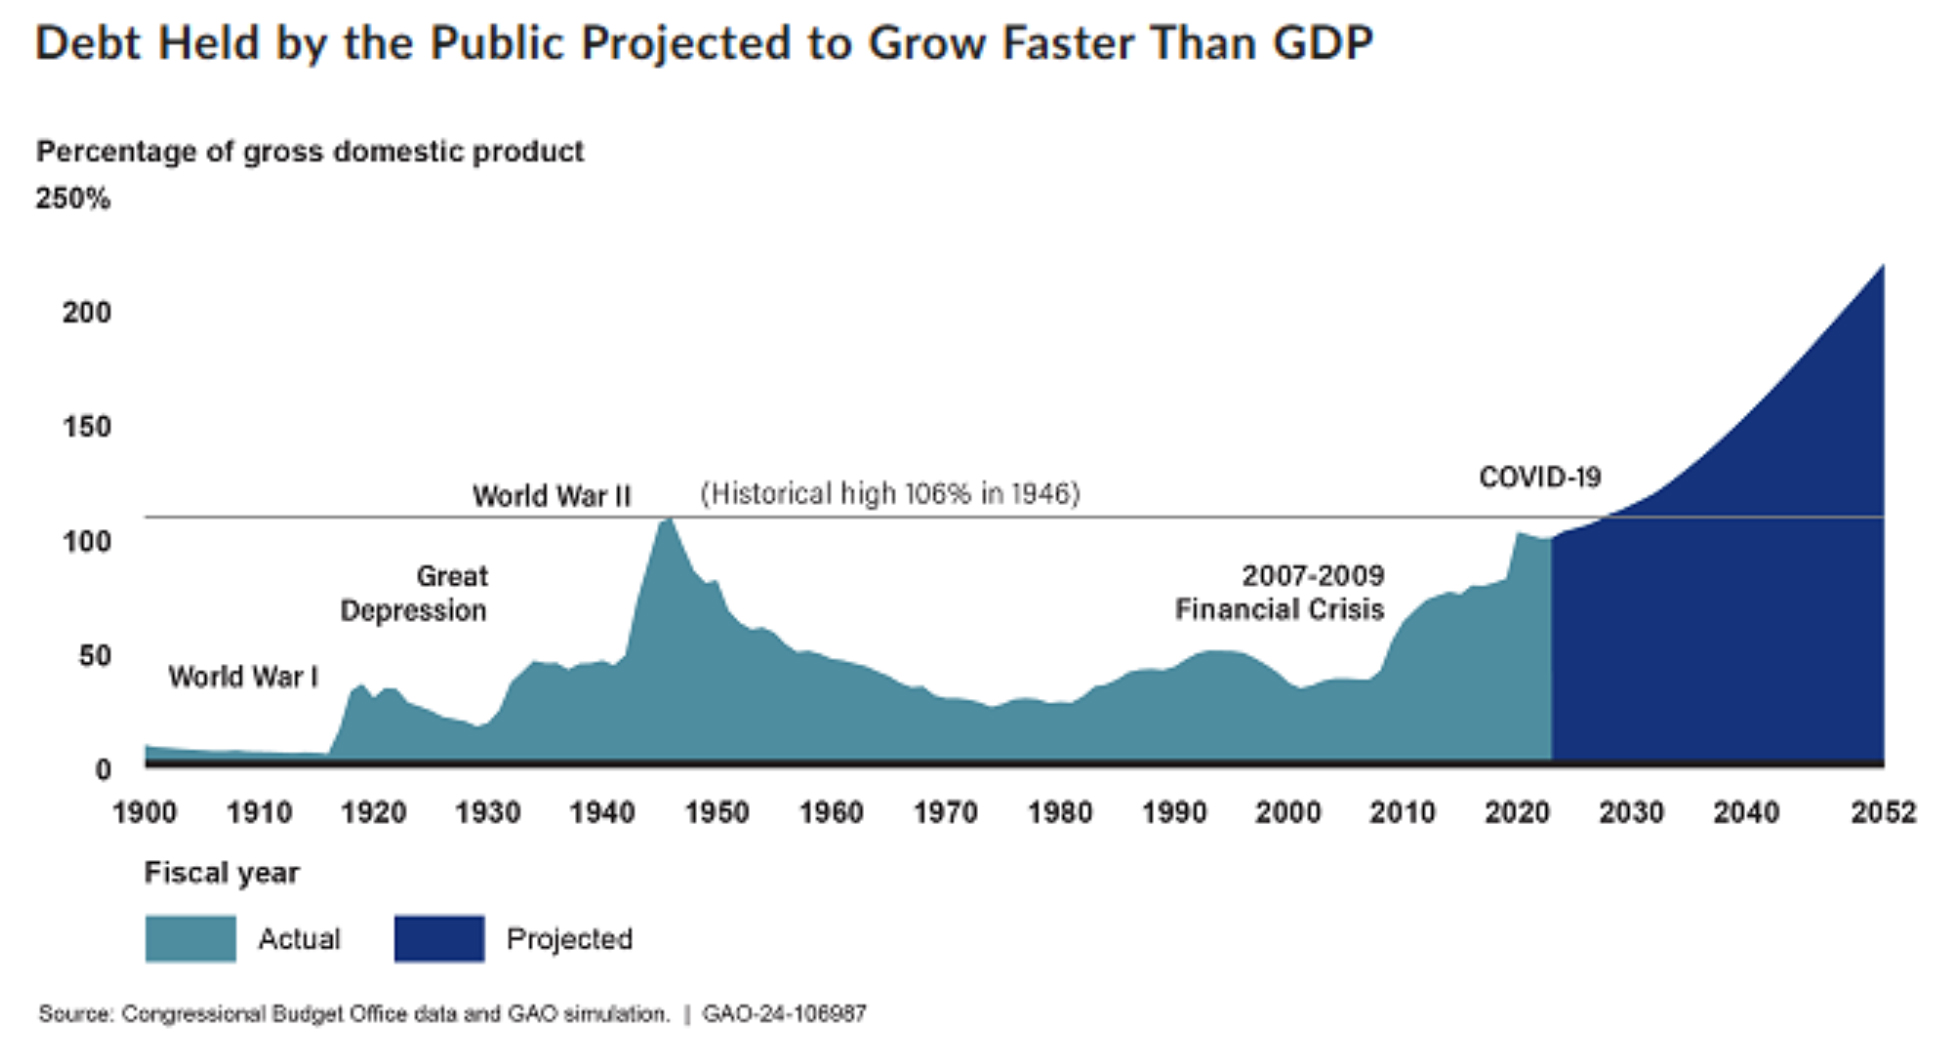
In 2024, interest on the federal debt is projected to be $892 billion, almost a third higher than what it was in 2023, accounting for 3.1% of GDP. For 2024, the federal debt to GDP ratio is 121%, meaning total public debt is over 20% bigger than the U.S. economy. By 2050, the CBO states that this number will rise to at least 166% of GDP, and debt is growing much faster than debt, so predictions remain blurry at best.
Graphs are for illustrative and discussion purposes only. Please read important disclosures at the end of this commentary.
So, what should we do about the bloated federal government and its layers of incompetence? It is past time to end the bureaucratic labyrinth of endless paperwork, red tape, one-hour hold times, waste and fraud. Like him or not, a government efficiency czar like Elon Musk has proposed top-down reforms in the form of audit and accountability to identify areas of waste and inefficiency that hinder operations and economic growth, slashing unnecessary spending, and applying principles from the private sector, such as streamlining processes by implementing the most advanced technologies available. The goal would be to make the government more responsive, cost-effective, transparent and leaner and doing more good for citizens with far fewer federal workers by instituting extreme productivity gains through implementation of technology and innovation – the stuff at which America’s private sector is the best at in the world.
We balanced the budget and – amazingly enough – generated budget surpluses from 1998 to 2001, and we could do so again, to secure our future, our kids’ future, our grandkids’ future, and generations thereafter. On this issue, during this election season, I believe there is widespread consensus from the vast majority of Americans that something must be done to overhaul the federal government – and be done soon.
All content above represents the opinion of Bryan Perry of Navellier & Associates, Inc.
Also In This Issue
A Look Ahead by Louis Navellier
Positive Earnings Usually Deliver the Best October Surprises!
Income Mail by Bryan Perry
It’s Past Time for a Federal Government Spending Overhaul
Growth Mail by Gary Alexander
Economies Don’t “Land” (Hard or Soft), They Just Keep Growing
Global Mail by Ivan Martchev
Beware the Market’s “Geopolitical Overhang” in October
Sector Spotlight by Jason Bodner
October is a Month of Mysteries, Surprises and Split Personalities
View Full Archive
Read Past Issues Here

Bryan Perry
SENIOR DIRECTOR
Bryan Perry is a Senior Director with Navellier Private Client Group, advising and facilitating high net worth investors in the pursuit of their financial goals.
Bryan’s financial services career spanning the past three decades includes over 20-years of wealth management experience with Wall Street firms that include Bear Stearns, Lehman Brothers and Paine Webber, working with both retail and institutional clients. Bryan earned a B.A. in Political Science from Virginia Polytechnic Institute & State University and currently holds a Series 65 license. All content of “Income Mail” represents the opinion of Bryan Perry
Important Disclosures:
Although information in these reports has been obtained from and is based upon sources that Navellier believes to be reliable, Navellier does not guarantee its accuracy and it may be incomplete or condensed. All opinions and estimates constitute Navellier’s judgment as of the date the report was created and are subject to change without notice. These reports are for informational purposes only and are not a solicitation for the purchase or sale of a security. Any decision to purchase securities mentioned in these reports must take into account existing public information on such securities or any registered prospectus.To the extent permitted by law, neither Navellier & Associates, Inc., nor any of its affiliates, agents, or service providers assumes any liability or responsibility nor owes any duty of care for any consequences of any person acting or refraining to act in reliance on the information contained in this communication or for any decision based on it.
Past performance is no indication of future results. Investment in securities involves significant risk and has the potential for partial or complete loss of funds invested. It should not be assumed that any securities recommendations made by Navellier. in the future will be profitable or equal the performance of securities made in this report. Dividend payments are not guaranteed. The amount of a dividend payment, if any, can vary over time and issuers may reduce dividends paid on securities in the event of a recession or adverse event affecting a specific industry or issuer.
None of the stock information, data, and company information presented herein constitutes a recommendation by Navellier or a solicitation to buy or sell any securities. Any specific securities identified and described do not represent all of the securities purchased, sold, or recommended for advisory clients. The holdings identified do not represent all of the securities purchased, sold, or recommended for advisory clients and the reader should not assume that investments in the securities identified and discussed were or will be profitable.
Information presented is general information that does not take into account your individual circumstances, financial situation, or needs, nor does it present a personalized recommendation to you. Individual stocks presented may not be suitable for every investor. Investment in securities involves significant risk and has the potential for partial or complete loss of funds invested. Investment in fixed income securities has the potential for the investment return and principal value of an investment to fluctuate so that an investor’s holdings, when redeemed, may be worth less than their original cost.
One cannot invest directly in an index. Index is unmanaged and index performance does not reflect deduction of fees, expenses, or taxes. Presentation of Index data does not reflect a belief by Navellier that any stock index constitutes an investment alternative to any Navellier equity strategy or is necessarily comparable to such strategies. Among the most important differences between the Indices and Navellier strategies are that the Navellier equity strategies may (1) incur material management fees, (2) concentrate its investments in relatively few stocks, industries, or sectors, (3) have significantly greater trading activity and related costs, and (4) be significantly more or less volatile than the Indices.
ETF Risk: We may invest in exchange traded funds (“ETFs”) and some of our investment strategies are generally fully invested in ETFs. Like traditional mutual funds, ETFs charge asset-based fees, but they generally do not charge initial sales charges or redemption fees and investors typically pay only customary brokerage fees to buy and sell ETF shares. The fees and costs charged by ETFs held in client accounts will not be deducted from the compensation the client pays Navellier. ETF prices can fluctuate up or down, and a client account could lose money investing in an ETF if the prices of the securities owned by the ETF go down. ETFs are subject to additional risks:
- ETF shares may trade above or below their net asset value;
- An active trading market for an ETF’s shares may not develop or be maintained;
- The value of an ETF may be more volatile than the underlying portfolio of securities the ETF is designed to track;
- The cost of owning shares of the ETF may exceed those a client would incur by directly investing in the underlying securities; and
- Trading of an ETF’s shares may be halted if the listing exchange’s officials deem it appropriate, the shares are delisted from the exchange, or the activation of market-wide “circuit breakers” (which are tied to large decreases in stock prices) halts stock trading generally.
Grader Disclosures: Investment in equity strategies involves substantial risk and has the potential for partial or complete loss of funds invested. The sample portfolio and any accompanying charts are for informational purposes only and are not to be construed as a solicitation to buy or sell any financial instrument and should not be relied upon as the sole factor in an investment making decision. As a matter of normal and important disclosures to you, as a potential investor, please consider the following: The performance presented is not based on any actual securities trading, portfolio, or accounts, and the reported performance of the A, B, C, D, and F portfolios (collectively the “model portfolios”) should be considered mere “paper” or pro forma performance results based on Navellier’s research.
Investors evaluating any of Navellier & Associates, Inc.’s, (or its affiliates’) Investment Products must not use any information presented here, including the performance figures of the model portfolios, in their evaluation of any Navellier Investment Products. Navellier Investment Products include the firm’s mutual funds and managed accounts. The model portfolios, charts, and other information presented do not represent actual funded trades and are not actual funded portfolios. There are material differences between Navellier Investment Products’ portfolios and the model portfolios, research, and performance figures presented here. The model portfolios and the research results (1) may contain stocks or ETFs that are illiquid and difficult to trade; (2) may contain stock or ETF holdings materially different from actual funded Navellier Investment Product portfolios; (3) include the reinvestment of all dividends and other earnings, estimated trading costs, commissions, or management fees; and, (4) may not reflect prices obtained in an actual funded Navellier Investment Product portfolio. For these and other reasons, the reported performances of model portfolios do not reflect the performance results of Navellier’s actually funded and traded Investment Products. In most cases, Navellier’s Investment Products have materially lower performance results than the performances of the model portfolios presented.
This report contains statements that are, or may be considered to be, forward-looking statements. All statements that are not historical facts, including statements about our beliefs or expectations, are “forward-looking statements” within the meaning of The U.S. Private Securities Litigation Reform Act of 1995. These statements may be identified by such forward-looking terminology as “expect,” “estimate,” “plan,” “intend,” “believe,” “anticipate,” “may,” “will,” “should,” “could,” “continue,” “project,” or similar statements or variations of such terms. Our forward-looking statements are based on a series of expectations, assumptions, and projections, are not guarantees of future results or performance, and involve substantial risks and uncertainty as described in Form ADV Part 2A of our filing with the Securities and Exchange Commission (SEC), which is available at www.adviserinfo.sec.gov or by requesting a copy by emailing info@navellier.com. All of our forward-looking statements are as of the date of this report only. We can give no assurance that such expectations or forward-looking statements will prove to be correct. Actual results may differ materially. You are urged to carefully consider all such factors.
FEDERAL TAX ADVICE DISCLAIMER: As required by U.S. Treasury Regulations, you are informed that, to the extent this presentation includes any federal tax advice, the presentation is not written by Navellier to be used, and cannot be used, for the purpose of avoiding federal tax penalties. Navellier does not advise on any income tax requirements or issues. Use of any information presented by Navellier is for general information only and does not represent tax advice either express or implied. You are encouraged to seek professional tax advice for income tax questions and assistance.
IMPORTANT NEWSLETTER DISCLOSURE:The hypothetical performance results for investment newsletters that are authored or edited by Louis Navellier, including Louis Navellier’s Growth Investor, Louis Navellier’s Breakthrough Stocks, Louis Navellier’s Accelerated Profits, and Louis Navellier’s Platinum Club, are not based on any actual securities trading, portfolio, or accounts, and the newsletters’ reported hypothetical performances should be considered mere “paper” or proforma hypothetical performance results and are not actual performance of real world trades. Navellier & Associates, Inc. does not have any relation to or affiliation with the owner of these newsletters. There are material differences between Navellier Investment Products’ portfolios and the InvestorPlace Media, LLC newsletter portfolios authored by Louis Navellier. The InvestorPlace Media, LLC newsletters contain hypothetical performance that do not include transaction costs, advisory fees, or other fees a client might incur if actual investments and trades were being made by an investor. As a result, newsletter performance should not be used to evaluate Navellier Investment services which are separate and different from the newsletters. The owner of the newsletters is InvestorPlace Media, LLC and any questions concerning the newsletters, including any newsletter advertising or hypothetical Newsletter performance claims, (which are calculated solely by Investor Place Media and not Navellier) should be referred to InvestorPlace Media, LLC at (800) 718-8289.
Please note that Navellier & Associates and the Navellier Private Client Group are managed completely independent of the newsletters owned and published by InvestorPlace Media, LLC and written and edited by Louis Navellier, and investment performance of the newsletters should in no way be considered indicative of potential future investment performance for any Navellier & Associates separately managed account portfolio. Potential investors should consult with their financial advisor before investing in any Navellier Investment Product.
Navellier claims compliance with Global Investment Performance Standards (GIPS). To receive a complete list and descriptions of Navellier’s composites and/or a presentation that adheres to the GIPS standards, please contact Navellier or click here. It should not be assumed that any securities recommendations made by Navellier & Associates, Inc. in the future will be profitable or equal the performance of securities made in this report.
FactSet Disclosure: Navellier does not independently calculate the statistical information included in the attached report. The calculation and the information are provided by FactSet, a company not related to Navellier. Although information contained in the report has been obtained from FactSet and is based on sources Navellier believes to be reliable, Navellier does not guarantee its accuracy, and it may be incomplete or condensed. The report and the related FactSet sourced information are provided on an “as is” basis. The user assumes the entire risk of any use made of this information. Investors should consider the report as only a single factor in making their investment decision. The report is for informational purposes only and is not intended as an offer or solicitation for the purchase or sale of a security. FactSet sourced information is the exclusive property of FactSet. Without prior written permission of FactSet, this information may not be reproduced, disseminated or used to create any financial products. All indices are unmanaged and performance of the indices include reinvestment of dividends and interest income, unless otherwise noted, are not illustrative of any particular investment and an investment cannot be made in any index. Past performance is no guarantee of future results.