by Jason Bodner
October 7, 2025
Strange but true: on Venus, a single day – the time it takes Venus to rotate on its own axis – lasts longer than a Venusian year, a trip around the sun. Venus spins so slowly, and in the opposite direction of most planets, that its sunrise seems almost stubborn. Time stretches out there. That quirk is a handy reminder for investors: The calendar can say one thing while reality happens in a very different rhythmic pattern.
Like planets, markets tend to march to their own beat, starting with the Big Money Index (BMI).
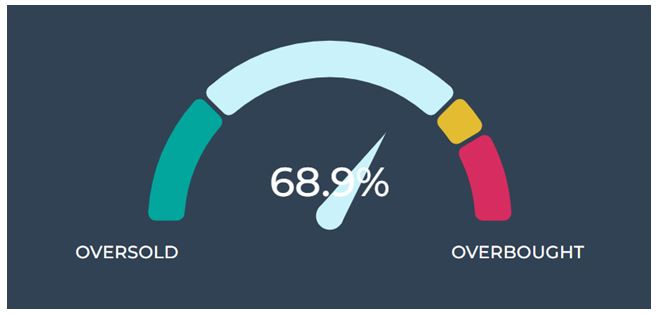
On the previous Friday (September 26), the Big Money Index sat at 72.2%. Last Friday, it was 68.9%.
Graphs are for illustrative and discussion purposes only. Please read important disclosures at the end of this commentary.
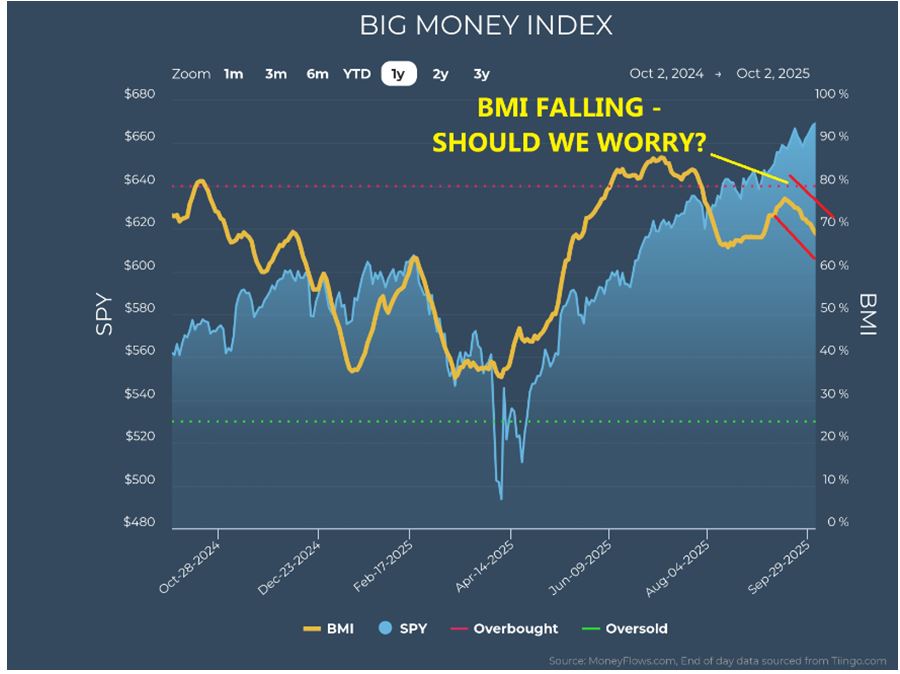
If this headline (“BMI Falling”) concerns you, don’t be too concerned. The BMI is a flow gauge, not a fear gauge. It is easing because buying has slowed, not because sellers have headed for the exits.
Graphs are for illustrative and discussion purposes only. Please read important disclosures at the end of this commentary.
Given how uncharacteristically strong August and September were, a moderation in buying appetite is exactly what you would expect now. Seasonality still matters, even when the tape seems sizzling-hot.
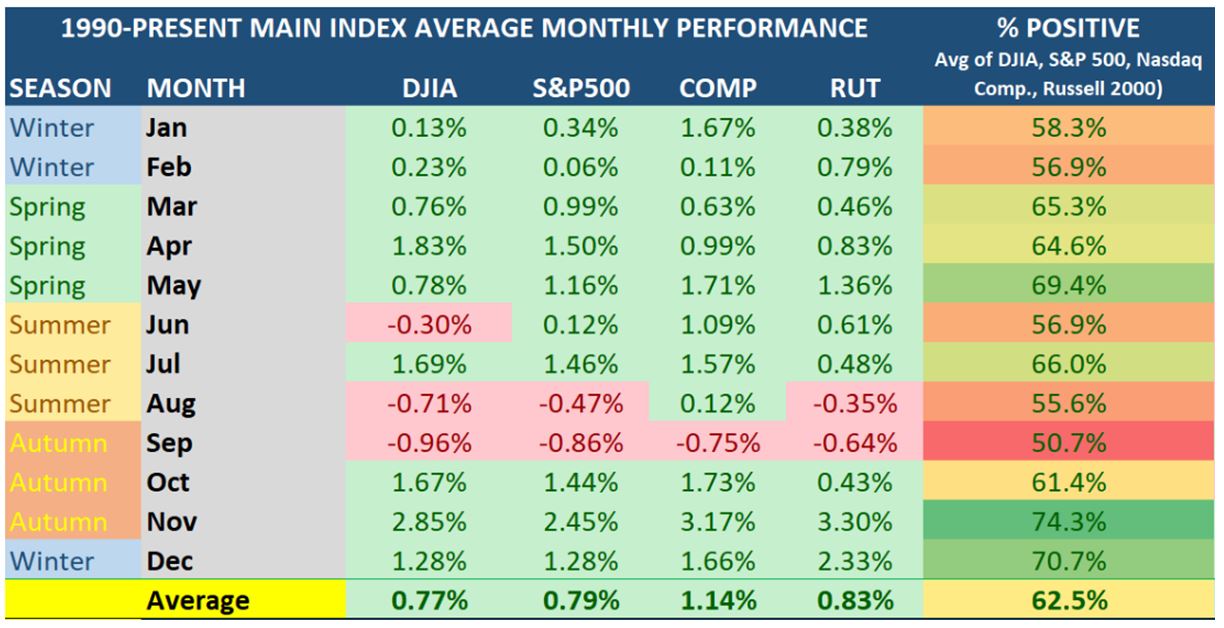
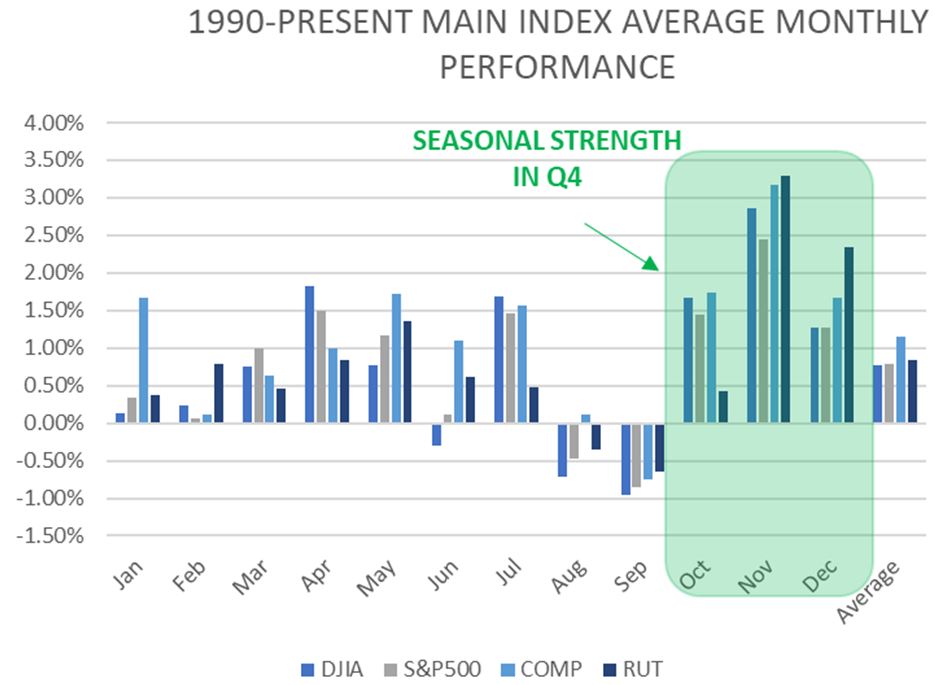
Since 1990, September has been the market’s softest month. Only 16 of the last 35 Septembers (45.7%) have finished positive for the Dow and 48.6% (17 of 35) for the S&P 500. November sits at the other end of the spectrum with 26 of 35 Novembers (74.3%) being positive. This year, August and September bucked the pattern, which is bullish. Now, we ask the obvious question: What about October?
Graphs are for illustrative and discussion purposes only. Please read important disclosures at the end of this commentary.
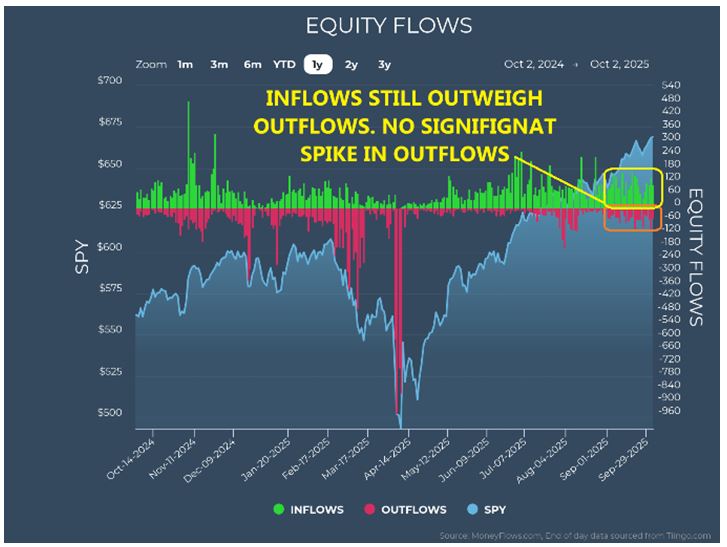
October is historically constructive, green roughly 61% of the time. The catch is the front-half can be whippy. The back-half, into year-end and beyond, tends to carry the baton. This lines-up with what my model is seeing: The underlying weather looks fine. We’re witnessing slower inflows, not stress; digestion, not distress, and November and December are the strongest months historically speaking.
Graphs are for illustrative and discussion purposes only. Please read important disclosures at the end of this commentary.
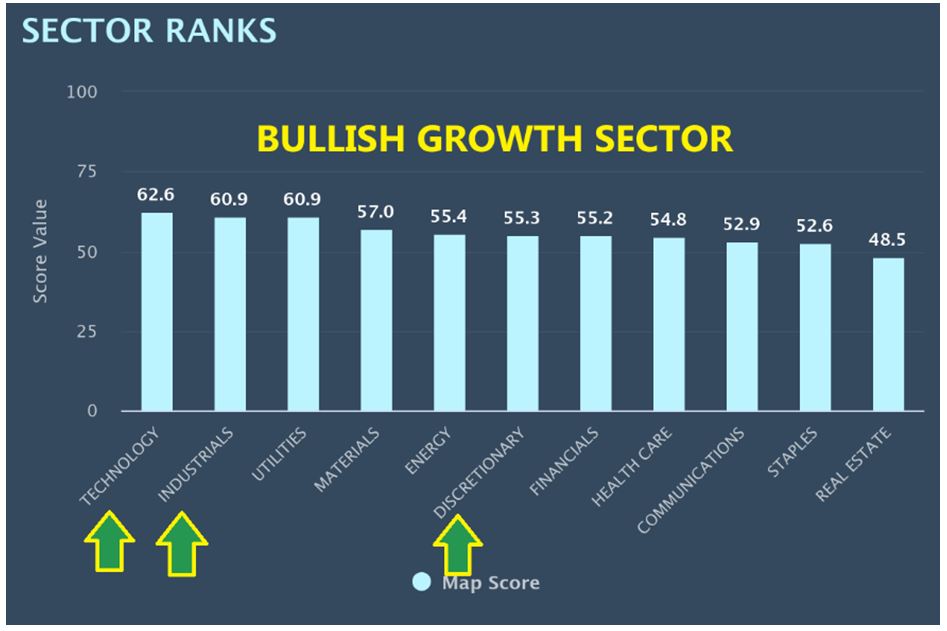
Sector leadership backs that up. Technology and Industrials remain my top two-ranked groups last week, with Discretionary sitting mid-pack at sixth. That trio is exactly what you would want to see in a bull-market environment. Technology underpins nearly everything we build or buy, and Industrials tie into real-world capacity and infrastructure. Discretionary tells you the consumer still has gas in the tank.
Graphs are for illustrative and discussion purposes only. Please read important disclosures at the end of this commentary.
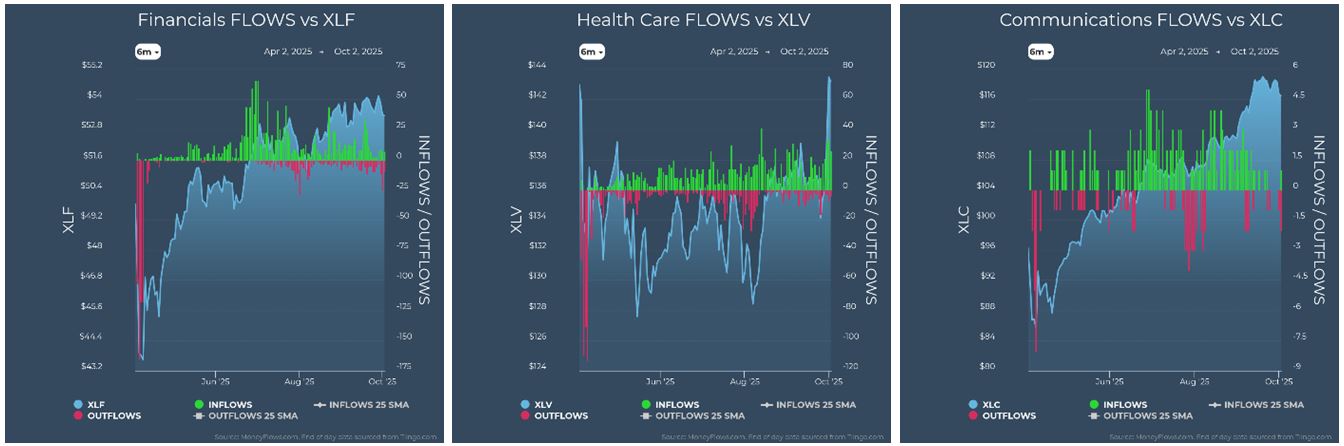
Ten of eleven sector ETFs are trading at or near highs. The lone laggard now is Staples (charted, below).
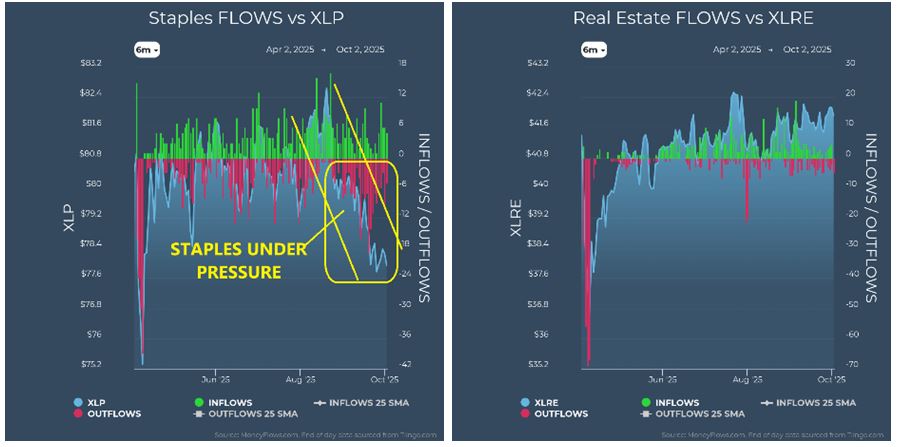
Graphs are for illustrative and discussion purposes only. Please read important disclosures at the end of this commentary.
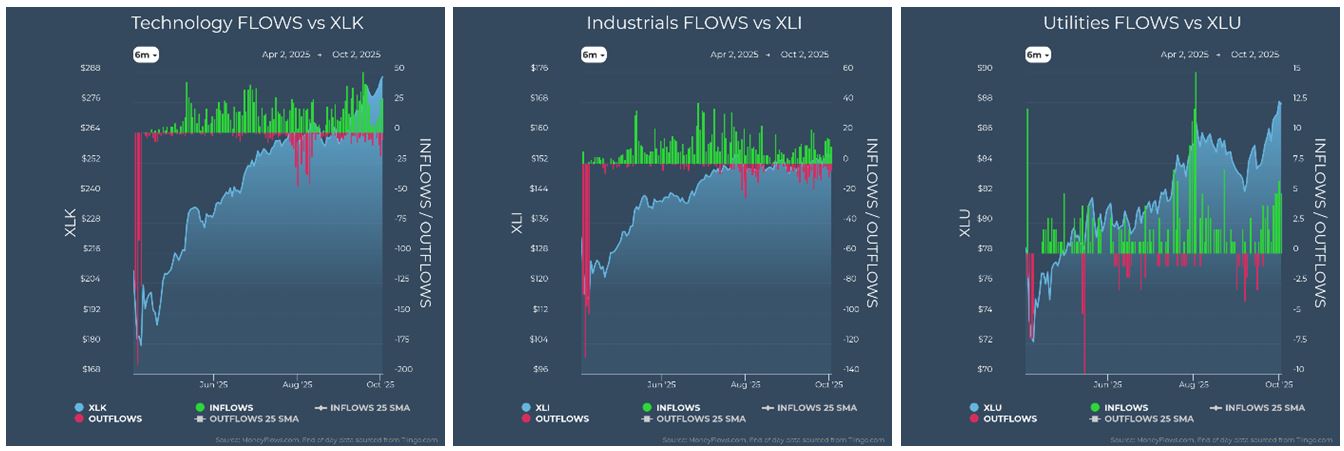
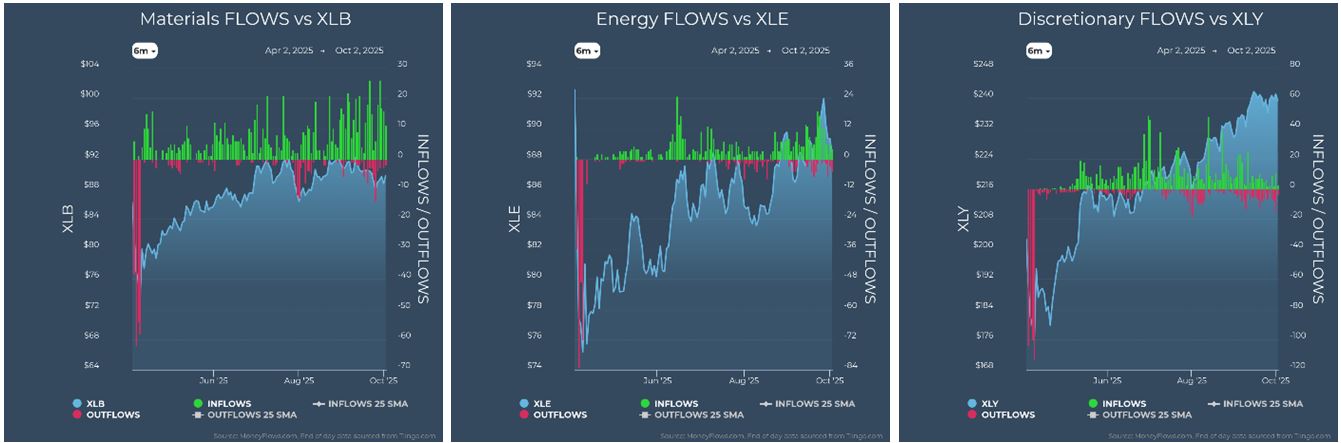
Cash flows since September 1st tilt in the same direction. Technology, Healthcare, Industrials, Materials, and Financials captured 82.4% of September inflows. That is not defensive fear, that is a growth strike zone.
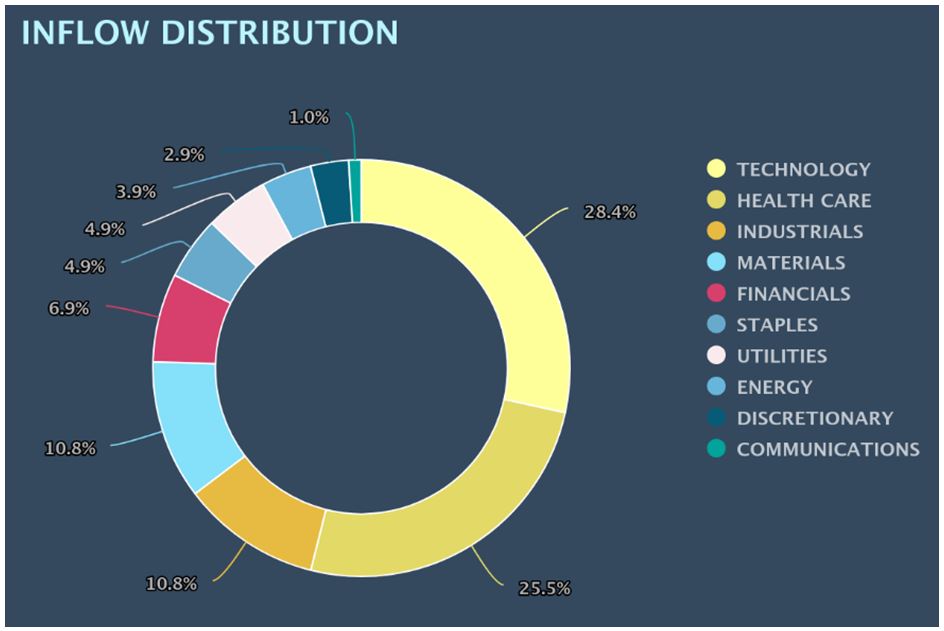
Graphs are for illustrative and discussion purposes only. Please read important disclosures at the end of this commentary.
Equally important, 82.5% of equity inflows went into small and mid-caps. When capital skews down the market-cap ladder, managers are telling you they’re positioned for expansion, not caution.
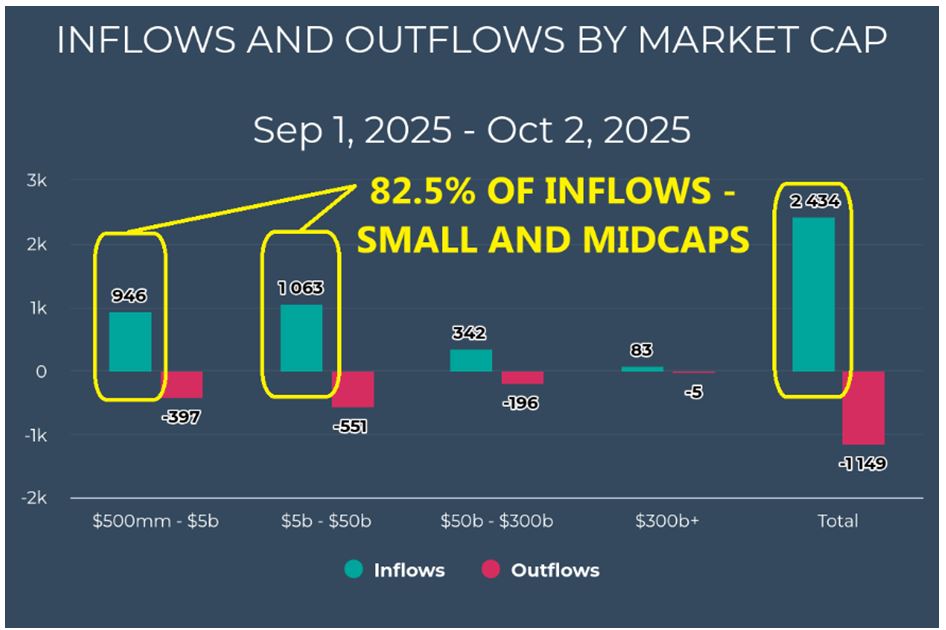
Graphs are for illustrative and discussion purposes only. Please read important disclosures at the end of this commentary.
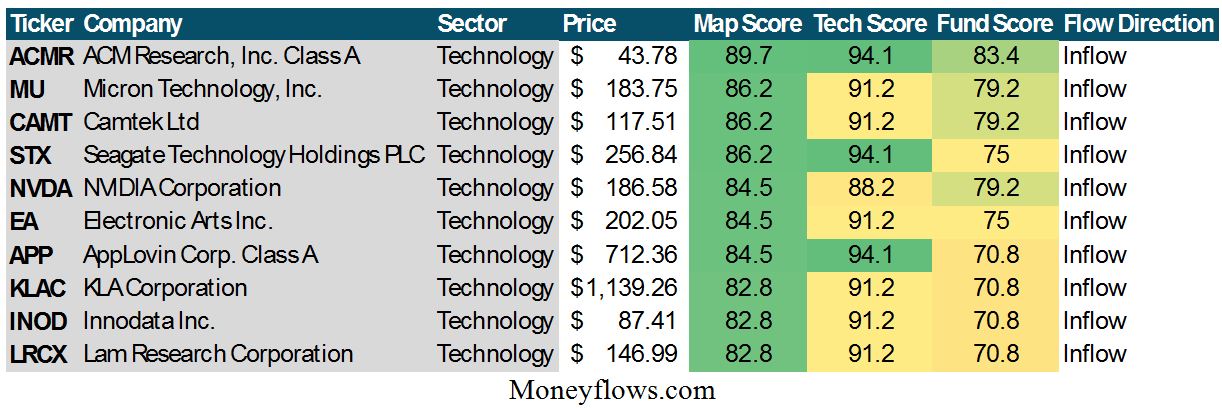
Zoom in further and the following stock list is a who’s who of technology-beneficiaries. Over the past two-weeks the highest-ranked names seeing fresh inflows, charted below, include ACM Research, Micron Technology, Camtek, Seagate, NVIDIA, Electronic Arts, AppLovin, KLA, Innodata, and Lam Research.
Those are not safety-trades. Those are growth-engines with torque.
(Disclosure: I hold NVDA, LAC, LRCX, APP, and CAMT in managed accounts or model portfolios).
Now layer on the macro-tailwinds. Rates are falling, and more cuts are likely. Corporate taxes are lower, which fattens margins on the other side of the income statement. Meanwhile the United States has effectively planted a flag in strategic technology and AI. You can see it in public support for domestic chip capacity, in partnerships like Intel’s work with AMD, and in the massive investment pipelines announced by NVIDIA and others. Policy, cost of capital, and capital spending are all pointing in the same direction.
(Disclosure: I hold Intel (INTC), AMD and NVDA in managed accounts or model portfolios).
So yes, the BMI slipped just over three-points, from 72.2% to 68.9%. But here’s the important nuance in the numbers: This change reflects a cooling in Big Money buy signals rather than a swell in sell signals. That difference is huge. When buying slows after a powerful run, you often get orderly back-and-fill, not structural damage. Pullbacks that come from digestion often precede future breakouts on new fuel.
Seasonality supports the same conclusion. If the first two-weeks of October deliver some chop, that is part of the script, not the surprise. The back-half of October often improves, and the future brightens further going into November and December, historically the market’s sweetest spot. Add the current sector posture (growth on top, safety at the bottom) and the message remains: The trend is intact.
What would change my mind? A decisive rotation into Staples and Utilities while Technology, Discretionary, and Industrials bleed, or a meaningful rise in equity outflows accompanied by expanding new lows, or a Fed policy shock that tightens liquidity. However, that is not the tape we see now. Instead, we have 10 of the 11 S&P sectors at or near-highs, inflows concentrated in the engines of growth, and small and mid-caps receiving the majority share. That is the opposite of fear.
Here is how I’m translating theory into action. First, respect the chop. If we get early October weakness, I plan to buy in tranches rather than all at once. Second, favor the leaders: semiconductors, AI infrastructure, quality-software, and industrial enablers tied to capacity, power, and automation. Third, keep some powder dry for opportunistic adds if the BMI drops suddenly, on higher volume. In markets, patience is a position.
A quick note on psychology, because the crowd’s madness matters just as much as the math. Pullbacks never feel like an opportunity in the moment. They feel like despair setting in. But emotion is a lagging indicator. The flows point to risk-on. The sectors point to growth. The seasonals point to strength after a little choppy-weather. If you can hold that frame of mind, you can act when others hesitate.
Which brings me back to Venus, where a day that out-lasts a year sounds wrong, until you accept that each planet has its own time-table. The market’s timetable has seemed a bit odd, too: strong when history said weak, pausing now when the headlines want drama. But I’m fine with that.
Here’s a Stoic reminder that fits: “No great thing is created suddenly” – (Epictetus). In other words, even on a planet where a day out-runs a year, progress is still happening: slow, steady, and right on time.
Navellier & Associates Inc.; own NVIDIA, AppLovin, KLA, Innodata, and Lam Research in managed accounts. We do not own ACM Research, Micron Technology, Camtek, Seagate, or Electronic Arts, in managed accounts. Jason Bodner personally owns Camtek, NVIDIA, AppLovin, KLA, and Lam Research, but does not personally own ACM Research, Micron Technology, Seagate, Electronic Arts, or Innodata.
All content above represents the opinion of Jason Bodner of Navellier & Associates, Inc.
Also In This Issue
A Look Ahead by Louis Navellier
Shutdowns Are Generally Bullish for the Stock Market
Income Mail by Bryan Perry
Finding Juicy Yields from Option Income Funds
Growth Mail by Gary Alexander
Low “Gross Output” Implies that GDP May Over-Estimate Growth
Global Mail by Ivan Martchev
We’re Seeing “Toppy” Action Without Conviction
Sector Spotlight by Jason Bodner
When a Day Seems Like a Year…
View Full Archive
Read Past Issues Here

Jason Bodner
MARKETMAIL EDITOR FOR SECTOR SPOTLIGHT
Jason Bodner writes Sector Spotlight in the weekly Marketmail publication and has authored several white papers for the company. He is also Co-Founder of Macro Analytics for Professionals which produces proprietary equity accumulation and distribution research for its clients. Previously, Mr. Bodner served as Director of European Equity Derivatives for Cantor Fitzgerald Europe in London, then moved to the role of Head of Equity Derivatives North America for the same company in New York. He also served as S.V.P. Equity Derivatives for Jefferies, LLC. He received a B.S. in business administration in 1996, with honors, from Skidmore College as a member of the Periclean Honors Society. All content of “Sector Spotlight” represents the opinion of Jason Bodner
Important Disclosures:
Jason Bodner is a co-founder and co-owner of Mapsignals. Mr. Bodner is an independent contractor who is occasionally hired by Navellier & Associates to write an article and or provide opinions for possible use in articles that appear in Navellier & Associates weekly Market Mail. Mr. Bodner is not employed or affiliated with Louis Navellier, Navellier & Associates, Inc., or any other Navellier owned entity. The opinions and statements made here are those of Mr. Bodner and not necessarily those of any other persons or entities. This is not an endorsement, or solicitation or testimonial or investment advice regarding the BMI Index or any statements or recommendations or analysis in the article or the BMI Index or Mapsignals or its products or strategies.
Although information in these reports has been obtained from and is based upon sources that Navellier believes to be reliable, Navellier does not guarantee its accuracy and it may be incomplete or condensed. All opinions and estimates constitute Navellier’s judgment as of the date the report was created and are subject to change without notice. These reports are for informational purposes only and are not a solicitation for the purchase or sale of a security. Any decision to purchase securities mentioned in these reports must take into account existing public information on such securities or any registered prospectus.To the extent permitted by law, neither Navellier & Associates, Inc., nor any of its affiliates, agents, or service providers assumes any liability or responsibility nor owes any duty of care for any consequences of any person acting or refraining to act in reliance on the information contained in this communication or for any decision based on it.
Past performance is no indication of future results. Investment in securities involves significant risk and has the potential for partial or complete loss of funds invested. It should not be assumed that any securities recommendations made by Navellier. in the future will be profitable or equal the performance of securities made in this report. Dividend payments are not guaranteed. The amount of a dividend payment, if any, can vary over time and issuers may reduce dividends paid on securities in the event of a recession or adverse event affecting a specific industry or issuer.
None of the stock information, data, and company information presented herein constitutes a recommendation by Navellier or a solicitation to buy or sell any securities. Any specific securities identified and described do not represent all of the securities purchased, sold, or recommended for advisory clients. The holdings identified do not represent all of the securities purchased, sold, or recommended for advisory clients and the reader should not assume that investments in the securities identified and discussed were or will be profitable.
Information presented is general information that does not take into account your individual circumstances, financial situation, or needs, nor does it present a personalized recommendation to you. Individual stocks presented may not be suitable for every investor. Investment in securities involves significant risk and has the potential for partial or complete loss of funds invested. Investment in fixed income securities has the potential for the investment return and principal value of an investment to fluctuate so that an investor’s holdings, when redeemed, may be worth less than their original cost.
One cannot invest directly in an index. Index is unmanaged and index performance does not reflect deduction of fees, expenses, or taxes. Presentation of Index data does not reflect a belief by Navellier that any stock index constitutes an investment alternative to any Navellier equity strategy or is necessarily comparable to such strategies. Among the most important differences between the Indices and Navellier strategies are that the Navellier equity strategies may (1) incur material management fees, (2) concentrate its investments in relatively few stocks, industries, or sectors, (3) have significantly greater trading activity and related costs, and (4) be significantly more or less volatile than the Indices.
ETF Risk: We may invest in exchange traded funds (“ETFs”) and some of our investment strategies are generally fully invested in ETFs. Like traditional mutual funds, ETFs charge asset-based fees, but they generally do not charge initial sales charges or redemption fees and investors typically pay only customary brokerage fees to buy and sell ETF shares. The fees and costs charged by ETFs held in client accounts will not be deducted from the compensation the client pays Navellier. ETF prices can fluctuate up or down, and a client account could lose money investing in an ETF if the prices of the securities owned by the ETF go down. ETFs are subject to additional risks:
- ETF shares may trade above or below their net asset value;
- An active trading market for an ETF’s shares may not develop or be maintained;
- The value of an ETF may be more volatile than the underlying portfolio of securities the ETF is designed to track;
- The cost of owning shares of the ETF may exceed those a client would incur by directly investing in the underlying securities and;
- Trading of an ETF’s shares may be halted if the listing exchange’s officials deem it appropriate, the shares are delisted from the exchange, or the activation of market-wide “circuit breakers” (which are tied to large decreases in stock prices) halts stock trading generally.
Grader Disclosures: Investment in equity strategies involves substantial risk and has the potential for partial or complete loss of funds invested. The sample portfolio and any accompanying charts are for informational purposes only and are not to be construed as a solicitation to buy or sell any financial instrument and should not be relied upon as the sole factor in an investment making decision. As a matter of normal and important disclosures to you, as a potential investor, please consider the following: The performance presented is not based on any actual securities trading, portfolio, or accounts, and the reported performance of the A, B, C, D, and F portfolios (collectively the “model portfolios”) should be considered mere “paper” or pro forma performance results based on Navellier’s research.
Investors evaluating any of Navellier & Associates, Inc.’s, (or its affiliates’) Investment Products must not use any information presented here, including the performance figures of the model portfolios, in their evaluation of any Navellier Investment Products. Navellier Investment Products include the firm’s mutual funds and managed accounts. The model portfolios, charts, and other information presented do not represent actual funded trades and are not actual funded portfolios. There are material differences between Navellier Investment Products’ portfolios and the model portfolios, research, and performance figures presented here. The model portfolios and the research results (1) may contain stocks or ETFs that are illiquid and difficult to trade; (2) may contain stock or ETF holdings materially different from actual funded Navellier Investment Product portfolios; (3) include the reinvestment of all dividends and other earnings, estimated trading costs, commissions, or management fees; and, (4) may not reflect prices obtained in an actual funded Navellier Investment Product portfolio. For these and other reasons, the reported performances of model portfolios do not reflect the performance results of Navellier’s actually funded and traded Investment Products. In most cases, Navellier’s Investment Products have materially lower performance results than the performances of the model portfolios presented.
This report contains statements that are, or may be considered to be, forward-looking statements. All statements that are not historical facts, including statements about our beliefs or expectations, are “forward-looking statements” within the meaning of The U.S. Private Securities Litigation Reform Act of 1995. These statements may be identified by such forward-looking terminology as “expect,” “estimate,” “plan,” “intend,” “believe,” “anticipate,” “may,” “will,” “should,” “could,” “continue,” “project,” or similar statements or variations of such terms. Our forward-looking statements are based on a series of expectations, assumptions, and projections, are not guarantees of future results or performance, and involve substantial risks and uncertainty as described in Form ADV Part 2A of our filing with the Securities and Exchange Commission (SEC), which is available at www.adviserinfo.sec.gov or by requesting a copy by emailing info@navellier.com. All of our forward-looking statements are as of the date of this report only. We can give no assurance that such expectations or forward-looking statements will prove to be correct. Actual results may differ materially. You are urged to carefully consider all such factors.
FEDERAL TAX ADVICE DISCLAIMER: As required by U.S. Treasury Regulations, you are informed that, to the extent this presentation includes any federal tax advice, the presentation is not written by Navellier to be used, and cannot be used, for the purpose of avoiding federal tax penalties. Navellier does not advise on any income tax requirements or issues. Use of any information presented by Navellier is for general information only and does not represent tax advice either express or implied. You are encouraged to seek professional tax advice for income tax questions and assistance.
IMPORTANT NEWSLETTER DISCLOSURE:The hypothetical performance results for investment newsletters that are authored or edited by Louis Navellier, including Louis Navellier’s Growth Investor, Louis Navellier’s Breakthrough Stocks, Louis Navellier’s Accelerated Profits, and Louis Navellier’s Platinum Club, are not based on any actual securities trading, portfolio, or accounts, and the newsletters’ reported hypothetical performances should be considered mere “paper” or proforma hypothetical performance results and are not actual performance of real world trades. Navellier & Associates, Inc. does not have any relation to or affiliation with the owner of these newsletters. There are material differences between Navellier Investment Products’ portfolios and the InvestorPlace Media, LLC newsletter portfolios authored by Louis Navellier. The InvestorPlace Media, LLC newsletters contain hypothetical performance that do not include transaction costs, advisory fees, or other fees a client might incur if actual investments and trades were being made by an investor. As a result, newsletter performance should not be used to evaluate Navellier Investment services which are separate and different from the newsletters. The owner of the newsletters is InvestorPlace Media, LLC and any questions concerning the newsletters, including any newsletter advertising or hypothetical Newsletter performance claims, (which are calculated solely by Investor Place Media and not Navellier) should be referred to InvestorPlace Media, LLC at (800) 718-8289.
Please note that Navellier & Associates and the Navellier Private Client Group are managed completely independent of the newsletters owned and published by InvestorPlace Media, LLC and written and edited by Louis Navellier, and investment performance of the newsletters should in no way be considered indicative of potential future investment performance for any Navellier & Associates separately managed account portfolio. Potential investors should consult with their financial advisor before investing in any Navellier Investment Product.
Navellier claims compliance with Global Investment Performance Standards (GIPS). To receive a complete list and descriptions of Navellier’s composites and/or a presentation that adheres to the GIPS standards, please contact Navellier or click here. It should not be assumed that any securities recommendations made by Navellier & Associates, Inc. in the future will be profitable or equal the performance of securities made in this report.
FactSet Disclosure: Navellier does not independently calculate the statistical information included in the attached report. The calculation and the information are provided by FactSet, a company not related to Navellier. Although information contained in the report has been obtained from FactSet and is based on sources Navellier believes to be reliable, Navellier does not guarantee its accuracy, and it may be incomplete or condensed. The report and the related FactSet sourced information are provided on an “as is” basis. The user assumes the entire risk of any use made of this information. Investors should consider the report as only a single factor in making their investment decision. The report is for informational purposes only and is not intended as an offer or solicitation for the purchase or sale of a security. FactSet sourced information is the exclusive property of FactSet. Without prior written permission of FactSet, this information may not be reproduced, disseminated or used to create any financial products. All indices are unmanaged and performance of the indices include reinvestment of dividends and interest income, unless otherwise noted, are not illustrative of any particular investment and an investment cannot be made in any index. Past performance is no guarantee of future results.