by Bryan Perry
October 22, 2024
Heading into the November 5th election, there are a number of risks investors are carefully monitoring that could quickly alter the bullish mood of stock investors during a robust earnings season. (Analysts are projecting a 4.6% year-over-year increase in earnings, marking the fifth consecutive quarter of growth).
During this earnings season, the S&P sectors projected to be big winners are information technology, health care and communication services, while energy is expected to report the largest decline compared to a year ago. The best news is that upbeat earnings aren’t just a byproduct of cost savings or stock buybacks. The S&P is projected to deliver 4.8% year-over-year revenue growth for Q3, with 10 of the 11 market sectors showing positive sales growth, as the economy is enjoying broad sector participation.
That said, the market faces downward revisions and sector specific challenges for the current quarter, painting a more complex outlook for investors. What keeps coming up, within the analyst community, is market valuation and the lofty premium the S&P currently sports. The forward 12-month P/E ratio for the S&P 500 is 21.6, exceeding both the 5-year average (19.5) and the 10-year average (18.0), indicating that the market might be pricing-in rising future earnings expectations. However, that’s hard to dismiss, considering that the top-weighted S&P components are the high-growth mega-cap technology companies.
Among the outliers in everyone’s peripheral vision, is the potential for a widening regional war in the Middle East, a naval blockade of Taiwan exports by China and a sweep of the Senate, House, and the White House by the Democratic Party, which would set in motion passage of higher taxes: income taxes, corporate taxes, capital gains and dividend taxes, estate taxes, excise taxes, property taxes and sales taxes.
These higher taxes would be sold to voters as necessary to pay for exploding federal deficits to finance Social Security, Medicare, Medicaid, unemployment insurance, assistance to low-income individuals and soaring interest on the federal debt, since “tax and spend” represents a core pillar of party policy. To be fair, the blue party’s tax focus is aimed at corporations, the super-wealthy and stock market investors as a source of funds, but it is safe to say that a Democratic Party sweep would likely alter investor sentiment.
The Impact of a Baseline Tax Increase Platform
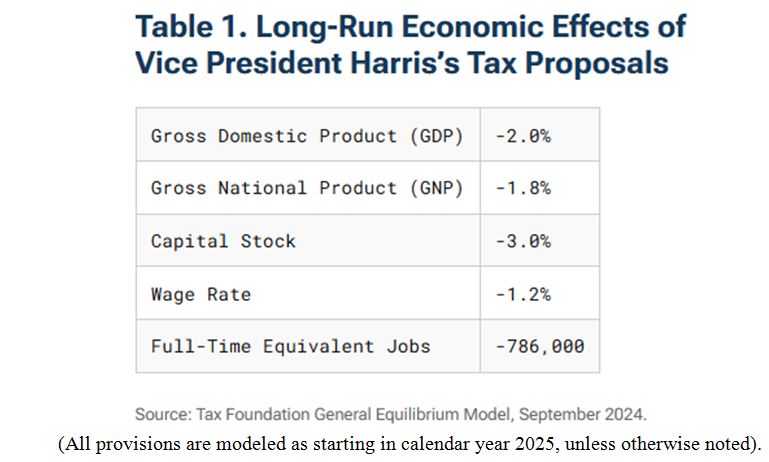
The effect of raising the corporate tax rate to 28% from 21% would likely include slower growth and lower wage increases, according to the Tax Foundation’s latest update, released October 16, 2024:
“We estimate the proposed tax changes would reduce long-run GDP by 2.0 percent, the capital stock by 3.0 percent, wages by 1.2 percent, and employment by about 786,000 full-time equivalent jobs. We find the tax policies would raise top tax rates on corporate and individual income to among the highest in the developed world, slowing economic growth and reducing competitiveness.”
Graphs are for illustrative and discussion purposes only. Please read important disclosures at the end of this commentary.
These estimates of lost GDP, wages, jobs, and capital could be worse. They do not include Kamala Harris’s “novel and highly uncertain, yet large, tax increases on high earners and multinational corporations, namely a new minimum tax on unrealized capital gains” nor the “global-minimum tax model.”
Major business provisions modeled in the above study:
- Increase the corporate income tax-rate from 21 percent to 28 percent
- Increase the corporate alternative minimum tax introduced in the Inflation-Reduction Act from 15 percent to 21 percent
- Quadruple the stock buyback tax in the Inflation Reduction Act from 1 percent to 4 percent
- Make permanent the excess business loss limitation for pass-through businesses
- Further limit the deductibility of employee compensation under Section 162(m)
- Increase the global intangible low-taxed income (GILTI) tax rate from 10.5 percent to 21 percent
- Repeal the reduced tax rate on foreign-derived intangible income (FDII)
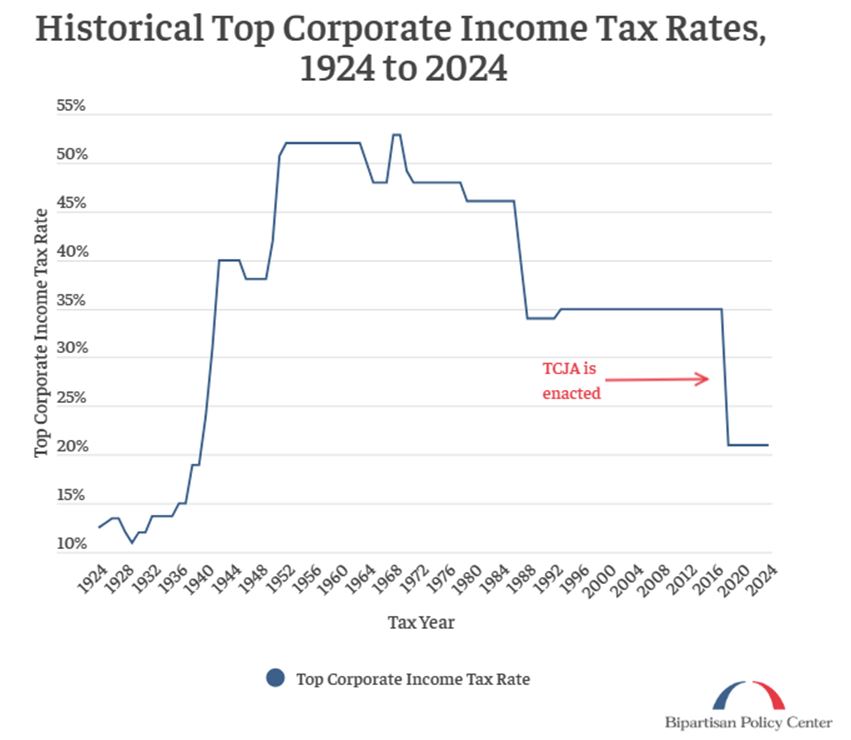
The implications of hiking the corporate tax rate from 21% to 28% complicates U.S. competitiveness. The signing of the Tax Cuts and Jobs Act (TCJA) by then-President Donald Trump on December 22, 2017, lowered corporate tax rate from 35% to 21%, providing one of the most significant revisions in the U.S. tax system in decades. It targeted the offshoring of American businesses by removing the incentive for corporations to redomicile to jurisdictions outside the U.S.
Graphs are for illustrative and discussion purposes only. Please read important disclosures at the end of this commentary.
The Tax Cuts and Jobs Act is set to expire December 31, 2025, and if not extended, many of the tax changes will revert to their pre-2017 levels. “It’s going to be the Super Bowl of tax law changes in less than 18 months,” said Mark Steber, chief tax information officer at tax preparer Jackson Hewitt. Changes will affect people differently, but Steber said everyone’s “tax rates will be higher. That’s inarguable.”
Graphs are for illustrative and discussion purposes only. Please read important disclosures at the end of this commentary.
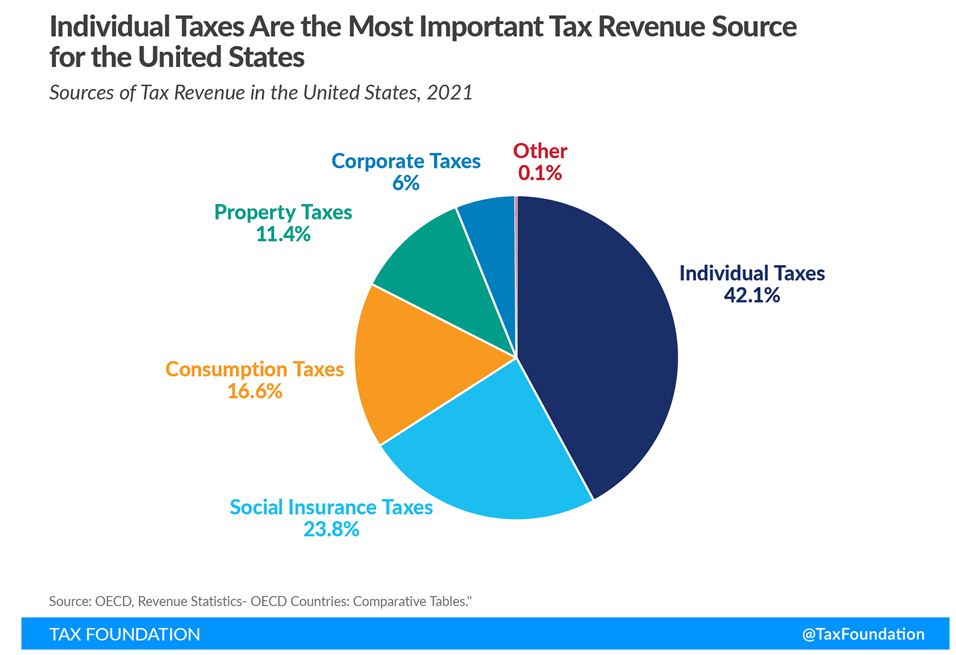
On the surface (chart, above), the percentage of tax revenues from corporations in the U.S. is stated to be low, around 6% of all federal tax revenue, which seems small by comparison when individual income taxes (federal, state, and local) were the primary source of tax revenue in 2021, at 42.1% of tax revenue.
The 6% figure is low because more than half of business income in the U.S. is reported on individual tax returns. Relative to other OECD countries, the U.S. approach to taxing business income boosts the share of tax revenue from individual income taxes in the U.S. and reduces the share of corporate tax revenue.
The American Enterprise Institute (AEI) explains the difference of how corporations calculate their taxes:
“In the U.S., there are generally two forms of businesses, each facing a different tax regime. Traditional C corporations pay corporate income tax at the entity level and their payments show up in the corporate tax revenue statistics. In contrast, ‘pass-through’ businesses—S corporations, partnerships, and sole proprietorships—do not face the corporate income tax. Instead, their profits are immediately passed to their owners as business income each year and, typically, taxed as ordinary income. These owners’ tax remittances show up as individual income tax collections, not corporate income tax collections.”
The thought that an increase in the corporate tax rate only impacts large corporations can be misleading. While the corporate tax rate itself doesn’t directly affect pass-through entities, owners of these businesses may be impacted if the business has retained earnings. The higher corporate tax rate could also reduce the amount of profits available for distribution. This may help explain why the U.S. has smaller corporate tax collections relative to GDP than some other countries. In the words of economist Art Laffer, “Taxes have consequences,” which, by extension, means that “Elections can have major tax consequences.”
All content above represents the opinion of Bryan Perry of Navellier & Associates, Inc.
Also In This Issue
A Look Ahead by Louis Navellier
Future Electricity Demands Require a Massive Energy Infrastructure
Income Mail by Bryan Perry
This Election Cycle Holds Major Taxable Consequences
Growth Mail by Gary Alexander
If We Make It Through “Black October,” The Market Should Stabilize
Global Mail by Ivan Martchev
It’s Groundhog Day (Again) in the Stock Market
Sector Spotlight by Jason Bodner
Is This Overbought Market Overdue for a Correction?
View Full Archive
Read Past Issues Here

Bryan Perry
SENIOR DIRECTOR
Bryan Perry is a Senior Director with Navellier Private Client Group, advising and facilitating high net worth investors in the pursuit of their financial goals.
Bryan’s financial services career spanning the past three decades includes over 20-years of wealth management experience with Wall Street firms that include Bear Stearns, Lehman Brothers and Paine Webber, working with both retail and institutional clients. Bryan earned a B.A. in Political Science from Virginia Polytechnic Institute & State University and currently holds a Series 65 license. All content of “Income Mail” represents the opinion of Bryan Perry
Important Disclosures:
Although information in these reports has been obtained from and is based upon sources that Navellier believes to be reliable, Navellier does not guarantee its accuracy and it may be incomplete or condensed. All opinions and estimates constitute Navellier’s judgment as of the date the report was created and are subject to change without notice. These reports are for informational purposes only and are not a solicitation for the purchase or sale of a security. Any decision to purchase securities mentioned in these reports must take into account existing public information on such securities or any registered prospectus.To the extent permitted by law, neither Navellier & Associates, Inc., nor any of its affiliates, agents, or service providers assumes any liability or responsibility nor owes any duty of care for any consequences of any person acting or refraining to act in reliance on the information contained in this communication or for any decision based on it.
Past performance is no indication of future results. Investment in securities involves significant risk and has the potential for partial or complete loss of funds invested. It should not be assumed that any securities recommendations made by Navellier. in the future will be profitable or equal the performance of securities made in this report. Dividend payments are not guaranteed. The amount of a dividend payment, if any, can vary over time and issuers may reduce dividends paid on securities in the event of a recession or adverse event affecting a specific industry or issuer.
None of the stock information, data, and company information presented herein constitutes a recommendation by Navellier or a solicitation to buy or sell any securities. Any specific securities identified and described do not represent all of the securities purchased, sold, or recommended for advisory clients. The holdings identified do not represent all of the securities purchased, sold, or recommended for advisory clients and the reader should not assume that investments in the securities identified and discussed were or will be profitable.
Information presented is general information that does not take into account your individual circumstances, financial situation, or needs, nor does it present a personalized recommendation to you. Individual stocks presented may not be suitable for every investor. Investment in securities involves significant risk and has the potential for partial or complete loss of funds invested. Investment in fixed income securities has the potential for the investment return and principal value of an investment to fluctuate so that an investor’s holdings, when redeemed, may be worth less than their original cost.
One cannot invest directly in an index. Index is unmanaged and index performance does not reflect deduction of fees, expenses, or taxes. Presentation of Index data does not reflect a belief by Navellier that any stock index constitutes an investment alternative to any Navellier equity strategy or is necessarily comparable to such strategies. Among the most important differences between the Indices and Navellier strategies are that the Navellier equity strategies may (1) incur material management fees, (2) concentrate its investments in relatively few stocks, industries, or sectors, (3) have significantly greater trading activity and related costs, and (4) be significantly more or less volatile than the Indices.
ETF Risk: We may invest in exchange traded funds (“ETFs”) and some of our investment strategies are generally fully invested in ETFs. Like traditional mutual funds, ETFs charge asset-based fees, but they generally do not charge initial sales charges or redemption fees and investors typically pay only customary brokerage fees to buy and sell ETF shares. The fees and costs charged by ETFs held in client accounts will not be deducted from the compensation the client pays Navellier. ETF prices can fluctuate up or down, and a client account could lose money investing in an ETF if the prices of the securities owned by the ETF go down. ETFs are subject to additional risks:
- ETF shares may trade above or below their net asset value;
- An active trading market for an ETF’s shares may not develop or be maintained;
- The value of an ETF may be more volatile than the underlying portfolio of securities the ETF is designed to track;
- The cost of owning shares of the ETF may exceed those a client would incur by directly investing in the underlying securities; and
- Trading of an ETF’s shares may be halted if the listing exchange’s officials deem it appropriate, the shares are delisted from the exchange, or the activation of market-wide “circuit breakers” (which are tied to large decreases in stock prices) halts stock trading generally.
Grader Disclosures: Investment in equity strategies involves substantial risk and has the potential for partial or complete loss of funds invested. The sample portfolio and any accompanying charts are for informational purposes only and are not to be construed as a solicitation to buy or sell any financial instrument and should not be relied upon as the sole factor in an investment making decision. As a matter of normal and important disclosures to you, as a potential investor, please consider the following: The performance presented is not based on any actual securities trading, portfolio, or accounts, and the reported performance of the A, B, C, D, and F portfolios (collectively the “model portfolios”) should be considered mere “paper” or pro forma performance results based on Navellier’s research.
Investors evaluating any of Navellier & Associates, Inc.’s, (or its affiliates’) Investment Products must not use any information presented here, including the performance figures of the model portfolios, in their evaluation of any Navellier Investment Products. Navellier Investment Products include the firm’s mutual funds and managed accounts. The model portfolios, charts, and other information presented do not represent actual funded trades and are not actual funded portfolios. There are material differences between Navellier Investment Products’ portfolios and the model portfolios, research, and performance figures presented here. The model portfolios and the research results (1) may contain stocks or ETFs that are illiquid and difficult to trade; (2) may contain stock or ETF holdings materially different from actual funded Navellier Investment Product portfolios; (3) include the reinvestment of all dividends and other earnings, estimated trading costs, commissions, or management fees; and, (4) may not reflect prices obtained in an actual funded Navellier Investment Product portfolio. For these and other reasons, the reported performances of model portfolios do not reflect the performance results of Navellier’s actually funded and traded Investment Products. In most cases, Navellier’s Investment Products have materially lower performance results than the performances of the model portfolios presented.
This report contains statements that are, or may be considered to be, forward-looking statements. All statements that are not historical facts, including statements about our beliefs or expectations, are “forward-looking statements” within the meaning of The U.S. Private Securities Litigation Reform Act of 1995. These statements may be identified by such forward-looking terminology as “expect,” “estimate,” “plan,” “intend,” “believe,” “anticipate,” “may,” “will,” “should,” “could,” “continue,” “project,” or similar statements or variations of such terms. Our forward-looking statements are based on a series of expectations, assumptions, and projections, are not guarantees of future results or performance, and involve substantial risks and uncertainty as described in Form ADV Part 2A of our filing with the Securities and Exchange Commission (SEC), which is available at www.adviserinfo.sec.gov or by requesting a copy by emailing info@navellier.com. All of our forward-looking statements are as of the date of this report only. We can give no assurance that such expectations or forward-looking statements will prove to be correct. Actual results may differ materially. You are urged to carefully consider all such factors.
FEDERAL TAX ADVICE DISCLAIMER: As required by U.S. Treasury Regulations, you are informed that, to the extent this presentation includes any federal tax advice, the presentation is not written by Navellier to be used, and cannot be used, for the purpose of avoiding federal tax penalties. Navellier does not advise on any income tax requirements or issues. Use of any information presented by Navellier is for general information only and does not represent tax advice either express or implied. You are encouraged to seek professional tax advice for income tax questions and assistance.
IMPORTANT NEWSLETTER DISCLOSURE:The hypothetical performance results for investment newsletters that are authored or edited by Louis Navellier, including Louis Navellier’s Growth Investor, Louis Navellier’s Breakthrough Stocks, Louis Navellier’s Accelerated Profits, and Louis Navellier’s Platinum Club, are not based on any actual securities trading, portfolio, or accounts, and the newsletters’ reported hypothetical performances should be considered mere “paper” or proforma hypothetical performance results and are not actual performance of real world trades. Navellier & Associates, Inc. does not have any relation to or affiliation with the owner of these newsletters. There are material differences between Navellier Investment Products’ portfolios and the InvestorPlace Media, LLC newsletter portfolios authored by Louis Navellier. The InvestorPlace Media, LLC newsletters contain hypothetical performance that do not include transaction costs, advisory fees, or other fees a client might incur if actual investments and trades were being made by an investor. As a result, newsletter performance should not be used to evaluate Navellier Investment services which are separate and different from the newsletters. The owner of the newsletters is InvestorPlace Media, LLC and any questions concerning the newsletters, including any newsletter advertising or hypothetical Newsletter performance claims, (which are calculated solely by Investor Place Media and not Navellier) should be referred to InvestorPlace Media, LLC at (800) 718-8289.
Please note that Navellier & Associates and the Navellier Private Client Group are managed completely independent of the newsletters owned and published by InvestorPlace Media, LLC and written and edited by Louis Navellier, and investment performance of the newsletters should in no way be considered indicative of potential future investment performance for any Navellier & Associates separately managed account portfolio. Potential investors should consult with their financial advisor before investing in any Navellier Investment Product.
Navellier claims compliance with Global Investment Performance Standards (GIPS). To receive a complete list and descriptions of Navellier’s composites and/or a presentation that adheres to the GIPS standards, please contact Navellier or click here. It should not be assumed that any securities recommendations made by Navellier & Associates, Inc. in the future will be profitable or equal the performance of securities made in this report.
FactSet Disclosure: Navellier does not independently calculate the statistical information included in the attached report. The calculation and the information are provided by FactSet, a company not related to Navellier. Although information contained in the report has been obtained from FactSet and is based on sources Navellier believes to be reliable, Navellier does not guarantee its accuracy, and it may be incomplete or condensed. The report and the related FactSet sourced information are provided on an “as is” basis. The user assumes the entire risk of any use made of this information. Investors should consider the report as only a single factor in making their investment decision. The report is for informational purposes only and is not intended as an offer or solicitation for the purchase or sale of a security. FactSet sourced information is the exclusive property of FactSet. Without prior written permission of FactSet, this information may not be reproduced, disseminated or used to create any financial products. All indices are unmanaged and performance of the indices include reinvestment of dividends and interest income, unless otherwise noted, are not illustrative of any particular investment and an investment cannot be made in any index. Past performance is no guarantee of future results.