by Jason Bodner
October 15, 2024
I love quantitative investing. It removes emotion from investing, so I can live my dream: writing financial algorithms while listening to Bach instead of CNBC talking heads.
Painfully boring, right? Bach might not be your top Spotify choice. Nerdy? Maybe. Popular? Not at all. But, popularity isn’t always healthy for your investing results.
Financial news hosts love to bring forth “experts” to opine on the markets’ future. While it may be fun focusing on these live on-air debates, it’s mostly noise. I don’t think it helps us achieve much success.
It does, however, gather audience eyeballs so that advertisers can get their message to precious eyes and ears. After all, the media business model is not to make you a great investor, it’s to generate ad revenue.
This crystallized for me when I viewed one of my heroes on CNBC in 2013.
David Harding founded Winton Capital in 1997 with just $1.7 million. His view was to grow a business based on scientific research and no marketing. He grew it to become one of the top quantitative research funds in the world. Winton currently manages $12 billion. Specific returns are hard to find, but one journal in 2005 showed a CAGR of 21.47% since inception. That implied a 4.7-fold increase on capital.
Harding is now a billionaire, so it seems like we would want to listen to this guy, right? But when I saw his CNBC clip, I knew this investing genius wouldn’t be invited back any time soon, if at all.
Here’s why: in this 2:23 clip, he was grilled about macro events. Asked if his system predicts the price of gold, he replied bluntly,“It doesn’t give us any good guidance, sadly, in any markets at all, ever.”
The interview concluded with a thud, like this:
Joe Kernan, CNBC: “Can you tell us any big major macro things going on that the past has told us that might be going on right now?”
David Harding: “No, no, I can’t.”
Joe Kernan: “Does the dollar lose its king status eventually?
David Harding: “No, I mean we have no knowledge or information from our computer systems like that.”
That’s the end of the interview. I can almost see the producers telling Joe to cut this interview short. And, sure enough, searching “David Harding on CNBC,” you can count his appearances on one hand.
David Harding didn’t give any sexy soundbites, scandals, or anything juicy. It was dry, boring and factual: His system had only a slight edge, and he used it to make money regardless of what the headlines said.
The truth is that his unsensational wisdom may never be popular … even if it holds the keys to success.
For me, investing success lies in the data, not the media. It reminds me of another story: Nicolas Darvas, a professional dancer in the 1950s, started with no training, a dancer and an amateur investor, but he made $2 million in 1958; $21 million in today’s money. He designed Darvas boxes, which look like this:
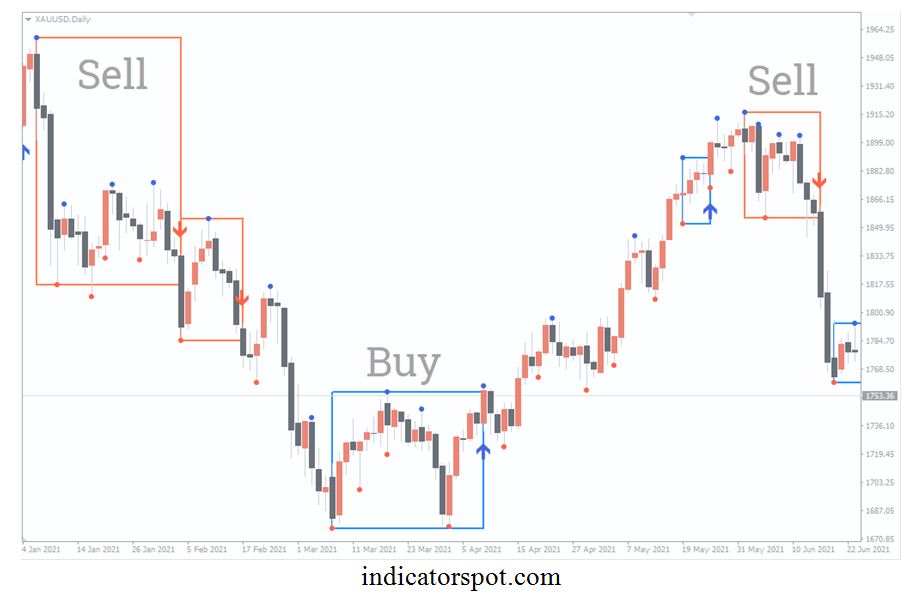
Graphs are for illustrative and discussion purposes only. Please read important disclosures at the end of this commentary.
Applying those Darvas boxes to our own Big Money Index (BMI), we see strong correlation. When the value rises or drops outside of a box, we see future trends developing:
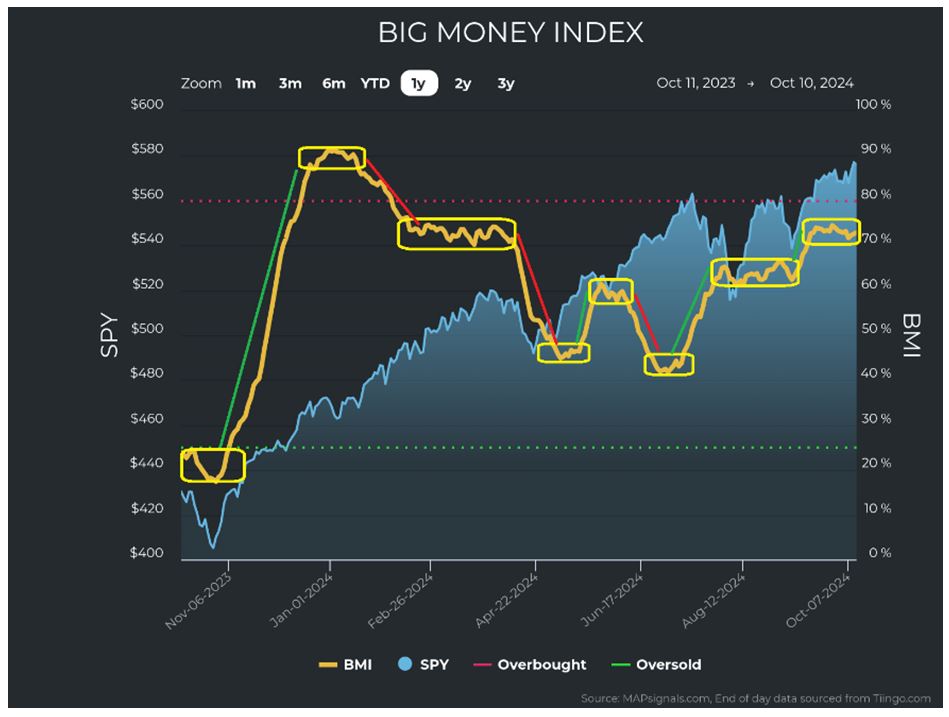
Graphs are for illustrative and discussion purposes only. Please read important disclosures at the end of this commentary.
Currently, we are in a tight box. What’s next is not clear: We can break down or break out.
Unusual buying has been dwindling while unusual selling is picking up slightly:
That helps explain the sideways BMI. Another near-term concern is that volume is waning:
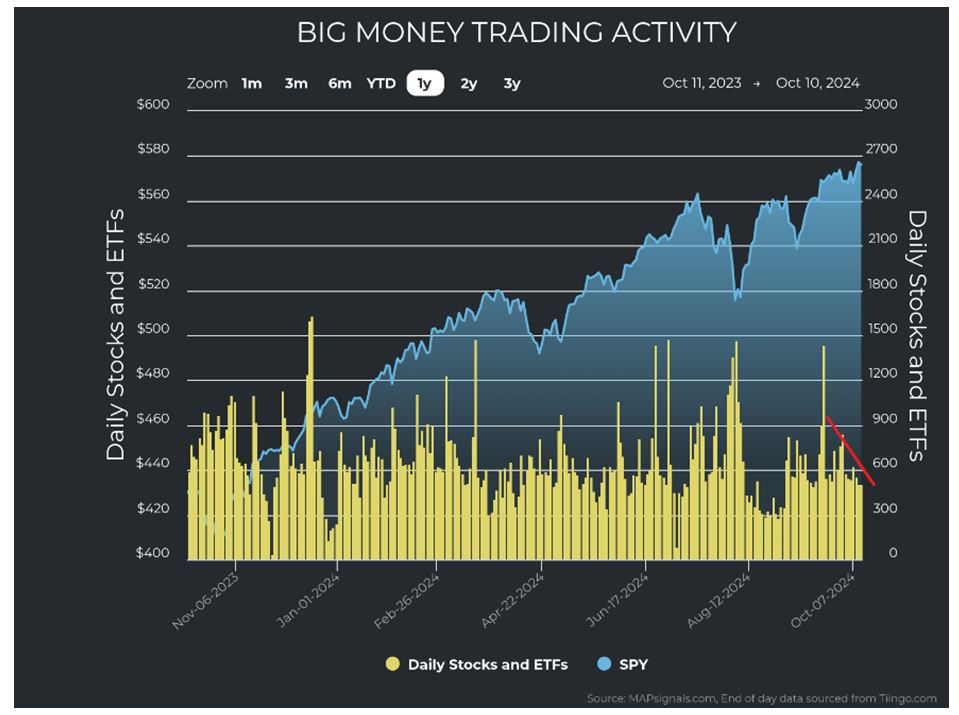
Graphs are for illustrative and discussion purposes only. Please read important disclosures at the end of this commentary.
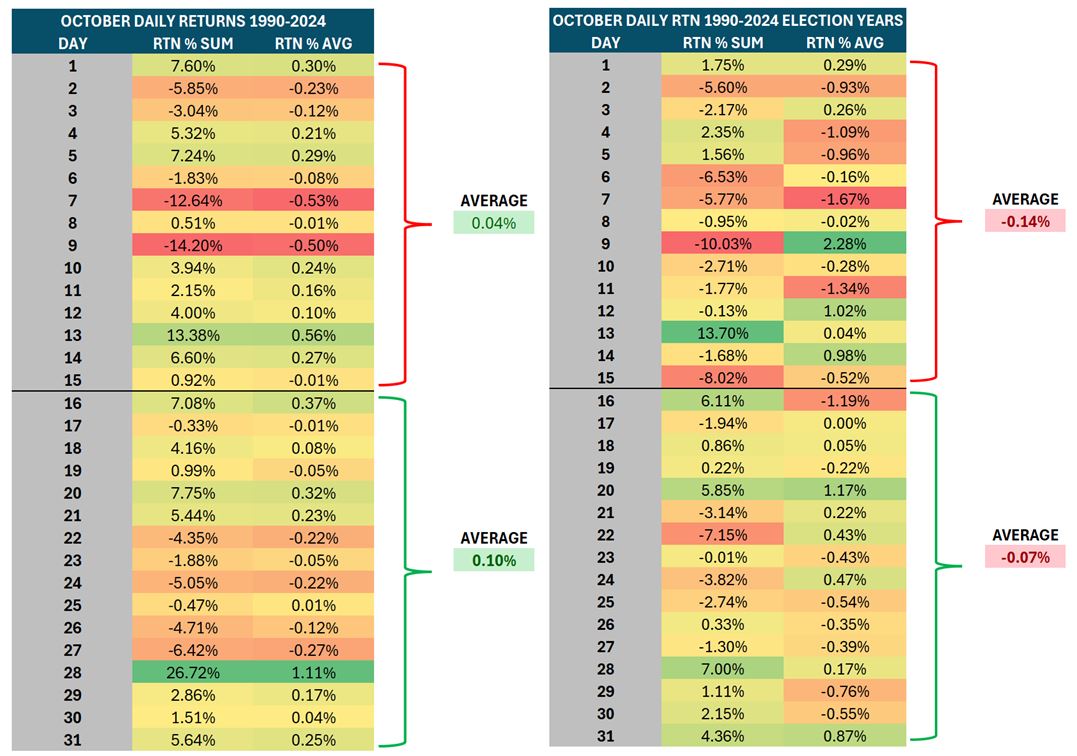
Add in the fact that we are in October and a Presidential election nears, and we shouldn’t be surprised if we see volatility. Until October 15, history says to expect choppiness, but afterwards expect rising prices:
![]()
Graphs are for illustrative and discussion purposes only. Please read important disclosures at the end of this commentary.
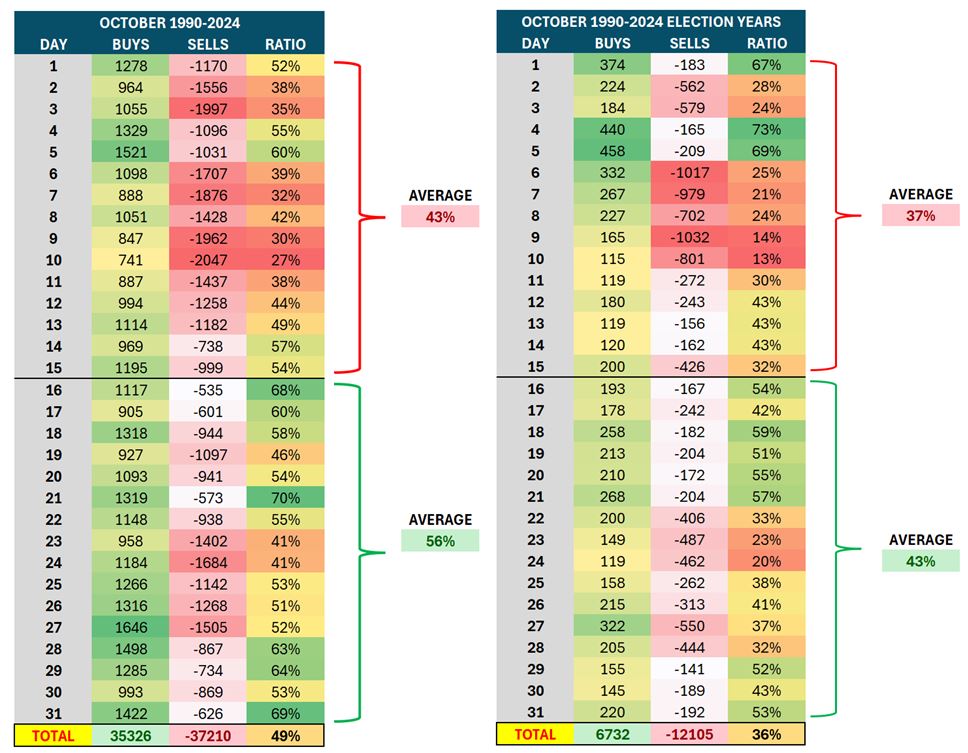
Election years complicate expectations, as average returns are negative in the back half of the month:
![]()
Graphs are for illustrative and discussion purposes only. Please read important disclosures at the end of this commentary.
This history indicates that an October Surprise before the election could bring volatility. All that data indicates that the market is pausing, at least for now. We see this echoed in the sector charts.
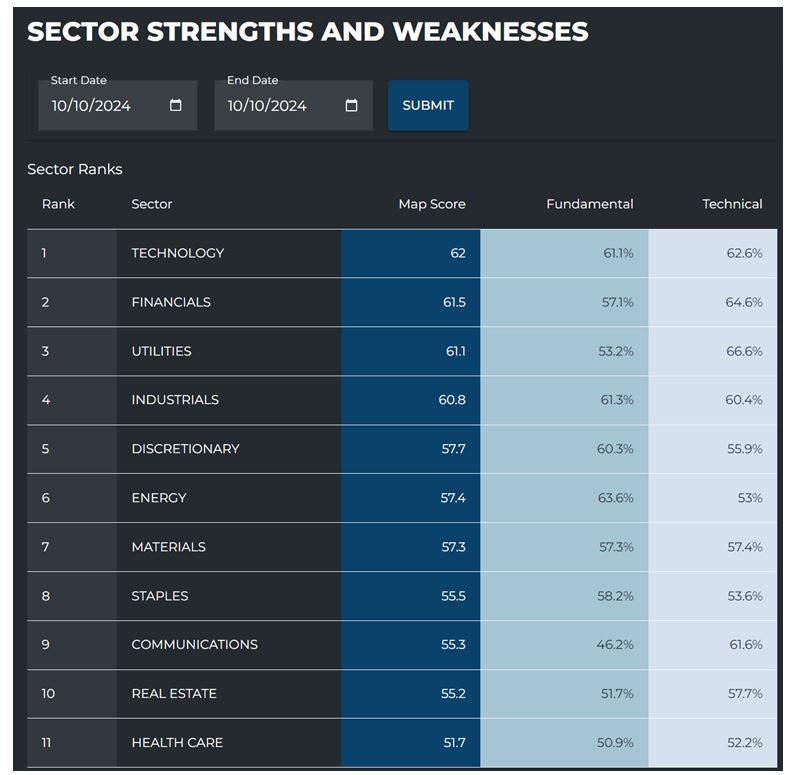
First, let’s check in on the strength and weakness table. Technology rose again to regain the top spot. With Industrials and Discretionary not far behind, this is constructive for the long-term bull market. (More on that later, but for now we notice that growth sectors are moving higher).
Graphs are for illustrative and discussion purposes only. Please read important disclosures at the end of this commentary.
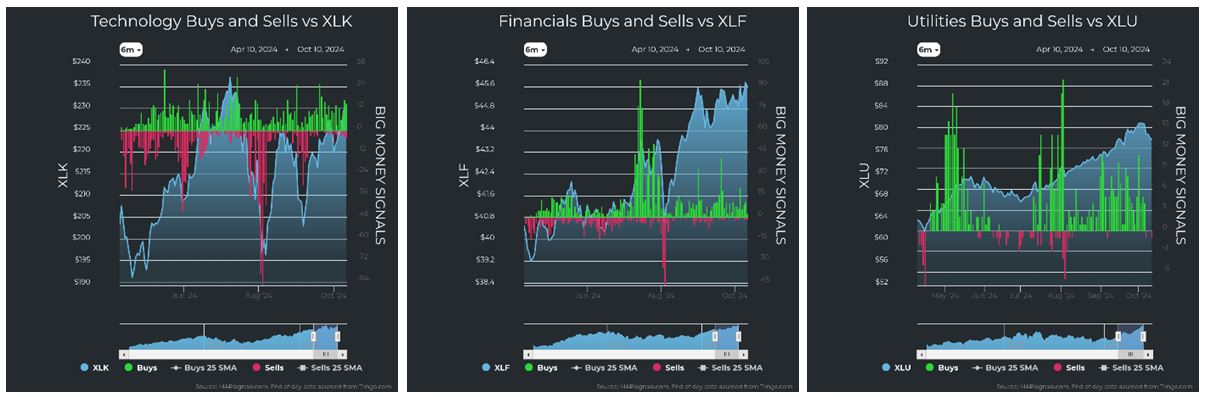
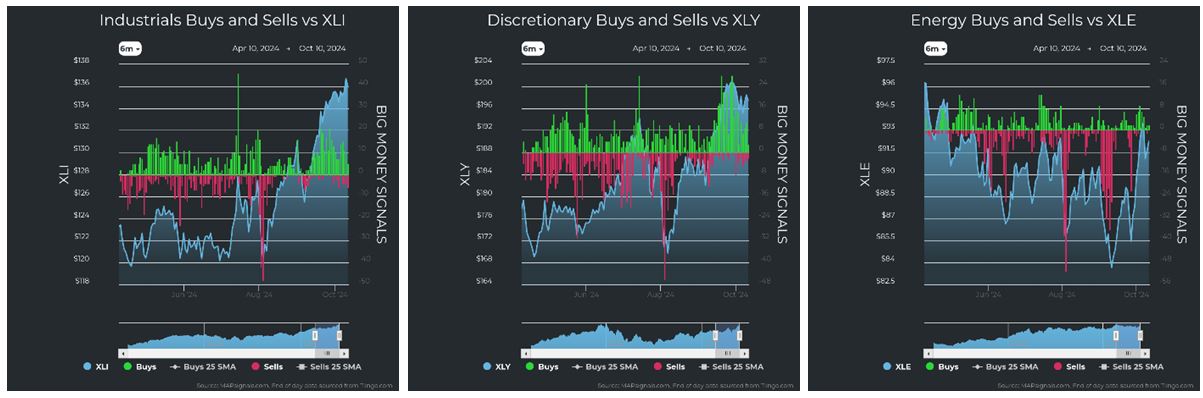
The main takeaway when looking at the 11 individual sectors (below) is that seven sectors have retreated from their highs. Technology, Financials, Industrials, and Communications are at highs, while the other seven sectors have cooled slightly after a strong rise. The positive underlying data show that only Health Care is experiencing any selling of note. The strong sectors powering the recent rally echo the market overall, as we see the recent slowdown is mainly due to a decline in unusual buying.
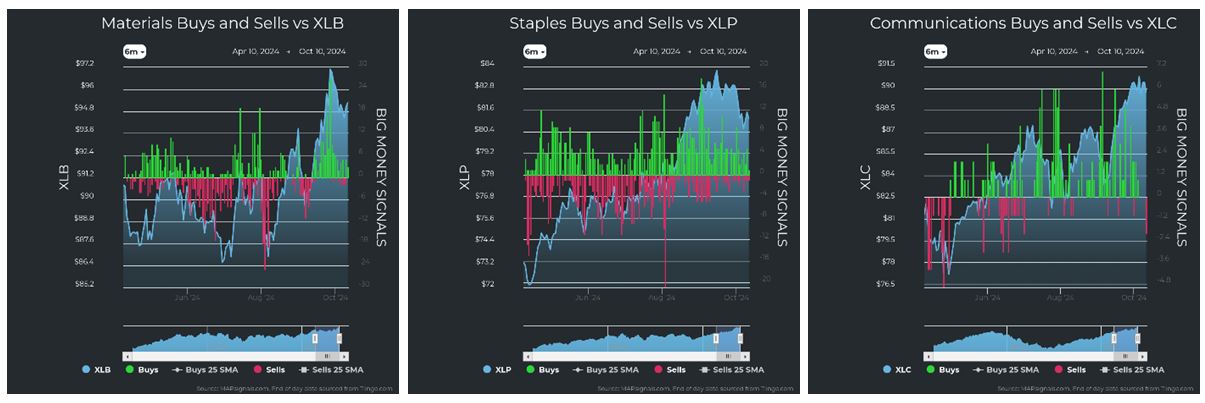
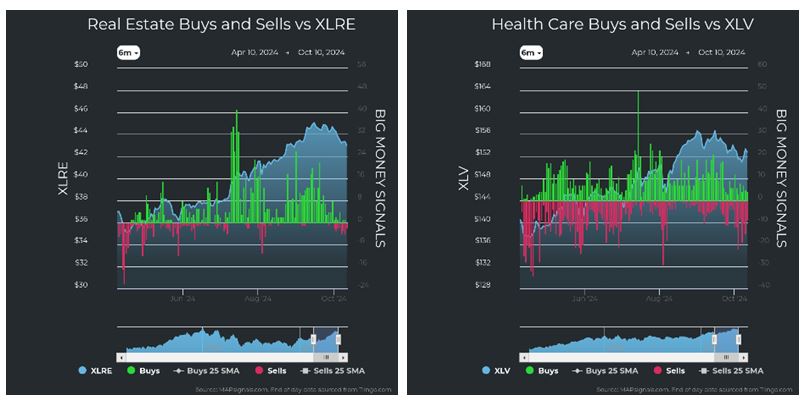
Graphs are for illustrative and discussion purposes only. Please read important disclosures at the end of this commentary.
Technology, Industrials and Discretionary growth sectors are rocket fuel for a long uptrend. They are growth sectors. And, with the small-cap driven rally recently, this is especially bullish for the next 24-months.
When we account for falling rates and record cash levels, the setup is clear: Stocks are going higher.
First, we see that the Fed funds effective rate is finally starting to fall and chase the falling CPI.
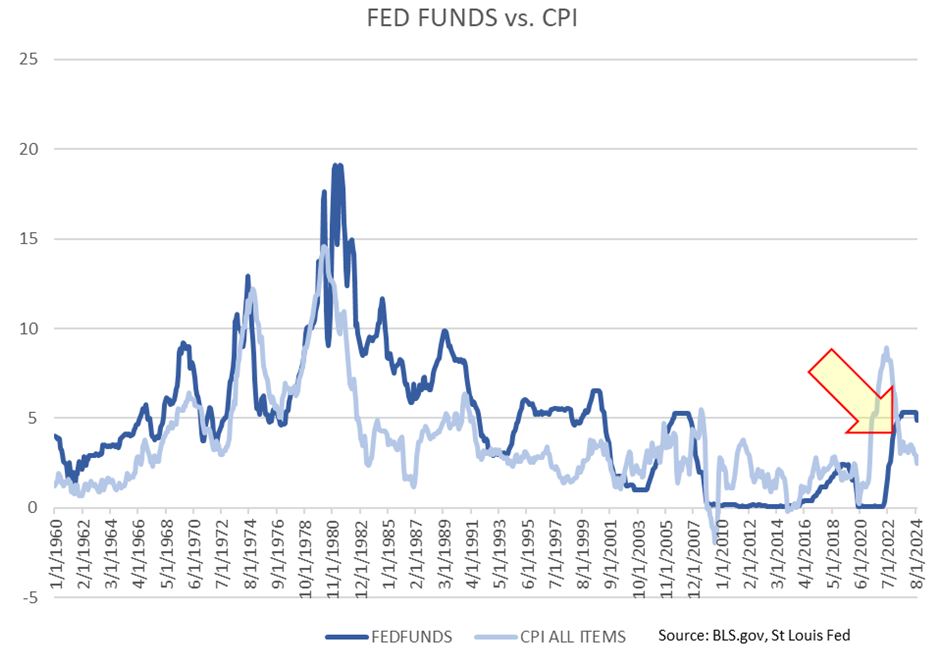
Graphs are for illustrative and discussion purposes only. Please read important disclosures at the end of this commentary.
That dark-blue line starting to fall tells us that rates are collapsing. They will continue to fall in money market cash accounts. As they do, that cash will chase returns elsewhere, which makes this a good time to revisit the chart of money market funds, which are currently at records highs above $6 trillion.
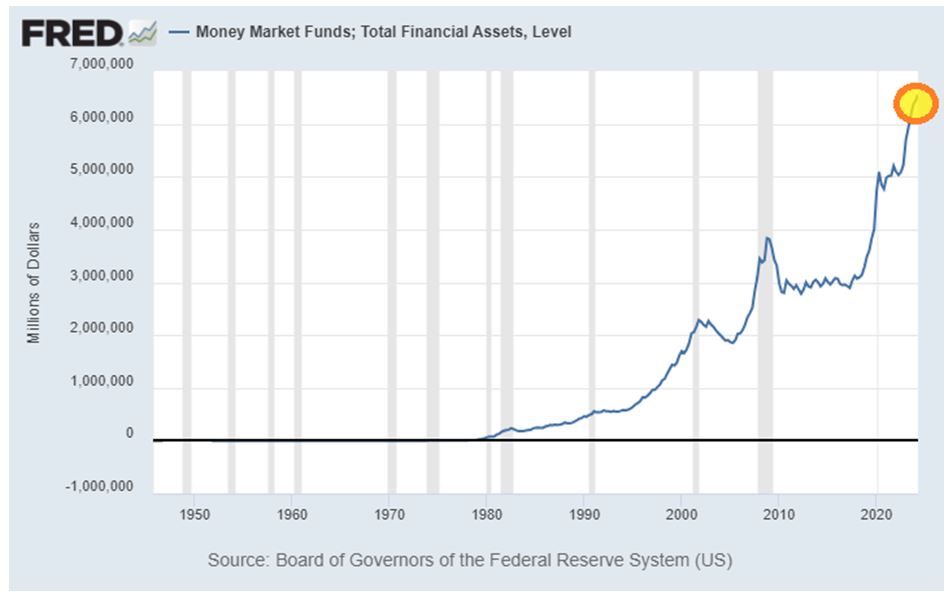
Graphs are for illustrative and discussion purposes only. Please read important disclosures at the end of this commentary.
As cash earns less interest, investors will flood into stocks, specifically smaller and mid-sized companies.
In summary, quantitative analysis removes emotion and lets us take facts for what they are. This approach led David Harding to turn $1.7 million into $12 billion and become a billionaire. It also led him to be an unpopular and infrequent TV guest. I say, let TV do what it does best: entertain. But when it comes to investing, go with cold hard data. What’s popular isn’t necessarily effective, but popularity can be fun.
Desmond Tutu said: “Most of us would prefer to be popular than unpopular.” He was right, but Vivienne Westwood said it better: “The only possible effect one can have on the world is through unpopular ideas.”
All content above represents the opinion of Jason Bodner of Navellier & Associates, Inc.
Also In This Issue
A Look Ahead by Louis Navellier
The Futuristic World of “Robotaxi” is Finally Here
Income Mail by Bryan Perry
The Challenge of Finding High-Quality Yields in a Rising Market
Growth Mail by Gary Alexander
Who Should Win This Week’s Nobel Prize for Economics?
Global Mail by Ivan Martchev
We’re Seeing Some Seasonality in Reverse
Sector Spotlight by Jason Bodner
Why the Media Don’t Want You to Know the Truth about Their Reporting
View Full Archive
Read Past Issues Here

Jason Bodner
MARKETMAIL EDITOR FOR SECTOR SPOTLIGHT
Jason Bodner writes Sector Spotlight in the weekly Marketmail publication and has authored several white papers for the company. He is also Co-Founder of Macro Analytics for Professionals which produces proprietary equity accumulation and distribution research for its clients. Previously, Mr. Bodner served as Director of European Equity Derivatives for Cantor Fitzgerald Europe in London, then moved to the role of Head of Equity Derivatives North America for the same company in New York. He also served as S.V.P. Equity Derivatives for Jefferies, LLC. He received a B.S. in business administration in 1996, with honors, from Skidmore College as a member of the Periclean Honors Society. All content of “Sector Spotlight” represents the opinion of Jason Bodner
Important Disclosures:
Jason Bodner is a co-founder and co-owner of Mapsignals. Mr. Bodner is an independent contractor who is occasionally hired by Navellier & Associates to write an article and or provide opinions for possible use in articles that appear in Navellier & Associates weekly Market Mail. Mr. Bodner is not employed or affiliated with Louis Navellier, Navellier & Associates, Inc., or any other Navellier owned entity. The opinions and statements made here are those of Mr. Bodner and not necessarily those of any other persons or entities. This is not an endorsement, or solicitation or testimonial or investment advice regarding the BMI Index or any statements or recommendations or analysis in the article or the BMI Index or Mapsignals or its products or strategies.
Although information in these reports has been obtained from and is based upon sources that Navellier believes to be reliable, Navellier does not guarantee its accuracy and it may be incomplete or condensed. All opinions and estimates constitute Navellier’s judgment as of the date the report was created and are subject to change without notice. These reports are for informational purposes only and are not a solicitation for the purchase or sale of a security. Any decision to purchase securities mentioned in these reports must take into account existing public information on such securities or any registered prospectus.To the extent permitted by law, neither Navellier & Associates, Inc., nor any of its affiliates, agents, or service providers assumes any liability or responsibility nor owes any duty of care for any consequences of any person acting or refraining to act in reliance on the information contained in this communication or for any decision based on it.
Past performance is no indication of future results. Investment in securities involves significant risk and has the potential for partial or complete loss of funds invested. It should not be assumed that any securities recommendations made by Navellier. in the future will be profitable or equal the performance of securities made in this report. Dividend payments are not guaranteed. The amount of a dividend payment, if any, can vary over time and issuers may reduce dividends paid on securities in the event of a recession or adverse event affecting a specific industry or issuer.
None of the stock information, data, and company information presented herein constitutes a recommendation by Navellier or a solicitation to buy or sell any securities. Any specific securities identified and described do not represent all of the securities purchased, sold, or recommended for advisory clients. The holdings identified do not represent all of the securities purchased, sold, or recommended for advisory clients and the reader should not assume that investments in the securities identified and discussed were or will be profitable.
Information presented is general information that does not take into account your individual circumstances, financial situation, or needs, nor does it present a personalized recommendation to you. Individual stocks presented may not be suitable for every investor. Investment in securities involves significant risk and has the potential for partial or complete loss of funds invested. Investment in fixed income securities has the potential for the investment return and principal value of an investment to fluctuate so that an investor’s holdings, when redeemed, may be worth less than their original cost.
One cannot invest directly in an index. Index is unmanaged and index performance does not reflect deduction of fees, expenses, or taxes. Presentation of Index data does not reflect a belief by Navellier that any stock index constitutes an investment alternative to any Navellier equity strategy or is necessarily comparable to such strategies. Among the most important differences between the Indices and Navellier strategies are that the Navellier equity strategies may (1) incur material management fees, (2) concentrate its investments in relatively few stocks, industries, or sectors, (3) have significantly greater trading activity and related costs, and (4) be significantly more or less volatile than the Indices.
ETF Risk: We may invest in exchange traded funds (“ETFs”) and some of our investment strategies are generally fully invested in ETFs. Like traditional mutual funds, ETFs charge asset-based fees, but they generally do not charge initial sales charges or redemption fees and investors typically pay only customary brokerage fees to buy and sell ETF shares. The fees and costs charged by ETFs held in client accounts will not be deducted from the compensation the client pays Navellier. ETF prices can fluctuate up or down, and a client account could lose money investing in an ETF if the prices of the securities owned by the ETF go down. ETFs are subject to additional risks:
- ETF shares may trade above or below their net asset value;
- An active trading market for an ETF’s shares may not develop or be maintained;
- The value of an ETF may be more volatile than the underlying portfolio of securities the ETF is designed to track;
- The cost of owning shares of the ETF may exceed those a client would incur by directly investing in the underlying securities and;
- Trading of an ETF’s shares may be halted if the listing exchange’s officials deem it appropriate, the shares are delisted from the exchange, or the activation of market-wide “circuit breakers” (which are tied to large decreases in stock prices) halts stock trading generally.
Grader Disclosures: Investment in equity strategies involves substantial risk and has the potential for partial or complete loss of funds invested. The sample portfolio and any accompanying charts are for informational purposes only and are not to be construed as a solicitation to buy or sell any financial instrument and should not be relied upon as the sole factor in an investment making decision. As a matter of normal and important disclosures to you, as a potential investor, please consider the following: The performance presented is not based on any actual securities trading, portfolio, or accounts, and the reported performance of the A, B, C, D, and F portfolios (collectively the “model portfolios”) should be considered mere “paper” or pro forma performance results based on Navellier’s research.
Investors evaluating any of Navellier & Associates, Inc.’s, (or its affiliates’) Investment Products must not use any information presented here, including the performance figures of the model portfolios, in their evaluation of any Navellier Investment Products. Navellier Investment Products include the firm’s mutual funds and managed accounts. The model portfolios, charts, and other information presented do not represent actual funded trades and are not actual funded portfolios. There are material differences between Navellier Investment Products’ portfolios and the model portfolios, research, and performance figures presented here. The model portfolios and the research results (1) may contain stocks or ETFs that are illiquid and difficult to trade; (2) may contain stock or ETF holdings materially different from actual funded Navellier Investment Product portfolios; (3) include the reinvestment of all dividends and other earnings, estimated trading costs, commissions, or management fees; and, (4) may not reflect prices obtained in an actual funded Navellier Investment Product portfolio. For these and other reasons, the reported performances of model portfolios do not reflect the performance results of Navellier’s actually funded and traded Investment Products. In most cases, Navellier’s Investment Products have materially lower performance results than the performances of the model portfolios presented.
This report contains statements that are, or may be considered to be, forward-looking statements. All statements that are not historical facts, including statements about our beliefs or expectations, are “forward-looking statements” within the meaning of The U.S. Private Securities Litigation Reform Act of 1995. These statements may be identified by such forward-looking terminology as “expect,” “estimate,” “plan,” “intend,” “believe,” “anticipate,” “may,” “will,” “should,” “could,” “continue,” “project,” or similar statements or variations of such terms. Our forward-looking statements are based on a series of expectations, assumptions, and projections, are not guarantees of future results or performance, and involve substantial risks and uncertainty as described in Form ADV Part 2A of our filing with the Securities and Exchange Commission (SEC), which is available at www.adviserinfo.sec.gov or by requesting a copy by emailing info@navellier.com. All of our forward-looking statements are as of the date of this report only. We can give no assurance that such expectations or forward-looking statements will prove to be correct. Actual results may differ materially. You are urged to carefully consider all such factors.
FEDERAL TAX ADVICE DISCLAIMER: As required by U.S. Treasury Regulations, you are informed that, to the extent this presentation includes any federal tax advice, the presentation is not written by Navellier to be used, and cannot be used, for the purpose of avoiding federal tax penalties. Navellier does not advise on any income tax requirements or issues. Use of any information presented by Navellier is for general information only and does not represent tax advice either express or implied. You are encouraged to seek professional tax advice for income tax questions and assistance.
IMPORTANT NEWSLETTER DISCLOSURE:The hypothetical performance results for investment newsletters that are authored or edited by Louis Navellier, including Louis Navellier’s Growth Investor, Louis Navellier’s Breakthrough Stocks, Louis Navellier’s Accelerated Profits, and Louis Navellier’s Platinum Club, are not based on any actual securities trading, portfolio, or accounts, and the newsletters’ reported hypothetical performances should be considered mere “paper” or proforma hypothetical performance results and are not actual performance of real world trades. Navellier & Associates, Inc. does not have any relation to or affiliation with the owner of these newsletters. There are material differences between Navellier Investment Products’ portfolios and the InvestorPlace Media, LLC newsletter portfolios authored by Louis Navellier. The InvestorPlace Media, LLC newsletters contain hypothetical performance that do not include transaction costs, advisory fees, or other fees a client might incur if actual investments and trades were being made by an investor. As a result, newsletter performance should not be used to evaluate Navellier Investment services which are separate and different from the newsletters. The owner of the newsletters is InvestorPlace Media, LLC and any questions concerning the newsletters, including any newsletter advertising or hypothetical Newsletter performance claims, (which are calculated solely by Investor Place Media and not Navellier) should be referred to InvestorPlace Media, LLC at (800) 718-8289.
Please note that Navellier & Associates and the Navellier Private Client Group are managed completely independent of the newsletters owned and published by InvestorPlace Media, LLC and written and edited by Louis Navellier, and investment performance of the newsletters should in no way be considered indicative of potential future investment performance for any Navellier & Associates separately managed account portfolio. Potential investors should consult with their financial advisor before investing in any Navellier Investment Product.
Navellier claims compliance with Global Investment Performance Standards (GIPS). To receive a complete list and descriptions of Navellier’s composites and/or a presentation that adheres to the GIPS standards, please contact Navellier or click here. It should not be assumed that any securities recommendations made by Navellier & Associates, Inc. in the future will be profitable or equal the performance of securities made in this report.
FactSet Disclosure: Navellier does not independently calculate the statistical information included in the attached report. The calculation and the information are provided by FactSet, a company not related to Navellier. Although information contained in the report has been obtained from FactSet and is based on sources Navellier believes to be reliable, Navellier does not guarantee its accuracy, and it may be incomplete or condensed. The report and the related FactSet sourced information are provided on an “as is” basis. The user assumes the entire risk of any use made of this information. Investors should consider the report as only a single factor in making their investment decision. The report is for informational purposes only and is not intended as an offer or solicitation for the purchase or sale of a security. FactSet sourced information is the exclusive property of FactSet. Without prior written permission of FactSet, this information may not be reproduced, disseminated or used to create any financial products. All indices are unmanaged and performance of the indices include reinvestment of dividends and interest income, unless otherwise noted, are not illustrative of any particular investment and an investment cannot be made in any index. Past performance is no guarantee of future results.