by Gary Alexander
October 15, 2024
The Nobel Prize in Economic Sciences will be announced this week, perhaps today, but since we go to press Monday, I don’t know who will win, but this year marks the 55th anniversary of the first such award and the 50th anniversary of the first great free-market winner, Austrian economist Friedrich Hayek, in 1974 – the same year that brought us the birth of the “Laffer Curve” and Robert Barro’s first notable economics essay. Robert Barro and Art Laffer are my top two picks. I’ll list four in all. The first three are notable Growth advocates, profiled here in alphabetical order, which is also the order I would rank them.
#1: Robert J. Barro, 80, is currently Professor of Economics at Harvard and senior fellow at Stanford’s Hoover Institution. He first gained fame for his 1974 paper, “Are Government Bonds Net Wealth?” It was written during America’s first wave of high inflation. He argued (against the then-current orthodoxy) that these sovereign bonds tend to engender future taxation and inflation, and hence are “not net wealth.”
Barro is a champion of growth. His 1984 Macroeconomics textbook is a standard of excellence, along with his co-authored 1995 graduate level textbook, Economic Growth. His primary focus since 1990 was comparing growth profiles between private and public sectors and between nations and their policies.
In the first category, Barro showed that for every dollar the government borrows and spends, spending in the private economy falls by almost the same amount, making him an opponent of stimulus spending. For example, he called President Obama’s stimulus bill “garbage” and “the worst bill since the 1930s.”
When comparing national policies, Barro assembled a data set of incomes since 1960 for nearly 100 countries along with a long list of variables that influence growth in incomes, such as school enrollment, private investment and the size and stability of its government. He found that poor countries tend to catch up with rich countries “if the poor countries have high human capital…but not otherwise.” He also found that government investments did little to trigger growth, and even tended to reduce economic growth.
We’ve seen developing nations grow faster when following Barro’s preferred model. Larry Summers (#4 on my list, below) called Barro’s positive variables “the iron law of convergence.” In fact, Barro’s body of work is credited with turning the tide of academic thought in favor of a smaller government role.
#2: Art Laffer, 84, developed the “Laffer Curve” 50 years ago during the Ford administration, when he was a Professor of Economics at the University of Chicago (1967-76). I later met him at the University of Southern California, where I worked (1976=79) and he held sway from 1976 to 1984 while also serving as a member of Ronald Reagan’s Economic Policy Advisory Board. During the mid-1980s, I enlisted him to be a regular columnist in our Wealth Magazine, where he wrote regularly on the development of the groundbreaking 1986 Tax Reform Act, the purest form of the Laffer Curve in action – eliminating nearly all tax shelters and preferences while reducing tax rates to two levels, 15% and 28%, on the theory that moderate tax rates generate higher tax revenues. A 10% rate raises too little revenue, and so does a 50% tax rate. Experience shows that the most revenue is raised in the mid-20% range. Historically, under Coolidge in the 1920s and Kennedy/Johnson in the 1960s, top tax rate cuts raised the most revenues.
The reason I recommend Laffer for this year’s Nobel Prize is that we just learned that the federal fiscal year of 2024 has given us yet another proof the Laffer Curve works. The Trump tax cuts of 2017 paid for themselves within two years, but the Biden-Harris administration has kept those tax rates intact for nearly four years, and they kept generating massively higher tax revenues. Tax revenue climbed 11% in fiscal year 204 to a record $4.92 trillion vs. FY’23. Before COVID in 2020, total federal tax revenues were under $3.5 trillion each year, so tax revenues are booming in 2024 at Trump’s lower top tax rates.
In his book, “Taxes Have Consequences,” Laffer and his co-authors, Brian Domitrovic and Jeanne Cairns Sinquefield, show how this magic formula has worked in every administration – both Democratic and Republican – over the last century, under the simple common-sense principle that, when faced with punitively high top tax rates, high-income earners have the means, motive, options and wherewithal to “readily change the location of where they earn their income, the timing as to when they receive that income – not to mention how much income they choose to earn.” Likewise, when taxes are affordable – under 30% – those same high earners will roll up their sleeves, work more, and send in more total taxes.

#3: Mark Skousen, 77 this week, the Doti-Spogli Chair of Free Enterprise at Chapman University, made a major contribution to economic statistics with his magnum opus, “The Structure of Production,” which forms the theoretical basis for a new, broader definition of growth, Gross Output (GO), which could in time equal the influence of Gross Domestic Product (GDP).
Gross Output measures the production sector, while GDP measures consumption. “Both are required in a complete system of accounts” (Dale W. Jorgenson, J. Stephen Landefeld, and William D. Nordhaus, in “A New Architecture of U.S. Accounts”). As you may have heard (endlessly), “The consumer represents 70% of the economy,” but that is only true of the GDP, which overloads the end-product sales to the consumer while ignoring the primary stages of production. GDP leaves out the supply chain – all of the business-to-business (B2B) transactions in the production process, since GDP only measures the end-product sales.
The “Structure of Production” comes in four stages (chart below, left). The first three stages are ignored by GDP. When those stages are included, Gross Output totals about twice the volume of GDP, and it is more volatile (right chart). In an expansion, GO tends to grow faster than GDP; during a contraction, GO declines more sharply; and during the recovery stage, GO tends to accelerate at a faster rate than GDP.
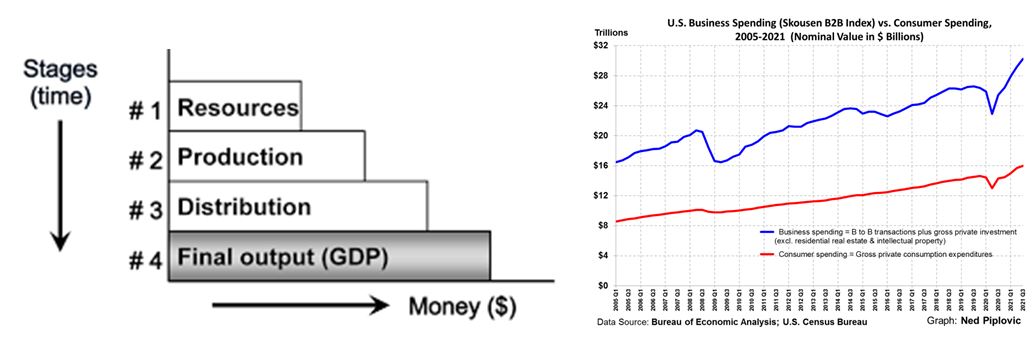
Graphs are for illustrative and discussion purposes only. Please read important disclosures at the end of this commentary.
As Gross Output gains traction, Skousen’s contribution to economic understanding deserves a Nobel look.

#4: Lawrence Summers, nearly 70, the second Harvard Professor on this list, is my only Democrat on the list, and in fourth place, with no book recommendation I like, but he deserves special recommendation for his research papers and for speaking truth to power about President Biden’s first major act in office in February 2021, the “American Rescue Plan.” Summers bravely broke ranks with his Democratic team in calling this $1.9 trillion stimulus package, passed in the midst of a strong recovery, “the least responsible macroeconomic policy we’ve had in the last 40 years.” It provided “helicopter money, like $1,400 in personal “paycheck protection plans” as a reward for not working, and $600 per week in unemployment checks, which often went right into stock speculation accounts, in too many cases, for up to 18 months.
In a February 4, 2021, Washington Post op-ed, Summers dared to predict, “macroeconomic stimulus on a scale closer to World War II levels than normal recession levels will set off inflationary pressures of a kind we have not seen in a generation.” At the time he said this, the Consumer Price Index was below 2% and hardly anyone but perma-bears and some Republican zealots were predicting high-inflation, but high-inflation came. The CPI eventually soared to over 9%, while Fed leaders and Treasury Secretary Janet Yellen said inflation was “transitory” (as in 2021 alone). This high inflation lasted for two years, and it was even higher if you include debt service and housing under Summers’ old measurement standard, and in his latest paper on the inclusion of debt service, which pushed real inflation to a peak of 18%.
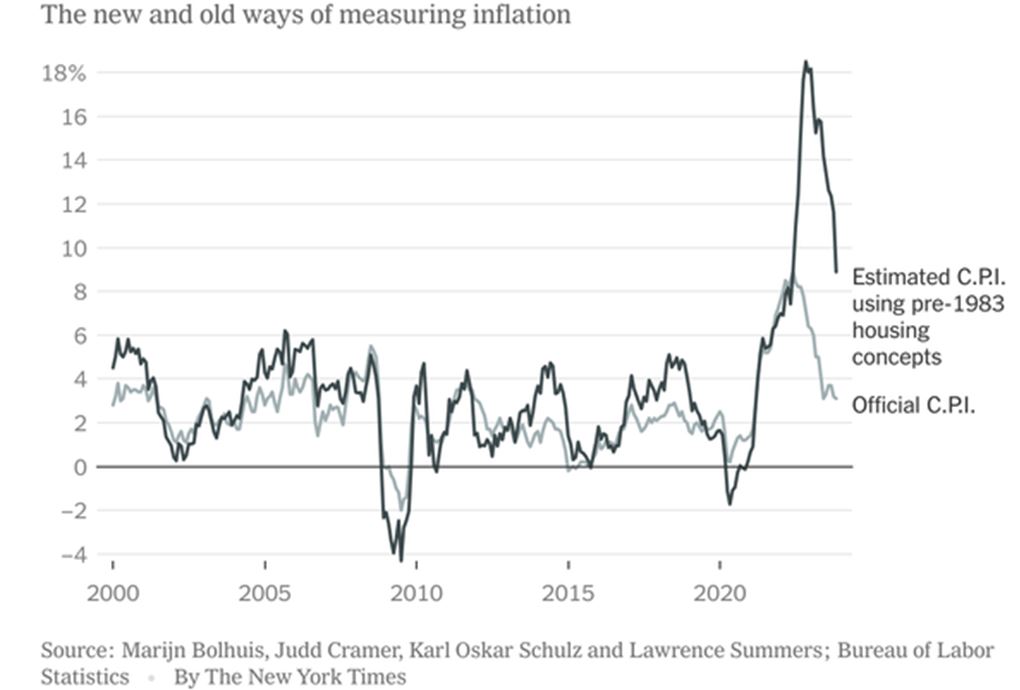
Graphs are for illustrative and discussion purposes only. Please read important disclosures at the end of this commentary.
In April 2021, San Francisco Federal Reserve President Mary Daly told Barron’s that the Fed’s main goal was still to RAISE inflation to 2%, saying “We always have the tools to pull inflation down if it gets too high.” My response was a headline here: “Inflation Will Roar Again – And Probably Soon” (April 13, 2021), so Larry Summers and I had a jump on the Federal Reserve and the Biden-Harris spending team.
The odds are that I’m way off base and somebody else will win this week’s Nobel Prize in Economics, but I tend to favor these four, with a real-world market impact, not some ivory-tower theoretician.
If not now, then soon. This quartet is not getting any younger.
P.S. The Nobel-winning economists were announced Monday morning – a three-way tie of those specializing in wealth disparities between nations. On the surface, some of their research seems to contradict my #1 pick, Robert Barro, but that’s the nature of conflicting currents of economic thought. What struck me most in this political season is that one of the winners, Simon Johnson, made the same misguided prediction that Nobel Laureate Paul Krugman made in the New York Times on the eve of the 2016 election – a stock market crash and recession if Trump won. Johnson wrote, a week before the 2016 election, “…growth and employment around the world look fragile. A big adverse surprise – like the election of Donald Trump in the US – would likely cause the stock market to crash and plunge the world into recession.” Of course, Trump won, the market rallied and there was no recession.
All content above represents the opinion of Gary Alexander of Navellier & Associates, Inc.
Also In This Issue
A Look Ahead by Louis Navellier
The Futuristic World of “Robotaxi” is Finally Here
Income Mail by Bryan Perry
The Challenge of Finding High-Quality Yields in a Rising Market
Growth Mail by Gary Alexander
Who Should Win This Week’s Nobel Prize for Economics?
Global Mail by Ivan Martchev
We’re Seeing Some Seasonality in Reverse
Sector Spotlight by Jason Bodner
Why the Media Don’t Want You to Know the Truth about Their Reporting
View Full Archive
Read Past Issues Here
About The Author

Gary Alexander
SENIOR EDITOR
Gary Alexander has been Senior Writer at Navellier since 2009. He edits Navellier’s weekly Marketmail and writes a weekly Growth Mail column, in which he uses market history to support the case for growth stocks. For the previous 20-years before joining Navellier, he was Senior Executive Editor at InvestorPlace Media (formerly Phillips Publishing), where he worked with several leading investment analysts, including Louis Navellier (since 1997), helping launch Louis Navellier’s Blue Chip Growth and Global Growth newsletters.
Prior to that, Gary edited Wealth Magazine and Gold Newsletter and wrote various investment research reports for Jefferson Financial in New Orleans in the 1980s. He began his financial newsletter career with KCI Communications in 1980, where he served as consulting editor for Personal Finance newsletter while serving as general manager of KCI’s Alexandria House book division. Before that, he covered the economics beat for news magazines. All content of “Growth Mail” represents the opinion of Gary Alexander
Important Disclosures:
Although information in these reports has been obtained from and is based upon sources that Navellier believes to be reliable, Navellier does not guarantee its accuracy and it may be incomplete or condensed. All opinions and estimates constitute Navellier’s judgment as of the date the report was created and are subject to change without notice. These reports are for informational purposes only and are not a solicitation for the purchase or sale of a security. Any decision to purchase securities mentioned in these reports must take into account existing public information on such securities or any registered prospectus.To the extent permitted by law, neither Navellier & Associates, Inc., nor any of its affiliates, agents, or service providers assumes any liability or responsibility nor owes any duty of care for any consequences of any person acting or refraining to act in reliance on the information contained in this communication or for any decision based on it.
Past performance is no indication of future results. Investment in securities involves significant risk and has the potential for partial or complete loss of funds invested. It should not be assumed that any securities recommendations made by Navellier. in the future will be profitable or equal the performance of securities made in this report. Dividend payments are not guaranteed. The amount of a dividend payment, if any, can vary over time and issuers may reduce dividends paid on securities in the event of a recession or adverse event affecting a specific industry or issuer.
None of the stock information, data, and company information presented herein constitutes a recommendation by Navellier or a solicitation to buy or sell any securities. Any specific securities identified and described do not represent all of the securities purchased, sold, or recommended for advisory clients. The holdings identified do not represent all of the securities purchased, sold, or recommended for advisory clients and the reader should not assume that investments in the securities identified and discussed were or will be profitable.
Information presented is general information that does not take into account your individual circumstances, financial situation, or needs, nor does it present a personalized recommendation to you. Individual stocks presented may not be suitable for every investor. Investment in securities involves significant risk and has the potential for partial or complete loss of funds invested. Investment in fixed income securities has the potential for the investment return and principal value of an investment to fluctuate so that an investor’s holdings, when redeemed, may be worth less than their original cost.
One cannot invest directly in an index. Index is unmanaged and index performance does not reflect deduction of fees, expenses, or taxes. Presentation of Index data does not reflect a belief by Navellier that any stock index constitutes an investment alternative to any Navellier equity strategy or is necessarily comparable to such strategies. Among the most important differences between the Indices and Navellier strategies are that the Navellier equity strategies may (1) incur material management fees, (2) concentrate its investments in relatively few stocks, industries, or sectors, (3) have significantly greater trading activity and related costs, and (4) be significantly more or less volatile than the Indices.
ETF Risk: We may invest in exchange traded funds (“ETFs”) and some of our investment strategies are generally fully invested in ETFs. Like traditional mutual funds, ETFs charge asset-based fees, but they generally do not charge initial sales charges or redemption fees and investors typically pay only customary brokerage fees to buy and sell ETF shares. The fees and costs charged by ETFs held in client accounts will not be deducted from the compensation the client pays Navellier. ETF prices can fluctuate up or down, and a client account could lose money investing in an ETF if the prices of the securities owned by the ETF go down. ETFs are subject to additional risks:
- ETF shares may trade above or below their net asset value;
- An active trading market for an ETF’s shares may not develop or be maintained;
- The value of an ETF may be more volatile than the underlying portfolio of securities the ETF is designed to track;
- The cost of owning shares of the ETF may exceed those a client would incur by directly investing in the underlying securities; and
- Trading of an ETF’s shares may be halted if the listing exchange’s officials deem it appropriate, the shares are delisted from the exchange, or the activation of market-wide “circuit breakers” (which are tied to large decreases in stock prices) halts stock trading generally.
Grader Disclosures: Investment in equity strategies involves substantial risk and has the potential for partial or complete loss of funds invested. The sample portfolio and any accompanying charts are for informational purposes only and are not to be construed as a solicitation to buy or sell any financial instrument and should not be relied upon as the sole factor in an investment making decision. As a matter of normal and important disclosures to you, as a potential investor, please consider the following: The performance presented is not based on any actual securities trading, portfolio, or accounts, and the reported performance of the A, B, C, D, and F portfolios (collectively the “model portfolios”) should be considered mere “paper” or pro forma performance results based on Navellier’s research.
Investors evaluating any of Navellier & Associates, Inc.’s, (or its affiliates’) Investment Products must not use any information presented here, including the performance figures of the model portfolios, in their evaluation of any Navellier Investment Products. Navellier Investment Products include the firm’s mutual funds and managed accounts. The model portfolios, charts, and other information presented do not represent actual funded trades and are not actual funded portfolios. There are material differences between Navellier Investment Products’ portfolios and the model portfolios, research, and performance figures presented here. The model portfolios and the research results (1) may contain stocks or ETFs that are illiquid and difficult to trade; (2) may contain stock or ETF holdings materially different from actual funded Navellier Investment Product portfolios; (3) include the reinvestment of all dividends and other earnings, estimated trading costs, commissions, or management fees; and, (4) may not reflect prices obtained in an actual funded Navellier Investment Product portfolio. For these and other reasons, the reported performances of model portfolios do not reflect the performance results of Navellier’s actually funded and traded Investment Products. In most cases, Navellier’s Investment Products have materially lower performance results than the performances of the model portfolios presented.
This report contains statements that are, or may be considered to be, forward-looking statements. All statements that are not historical facts, including statements about our beliefs or expectations, are “forward-looking statements” within the meaning of The U.S. Private Securities Litigation Reform Act of 1995. These statements may be identified by such forward-looking terminology as “expect,” “estimate,” “plan,” “intend,” “believe,” “anticipate,” “may,” “will,” “should,” “could,” “continue,” “project,” or similar statements or variations of such terms. Our forward-looking statements are based on a series of expectations, assumptions, and projections, are not guarantees of future results or performance, and involve substantial risks and uncertainty as described in Form ADV Part 2A of our filing with the Securities and Exchange Commission (SEC), which is available at www.adviserinfo.sec.gov or by requesting a copy by emailing info@navellier.com. All of our forward-looking statements are as of the date of this report only. We can give no assurance that such expectations or forward-looking statements will prove to be correct. Actual results may differ materially. You are urged to carefully consider all such factors.
FEDERAL TAX ADVICE DISCLAIMER: As required by U.S. Treasury Regulations, you are informed that, to the extent this presentation includes any federal tax advice, the presentation is not written by Navellier to be used, and cannot be used, for the purpose of avoiding federal tax penalties. Navellier does not advise on any income tax requirements or issues. Use of any information presented by Navellier is for general information only and does not represent tax advice either express or implied. You are encouraged to seek professional tax advice for income tax questions and assistance.
IMPORTANT NEWSLETTER DISCLOSURE:The hypothetical performance results for investment newsletters that are authored or edited by Louis Navellier, including Louis Navellier’s Growth Investor, Louis Navellier’s Breakthrough Stocks, Louis Navellier’s Accelerated Profits, and Louis Navellier’s Platinum Club, are not based on any actual securities trading, portfolio, or accounts, and the newsletters’ reported hypothetical performances should be considered mere “paper” or proforma hypothetical performance results and are not actual performance of real world trades. Navellier & Associates, Inc. does not have any relation to or affiliation with the owner of these newsletters. There are material differences between Navellier Investment Products’ portfolios and the InvestorPlace Media, LLC newsletter portfolios authored by Louis Navellier. The InvestorPlace Media, LLC newsletters contain hypothetical performance that do not include transaction costs, advisory fees, or other fees a client might incur if actual investments and trades were being made by an investor. As a result, newsletter performance should not be used to evaluate Navellier Investment services which are separate and different from the newsletters. The owner of the newsletters is InvestorPlace Media, LLC and any questions concerning the newsletters, including any newsletter advertising or hypothetical Newsletter performance claims, (which are calculated solely by Investor Place Media and not Navellier) should be referred to InvestorPlace Media, LLC at (800) 718-8289.
Please note that Navellier & Associates and the Navellier Private Client Group are managed completely independent of the newsletters owned and published by InvestorPlace Media, LLC and written and edited by Louis Navellier, and investment performance of the newsletters should in no way be considered indicative of potential future investment performance for any Navellier & Associates separately managed account portfolio. Potential investors should consult with their financial advisor before investing in any Navellier Investment Product.
Navellier claims compliance with Global Investment Performance Standards (GIPS). To receive a complete list and descriptions of Navellier’s composites and/or a presentation that adheres to the GIPS standards, please contact Navellier or click here. It should not be assumed that any securities recommendations made by Navellier & Associates, Inc. in the future will be profitable or equal the performance of securities made in this report.
FactSet Disclosure: Navellier does not independently calculate the statistical information included in the attached report. The calculation and the information are provided by FactSet, a company not related to Navellier. Although information contained in the report has been obtained from FactSet and is based on sources Navellier believes to be reliable, Navellier does not guarantee its accuracy, and it may be incomplete or condensed. The report and the related FactSet sourced information are provided on an “as is” basis. The user assumes the entire risk of any use made of this information. Investors should consider the report as only a single factor in making their investment decision. The report is for informational purposes only and is not intended as an offer or solicitation for the purchase or sale of a security. FactSet sourced information is the exclusive property of FactSet. Without prior written permission of FactSet, this information may not be reproduced, disseminated or used to create any financial products. All indices are unmanaged and performance of the indices include reinvestment of dividends and interest income, unless otherwise noted, are not illustrative of any particular investment and an investment cannot be made in any index. Past performance is no guarantee of future results.