by Jason Bodner
October 1, 2024
Hurricane Helene just slammed into northwestern Florida as a powerful category 4. I hope everyone is OK. The forecasting was spot on, but weather forecasting accuracy decreases as the time-span increases:
- One-day forecasts are 96%-98% accurate
- 3-5-day forecasts are 90% accurate
- 7-day forecasts are in the 80% accuracy range
- 10-12-day forecasts are about 50-50.
Interestingly, we have a very accurate market forecasting tool for both near-term and a longer time range. The Big Money Index (BMI) is an elegant and simple measure of unusually large money flow trends that gives us a picture of future market direction. Since 90% of all daily stock volume comes from institutions, it pays to focus on when we can see from what we call “unusual” institutional buying or selling.
The BMI differs from other methods because the traditional measures use conventional metrics, such as overall volume, historical fund flows, and holdings disclosure filings such as 13D, 13F and 13G filings.
These are great ways to find out which huge investors own what securities, historically speaking. If you’re not familiar with these terms, here’s a quick breakdown on what those filings are:
- Schedule 13D (aka “beneficial ownership report”) is required for investors who acquire 5% or more of a voting class of a stock. It must be filed within 10-days of exceeding 5% ownership.
- Schedule 13G is like a 13D but this filing is required for any individual or group acquiring 5% or more of the voting rights of a stock. It also must be filed within 10-days of acquiring 5%+.
- Form 13F is a quarterly report filed by institutional investment managers with at least $100 million in assets detailing all of their long holdings in their portfolio. (Short positions are not required.) This is filed at the end of the quarter by up to 45-days after the end of the quarter.
You can see the problem with these money flow indicators: Using these metrics can be very stale. For example: In a prior trading life, I bought stock for large clients in small amounts over several weeks, intentionally staying under 5% ownership, only to rapidly accumulate stock in the final days to get to a larger stake. Then the investment manager just waited 10-days to disclose it, within the legal allotment.
By that point, the stock had already risen massively.
Also, the 45-day lag time for quarterly ownership positions is way too long for any value to investors.
My research method sidesteps all that delay and measures unusually larger money flows daily on roughly 6,000 stocks. We then accumulate a 25-day moving average of each day’s unusual buying and selling signals on those stocks (usually about 100 signals each day) and generate the BMI.
What are these signals? Put simply, each of the roughly 6,000 stocks that my research firm tracks each day, has an expected “bubble,” which includes average price range (volatility), volume, and direction. When trading occurs outside this bubble, it’s “unusual.” When stocks trade within the normal price range but exceed average volume, it gets an amber bar (left chart). Taking it further, when stocks break out of the bubble while violating volume, it gets a green bar, while stocks breaking down get red bars (right).
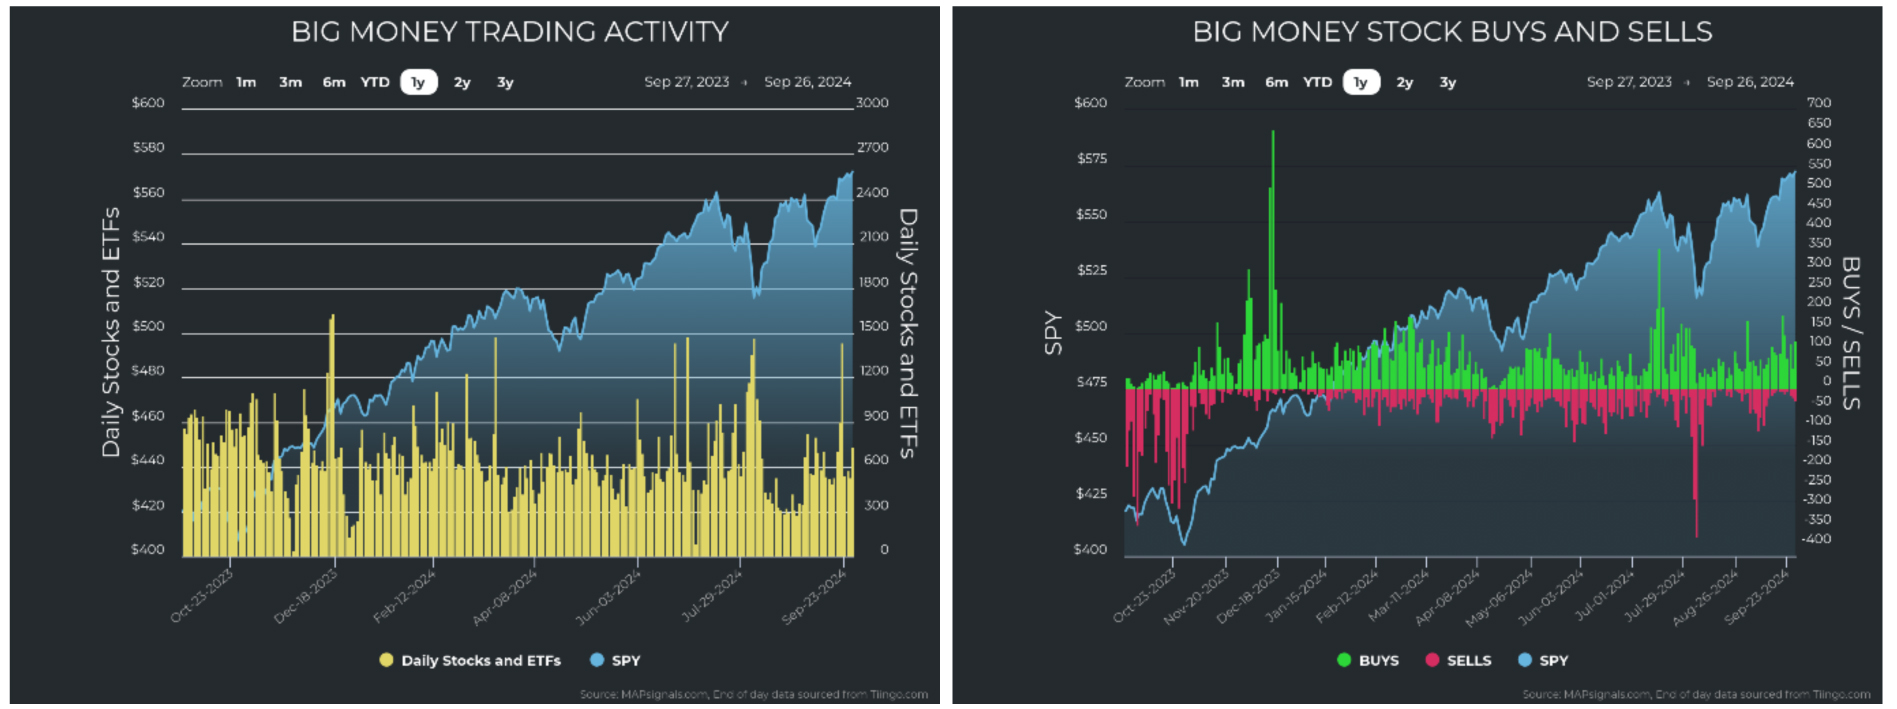
Graphs are for illustrative and discussion purposes only. Please read important disclosures at the end of this commentary.
If you smooth those signals out over 25-days, you get the BMI. Here’s what it is telling us today: Money flows have returned to the market in a big way. The latest BMI uptrend started in mid-July:
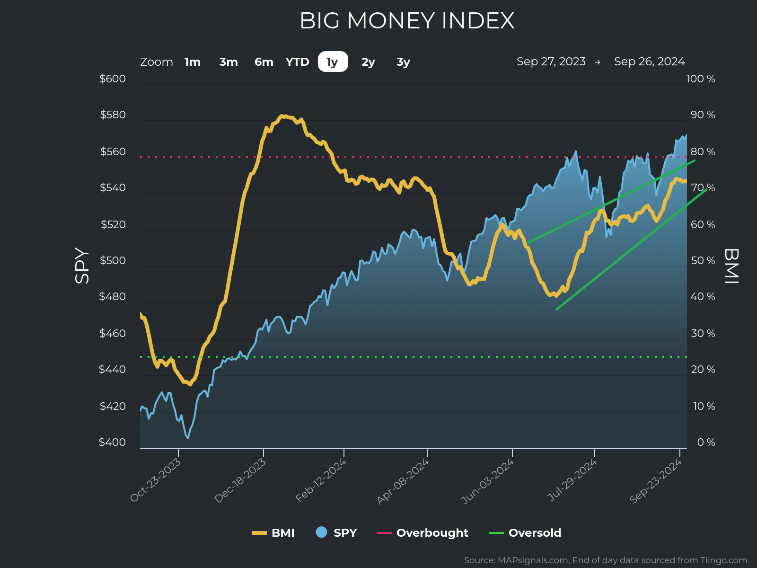
Graphs are for illustrative and discussion purposes only. Please read important disclosures at the end of this commentary.
We’ve seen a volatile few months, but the Dow and S&P 500 are hitting fresh highs again. The weight of high interest rates is starting to lift with the Fed’s sweeping 50-basis point cut on September 18th.
Here, we see September 18th marked as a clear line in the sand. In this chart, we can see that since Fed Chair Powell gave us what we wanted, money has been gushing into small and mid-cap stocks:
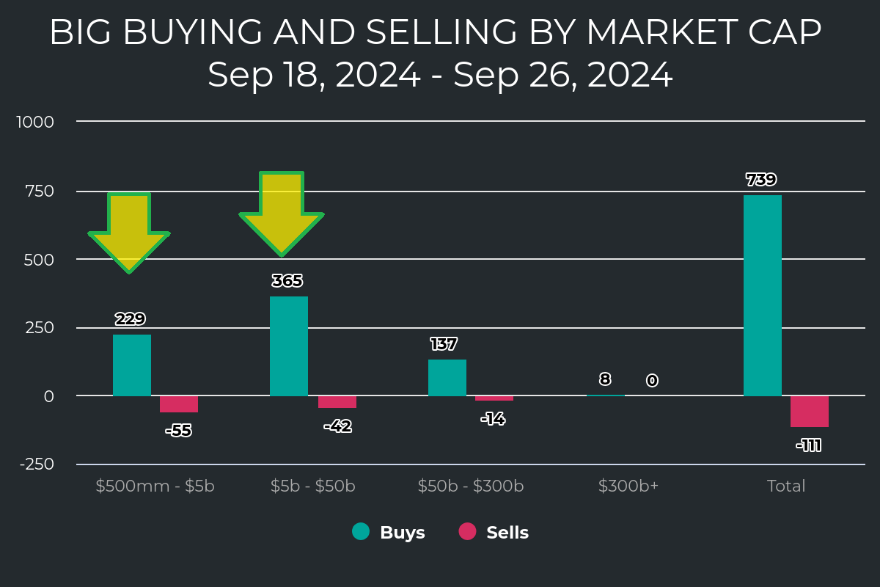
Graphs are for illustrative and discussion purposes only. Please read important disclosures at the end of this commentary.
What’s more fascinating is that money is flowing into virtually every sector. Of the 11 S&P 500 sectors, nine have made new six-month highs recently. You can see that with the yellow circles below.
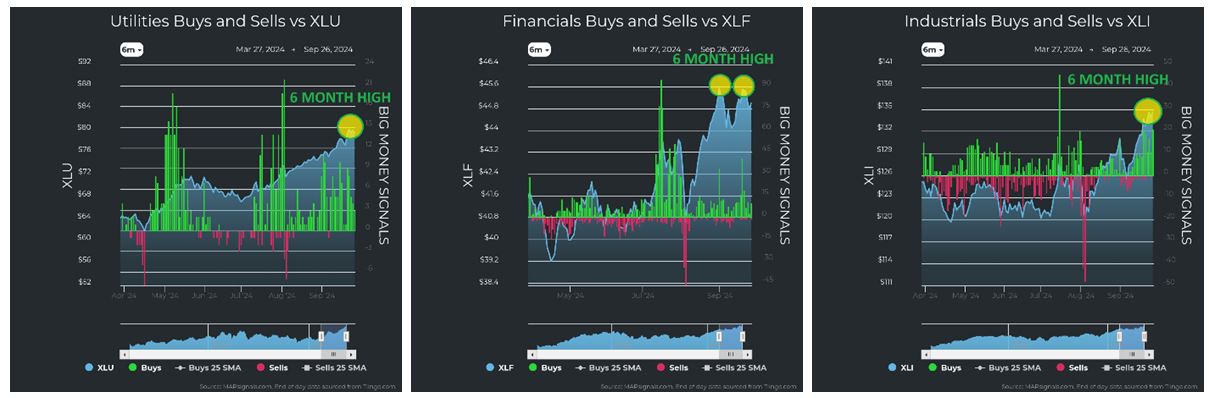
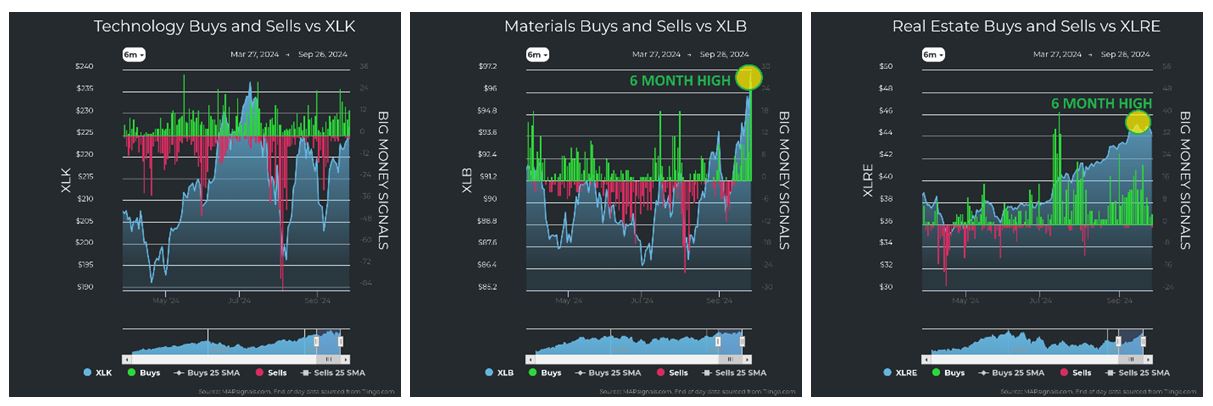
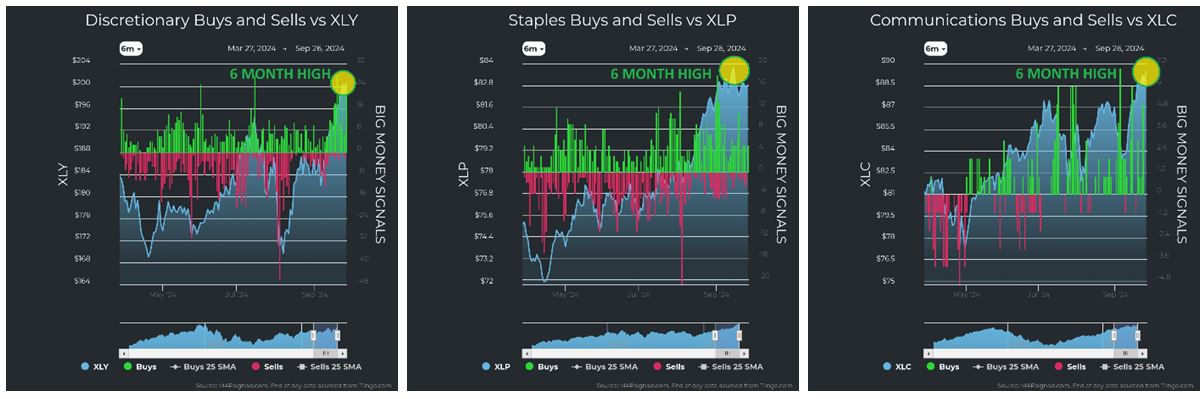
The only two notable exceptions are Technology and Energy.
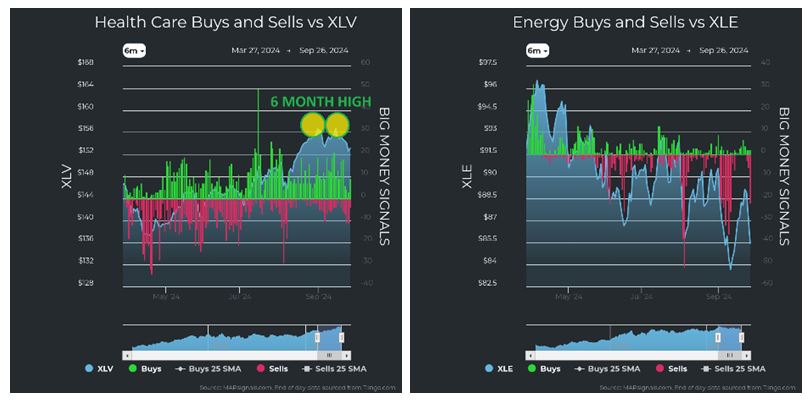
Graphs are for illustrative and discussion purposes only. Please read important disclosures at the end of this commentary.
Technology, however, is trying to rally towards its six-month highs, bolstered by the semiconductors industry, rising fast. The VanEck Semiconductor ETF (SMH) is up roughly 17.5% since its recent low on September 6th.
Energy continues to lag, largely as a function of crude oil’s continued price slide:
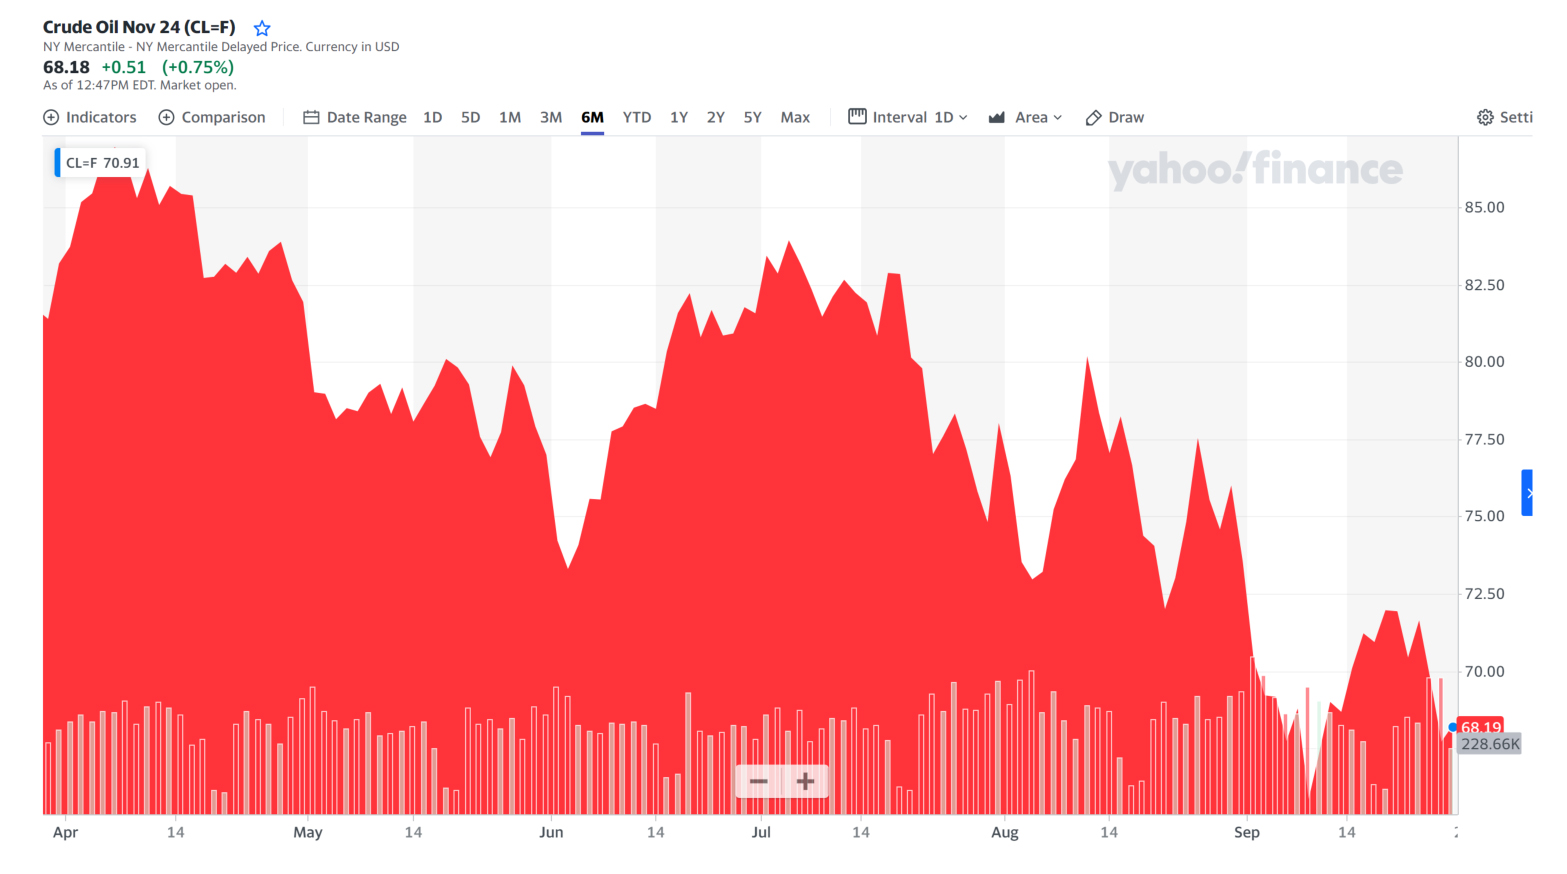
Graphs are for illustrative and discussion purposes only. Please read important disclosures at the end of this commentary.
The interesting thing is that the BMI wraps up all this information into a single money-flow indicator.
That said, all the above can seem overwhelming, so, I wondered, is there a super-easy thumb in the wind guide for the BMI? I asked the question this way: What happens when the BMI is over 50 or under 50?
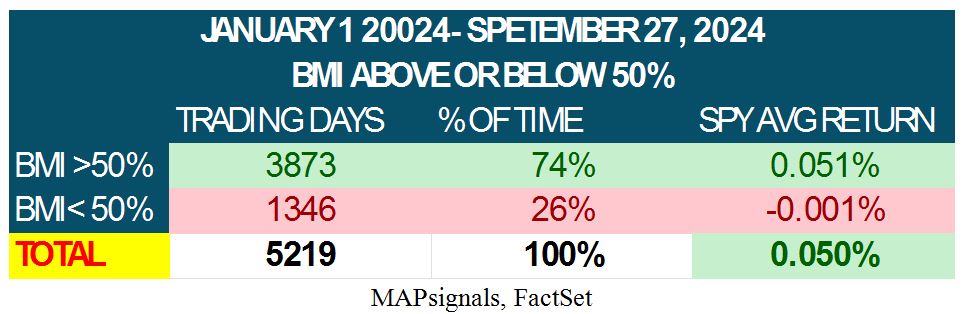
Why 50%? Because when the BMI is above 50%, it means that unusual buying made up more than half the signals over the past 25-days – meaning the buyers were in control. This makes the results simple and easy to grasp. I decided to quickly look at the past 20-years of data. Since 2004, this is what I found…
That 20-year span encompassed 5,219 trading days. The BMI was above 50% for 74.2% of that time, or 3,873 trading days. Logically, the BMI was below 50% (sellers in control) only 25.8% of the time (1,346-days). The average return of the SPY (S&P 500 tracking ETF) when the BMI was above 50% was +0.051%. The average return of SPY with the BMI below 50% was -0.001%. Here’s the summary:
Graphs are for illustrative and discussion purposes only. Please read important disclosures at the end of this commentary.
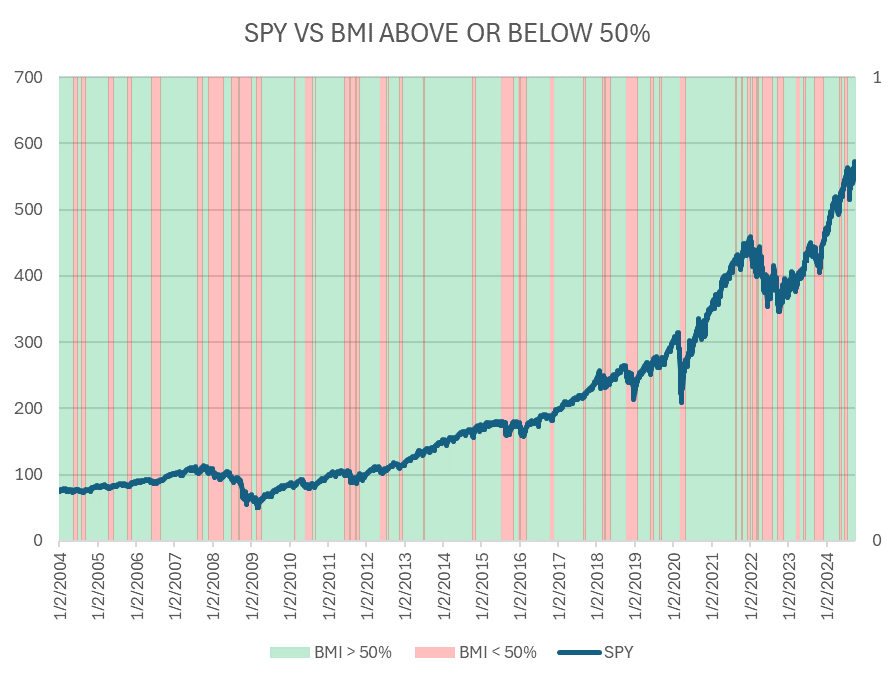
This means that, based on the past 20-years, as long as the BMI is above 50%, we can expect higher stock prices on average. This really gets hammered home once we visualize this trend in another way. Below, I have mapped the days the BMI was above 50% in green, and days where it was below 50% in red.
Four points pop out pretty clearly:
- Green periods line up with periods of market strength.
- Red periods line up with periods of market weakness.
- Currently, we are in a green period, meaning market strength.
- We are not in a red period, so I don’t anticipate market weakness.
Graphs are for illustrative and discussion purposes only. Please read important disclosures at the end of this commentary.
Despite a tight election and expected volatility, the market strength is gaining momentum on the latest Fed cuts. This should continue with fourth quarter seasonal strength.
Hunter S. Thompson said it best: “Buy the ticket. Take the ride.”
All content above represents the opinion of Jason Bodner of Navellier & Associates, Inc.
Also In This Issue
A Look Ahead by Louis Navellier
America’s Global Advantage Will Likely Continue – No Matter Who Wins in November
Income Mail by Bryan Perry
This Port Strike Pits Longshoremen Against AI
Growth Mail by Gary Alexander
Welcome to Fiscal Year 2025 – Time to Cut Spending!
Global Mail by Ivan Martchev
Investors are Treating New Market Highs with Disbelief
Sector Spotlight by Jason Bodner
Forecasting Market Trends Faster than the Normal Filings Disclose
View Full Archive
Read Past Issues Here

Jason Bodner
MARKETMAIL EDITOR FOR SECTOR SPOTLIGHT
Jason Bodner writes Sector Spotlight in the weekly Marketmail publication and has authored several white papers for the company. He is also Co-Founder of Macro Analytics for Professionals which produces proprietary equity accumulation/distribution research for its clients. Previously, Mr. Bodner served as Director of European Equity Derivatives for Cantor Fitzgerald Europe in London, then moved to the role of Head of Equity Derivatives North America for the same company in New York. He also served as S.V.P. Equity Derivatives for Jefferies, LLC. He received a B.S. in business administration in 1996, with honors, from Skidmore College as a member of the Periclean Honors Society. All content of “Sector Spotlight” represents the opinion of Jason Bodner
Important Disclosures:
Jason Bodner is a co-founder and co-owner of Mapsignals. Mr. Bodner is an independent contractor who is occasionally hired by Navellier & Associates to write an article and or provide opinions for possible use in articles that appear in Navellier & Associates weekly Market Mail. Mr. Bodner is not employed or affiliated with Louis Navellier, Navellier & Associates, Inc., or any other Navellier owned entity. The opinions and statements made here are those of Mr. Bodner and not necessarily those of any other persons or entities. This is not an endorsement, or solicitation or testimonial or investment advice regarding the BMI Index or any statements or recommendations or analysis in the article or the BMI Index or Mapsignals or its products or strategies.
Although information in these reports has been obtained from and is based upon sources that Navellier believes to be reliable, Navellier does not guarantee its accuracy and it may be incomplete or condensed. All opinions and estimates constitute Navellier’s judgment as of the date the report was created and are subject to change without notice. These reports are for informational purposes only and are not a solicitation for the purchase or sale of a security. Any decision to purchase securities mentioned in these reports must take into account existing public information on such securities or any registered prospectus.To the extent permitted by law, neither Navellier & Associates, Inc., nor any of its affiliates, agents, or service providers assumes any liability or responsibility nor owes any duty of care for any consequences of any person acting or refraining to act in reliance on the information contained in this communication or for any decision based on it.
Past performance is no indication of future results. Investment in securities involves significant risk and has the potential for partial or complete loss of funds invested. It should not be assumed that any securities recommendations made by Navellier. in the future will be profitable or equal the performance of securities made in this report. Dividend payments are not guaranteed. The amount of a dividend payment, if any, can vary over time and issuers may reduce dividends paid on securities in the event of a recession or adverse event affecting a specific industry or issuer.
None of the stock information, data, and company information presented herein constitutes a recommendation by Navellier or a solicitation to buy or sell any securities. Any specific securities identified and described do not represent all of the securities purchased, sold, or recommended for advisory clients. The holdings identified do not represent all of the securities purchased, sold, or recommended for advisory clients and the reader should not assume that investments in the securities identified and discussed were or will be profitable.
Information presented is general information that does not take into account your individual circumstances, financial situation, or needs, nor does it present a personalized recommendation to you. Individual stocks presented may not be suitable for every investor. Investment in securities involves significant risk and has the potential for partial or complete loss of funds invested. Investment in fixed income securities has the potential for the investment return and principal value of an investment to fluctuate so that an investor’s holdings, when redeemed, may be worth less than their original cost.
One cannot invest directly in an index. Index is unmanaged and index performance does not reflect deduction of fees, expenses, or taxes. Presentation of Index data does not reflect a belief by Navellier that any stock index constitutes an investment alternative to any Navellier equity strategy or is necessarily comparable to such strategies. Among the most important differences between the Indices and Navellier strategies are that the Navellier equity strategies may (1) incur material management fees, (2) concentrate its investments in relatively few stocks, industries, or sectors, (3) have significantly greater trading activity and related costs, and (4) be significantly more or less volatile than the Indices.
ETF Risk: We may invest in exchange traded funds (“ETFs”) and some of our investment strategies are generally fully invested in ETFs. Like traditional mutual funds, ETFs charge asset-based fees, but they generally do not charge initial sales charges or redemption fees and investors typically pay only customary brokerage fees to buy and sell ETF shares. The fees and costs charged by ETFs held in client accounts will not be deducted from the compensation the client pays Navellier. ETF prices can fluctuate up or down, and a client account could lose money investing in an ETF if the prices of the securities owned by the ETF go down. ETFs are subject to additional risks:
- ETF shares may trade above or below their net asset value;
- An active trading market for an ETF’s shares may not develop or be maintained;
- The value of an ETF may be more volatile than the underlying portfolio of securities the ETF is designed to track;
- The cost of owning shares of the ETF may exceed those a client would incur by directly investing in the underlying securities; and
- Trading of an ETF’s shares may be halted if the listing exchange’s officials deem it appropriate, the shares are delisted from the exchange, or the activation of market-wide “circuit breakers” (which are tied to large decreases in stock prices) halts stock trading generally.
Grader Disclosures: Investment in equity strategies involves substantial risk and has the potential for partial or complete loss of funds invested. The sample portfolio and any accompanying charts are for informational purposes only and are not to be construed as a solicitation to buy or sell any financial instrument and should not be relied upon as the sole factor in an investment making decision. As a matter of normal and important disclosures to you, as a potential investor, please consider the following: The performance presented is not based on any actual securities trading, portfolio, or accounts, and the reported performance of the A, B, C, D, and F portfolios (collectively the “model portfolios”) should be considered mere “paper” or pro forma performance results based on Navellier’s research.
Investors evaluating any of Navellier & Associates, Inc.’s, (or its affiliates’) Investment Products must not use any information presented here, including the performance figures of the model portfolios, in their evaluation of any Navellier Investment Products. Navellier Investment Products include the firm’s mutual funds and managed accounts. The model portfolios, charts, and other information presented do not represent actual funded trades and are not actual funded portfolios. There are material differences between Navellier Investment Products’ portfolios and the model portfolios, research, and performance figures presented here. The model portfolios and the research results (1) may contain stocks or ETFs that are illiquid and difficult to trade; (2) may contain stock or ETF holdings materially different from actual funded Navellier Investment Product portfolios; (3) include the reinvestment of all dividends and other earnings, estimated trading costs, commissions, or management fees; and, (4) may not reflect prices obtained in an actual funded Navellier Investment Product portfolio. For these and other reasons, the reported performances of model portfolios do not reflect the performance results of Navellier’s actually funded and traded Investment Products. In most cases, Navellier’s Investment Products have materially lower performance results than the performances of the model portfolios presented.
This report contains statements that are, or may be considered to be, forward-looking statements. All statements that are not historical facts, including statements about our beliefs or expectations, are “forward-looking statements” within the meaning of The U.S. Private Securities Litigation Reform Act of 1995. These statements may be identified by such forward-looking terminology as “expect,” “estimate,” “plan,” “intend,” “believe,” “anticipate,” “may,” “will,” “should,” “could,” “continue,” “project,” or similar statements or variations of such terms. Our forward-looking statements are based on a series of expectations, assumptions, and projections, are not guarantees of future results or performance, and involve substantial risks and uncertainty as described in Form ADV Part 2A of our filing with the Securities and Exchange Commission (SEC), which is available at www.adviserinfo.sec.gov or by requesting a copy by emailing info@navellier.com. All of our forward-looking statements are as of the date of this report only. We can give no assurance that such expectations or forward-looking statements will prove to be correct. Actual results may differ materially. You are urged to carefully consider all such factors.
FEDERAL TAX ADVICE DISCLAIMER: As required by U.S. Treasury Regulations, you are informed that, to the extent this presentation includes any federal tax advice, the presentation is not written by Navellier to be used, and cannot be used, for the purpose of avoiding federal tax penalties. Navellier does not advise on any income tax requirements or issues. Use of any information presented by Navellier is for general information only and does not represent tax advice either express or implied. You are encouraged to seek professional tax advice for income tax questions and assistance.
IMPORTANT NEWSLETTER DISCLOSURE:The hypothetical performance results for investment newsletters that are authored or edited by Louis Navellier, including Louis Navellier’s Growth Investor, Louis Navellier’s Breakthrough Stocks, Louis Navellier’s Accelerated Profits, and Louis Navellier’s Platinum Club, are not based on any actual securities trading, portfolio, or accounts, and the newsletters’ reported hypothetical performances should be considered mere “paper” or proforma hypothetical performance results and are not actual performance of real world trades. Navellier & Associates, Inc. does not have any relation to or affiliation with the owner of these newsletters. There are material differences between Navellier Investment Products’ portfolios and the InvestorPlace Media, LLC newsletter portfolios authored by Louis Navellier. The InvestorPlace Media, LLC newsletters contain hypothetical performance that do not include transaction costs, advisory fees, or other fees a client might incur if actual investments and trades were being made by an investor. As a result, newsletter performance should not be used to evaluate Navellier Investment services which are separate and different from the newsletters. The owner of the newsletters is InvestorPlace Media, LLC and any questions concerning the newsletters, including any newsletter advertising or hypothetical Newsletter performance claims, (which are calculated solely by Investor Place Media and not Navellier) should be referred to InvestorPlace Media, LLC at (800) 718-8289.
Please note that Navellier & Associates and the Navellier Private Client Group are managed completely independent of the newsletters owned and published by InvestorPlace Media, LLC and written and edited by Louis Navellier, and investment performance of the newsletters should in no way be considered indicative of potential future investment performance for any Navellier & Associates separately managed account portfolio. Potential investors should consult with their financial advisor before investing in any Navellier Investment Product.
Navellier claims compliance with Global Investment Performance Standards (GIPS). To receive a complete list and descriptions of Navellier’s composites and/or a presentation that adheres to the GIPS standards, please contact Navellier or click here. It should not be assumed that any securities recommendations made by Navellier & Associates, Inc. in the future will be profitable or equal the performance of securities made in this report.
FactSet Disclosure: Navellier does not independently calculate the statistical information included in the attached report. The calculation and the information are provided by FactSet, a company not related to Navellier. Although information contained in the report has been obtained from FactSet and is based on sources Navellier believes to be reliable, Navellier does not guarantee its accuracy, and it may be incomplete or condensed. The report and the related FactSet sourced information are provided on an “as is” basis. The user assumes the entire risk of any use made of this information. Investors should consider the report as only a single factor in making their investment decision. The report is for informational purposes only and is not intended as an offer or solicitation for the purchase or sale of a security. FactSet sourced information is the exclusive property of FactSet. Without prior written permission of FactSet, this information may not be reproduced, disseminated or used to create any financial products. All indices are unmanaged and performance of the indices include reinvestment of dividends and interest income, unless otherwise noted, are not illustrative of any particular investment and an investment cannot be made in any index. Past performance is no guarantee of future results.