by Jason Bodner
January 6, 2026
Ancient civilizations never fully agreed on when a year should begin. The Romans started the year in March, aligning time with planting seasons and military campaigns. The Mayans tracked overlapping cycles rather than linear-years. Even the Gregorian calendar, which governs modern life, was not universally adopted for centuries after its creation. New Year’s Day, as we know it, is an arbitrary marker.
Even the concept of BC and AD came over 500-years. “AD” (AD is now called CE, or “Common Era”).
However, you count a new year, it is just one more sunset followed by one more sunrise in a chain that has repeated itself for roughly 4.5-billion years on this particular planet, yet perception matters. We attach meaning to the January turn of the calendar. We make resolutions, join gyms, change habits (for a few days or weeks) and declare a fresh start. The date itself may be artificial, but our mental reset seems real.
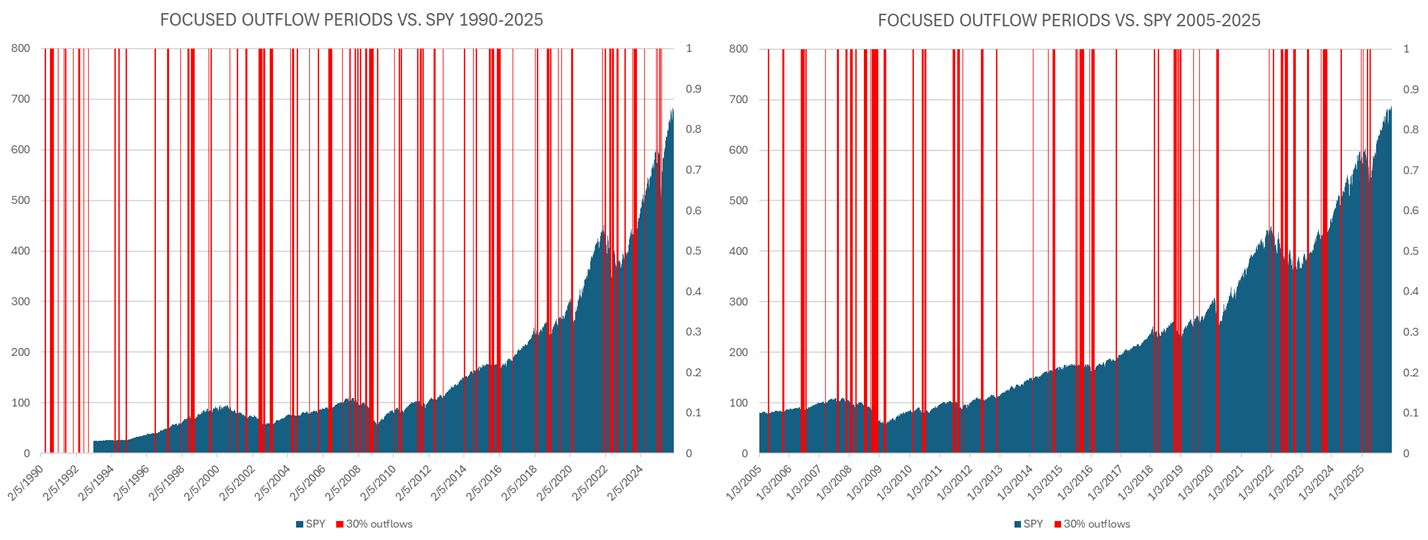
Since we live by the modern calendar, it makes sense to pause and review how last year actually unfolded. Looking back at flows across stocks and ETFs, 2025 was a remarkably typical year when viewed through a long-term lens. Since January 1st, 1990, there have been 455,352 unusually large inflow signals compared to 336,515 unusually large outflow signals. That means 57.5-percent of all signals over the past 36-years have been inflows. This imbalance explains why equity markets tend to rise over time.
Using SPY (the S&P 500 ETF) as a proxy, it began trading on January 29th, 1993. Since then, SPY has risen roughly 27 out of 36-years (75%). The market’s natural state is not balance: It is accumulation.
Removing extreme selling periods makes this even clearer. I calculated the ratio of inflows to outflows on a rolling 10-day basis and excluded all periods where fewer than 40% of signals were inflows. Out of 9,041 observed trading-days, removing those heavy selling windows left 7,478-days. That means roughly 83% of the past 36-years were not periods of intense outflows. The remaining 17% of the time accounts for a disproportionate share of selling pressure. Notice how the red aligns with local market troughs:
Graphs are for illustrative and discussion purposes only. Please read important disclosures at the end of this commentary.
Those brief windows explain the fear investors remember. Periods where 10-day inflows dropped below 40% accounted for 57% of all outflows since 1990. Narrow the threshold further to 30% inflows or less, and those periods alone account for 30% of all outflows. In other words, about 10% of all trading days are responsible for nearly one-third of all selling activity. Heavy outflows are not constant. They are concentrated, emotional, and short-lived. This rhythm has persisted for decades.
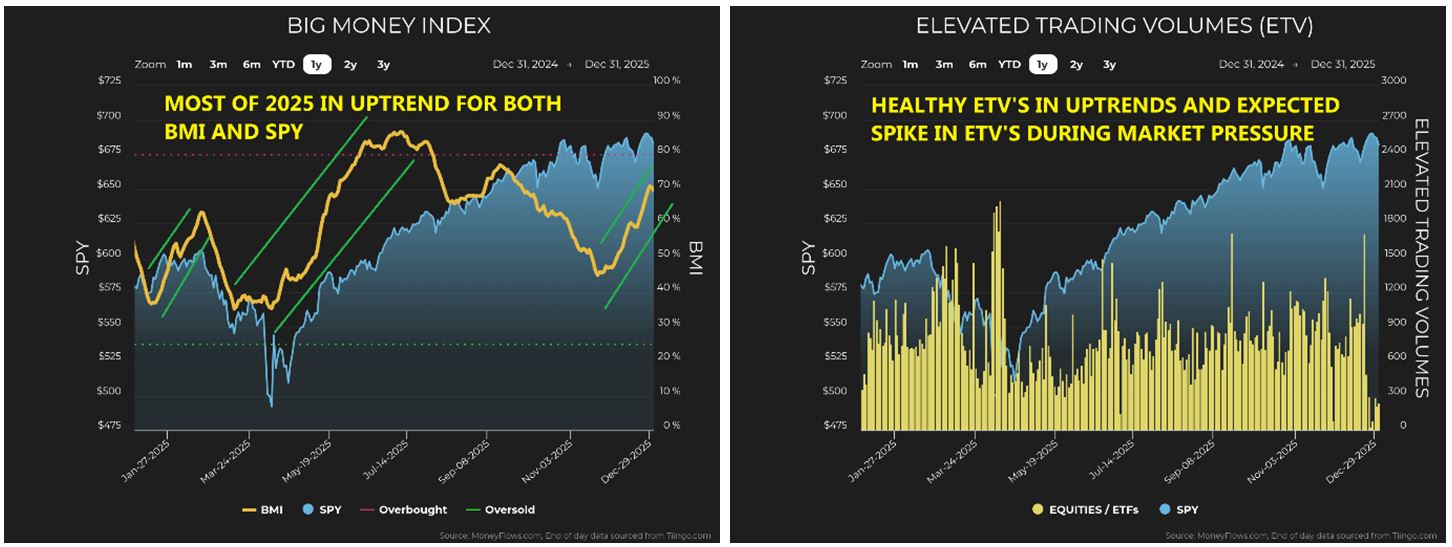
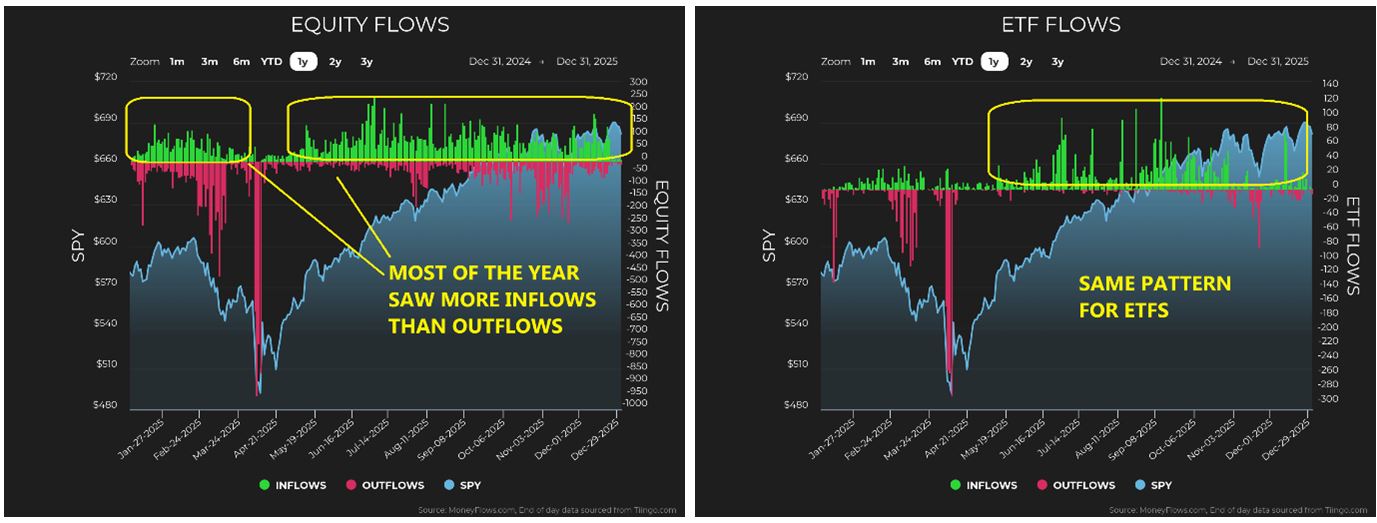
The past year followed the same script. In 2025, 10-day periods with inflows below 30% accounted for roughly 20% of the year’s total outflows. The timing was familiar. February, April, and November were primary stress points. Fear arrived in clusters, while confident buying unfolded slowly and persistently. That asymmetry explains why markets tend to grind higher, then fall sharply. It is behavioral, not random.
Graphs are for illustrative and discussion purposes only. Please read important disclosures at the end of this commentary.
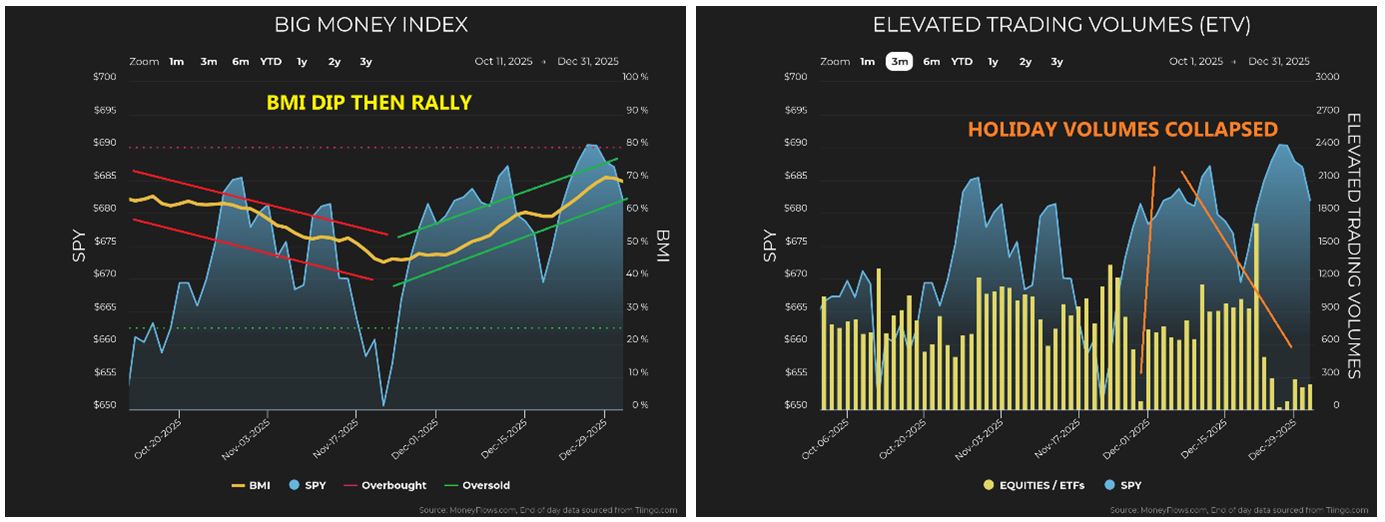
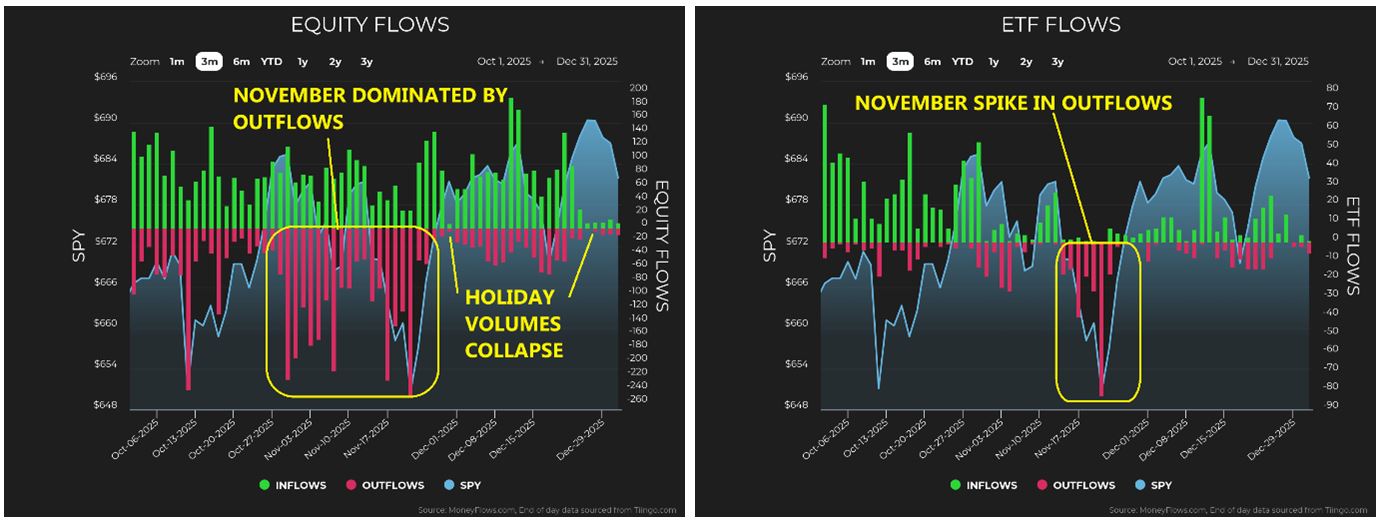
Zooming in on the fourth-quarter reinforces the pattern. Outflows dominated November, pressuring both stocks and ETFs, before abruptly giving way to inflows. This shift pushed the Big Money Index lower and then lifted it just as quickly. Elevated Trading Volumes confirm what we expect around holidays.
Activity fell sharply during Thanksgiving and Christmas weeks as sessions shortened and participation thinned. Price action during those windows matters less than what happens before and after them.
Graphs are for illustrative and discussion purposes only. Please read important disclosures at the end of this commentary.
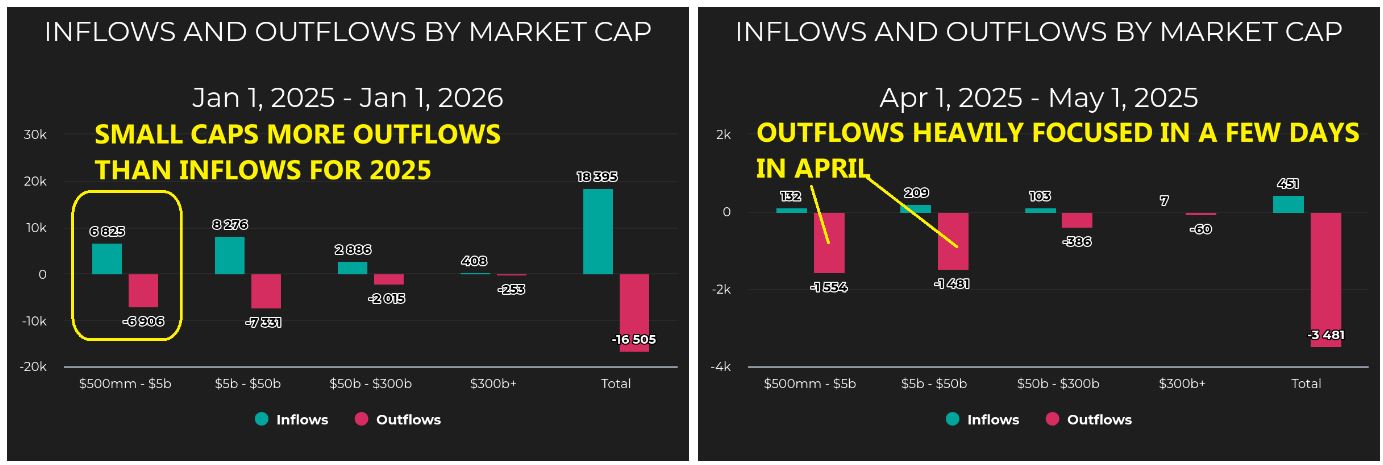
Looking at flows by company size adds another layer of insight. At first glance, 2025 seemed balanced across market capitalization. In reality, nearly 20% of the year’s total outflows occurred in just a handful of days in April. Calm trends dominated most of the year, while fear compressed into narrow windows.
Graphs are for illustrative and discussion purposes only. Please read important disclosures at the end of this commentary.
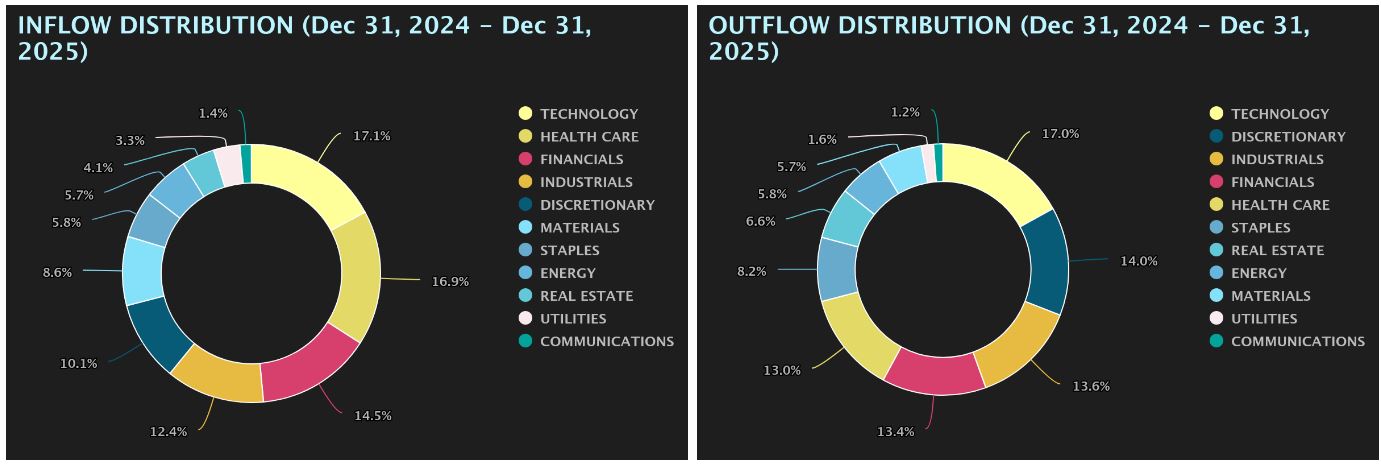
Sector flows tell a similar story. When fear hits, outflows strike the growth sectors hardest. Technology, Discretionary, Industrials, and Financials absorbed the bulk of selling pressure. Yet those same sectors also led on the inflow side once panic subsided. For the full year, top outflow sectors were Technology, Discretionary, Industrials, and Financials. Paradoxically, the top inflow sectors were Technology, Health Care, Industrials, and Financials. Markets rise gradually and fall violently. The data reflects that reality.
Graphs are for illustrative and discussion purposes only. Please read important disclosures at the end of this commentary.
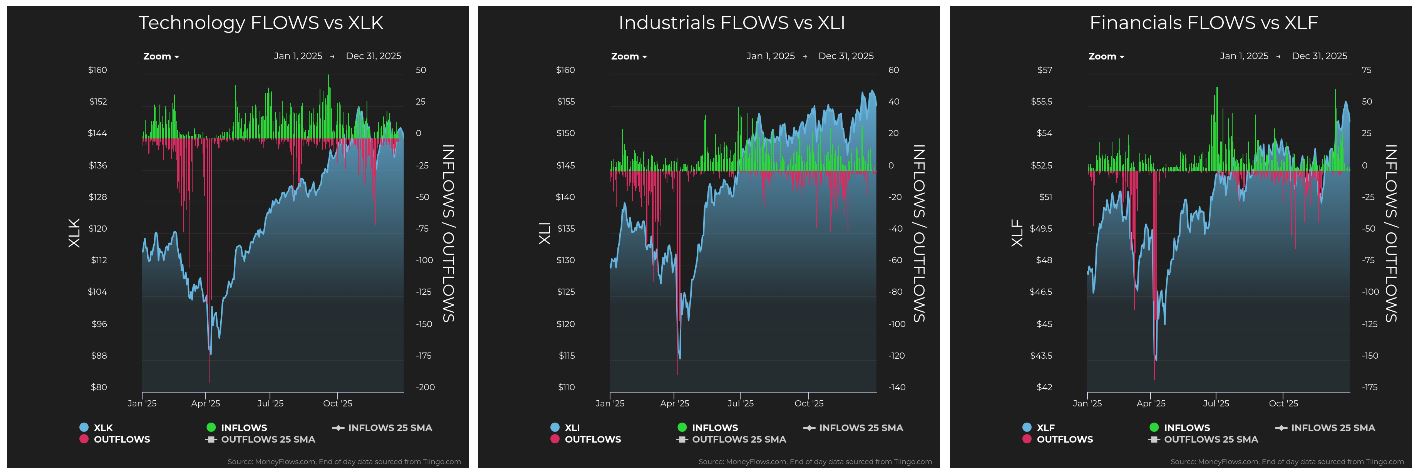
Despite episodes of elevated volatility, 2025 showed healthy underlying progress. Sustained bull-markets are defined by capital flowing into risk-oriented sectors rather than hiding in defensive corners. Technology, Industrials, Financials, Health Care and Discretionary all showed steady up-trends paired with net inflows. Defensive sectors like Utilities, Staples, and Real Estate, lagged. Utilities benefited from enthusiasm around the AI rage, but once that narrative cooled, outflows returned and performance normalized.
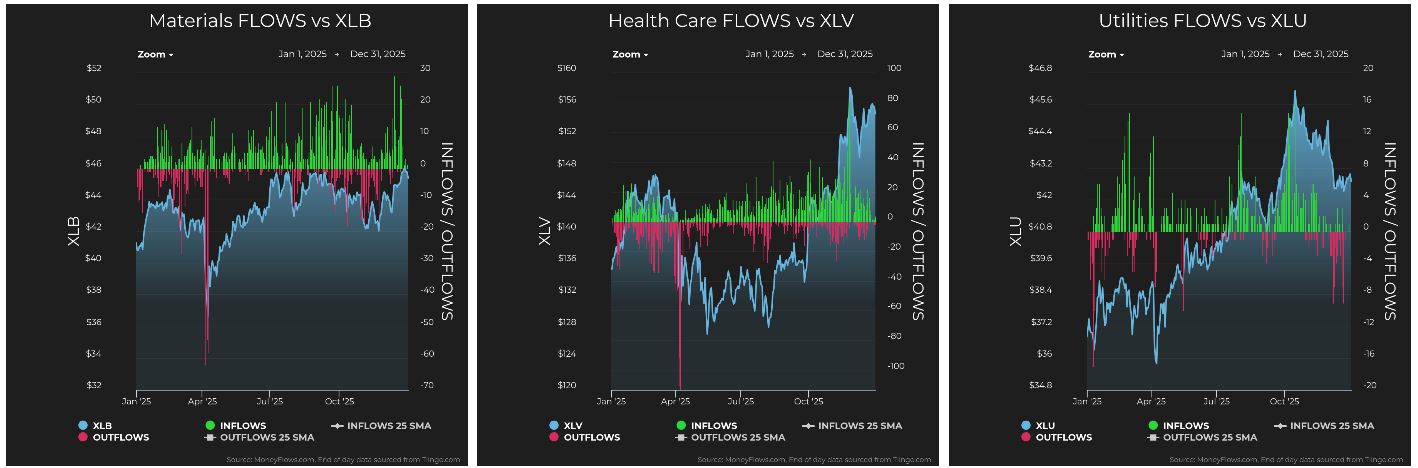
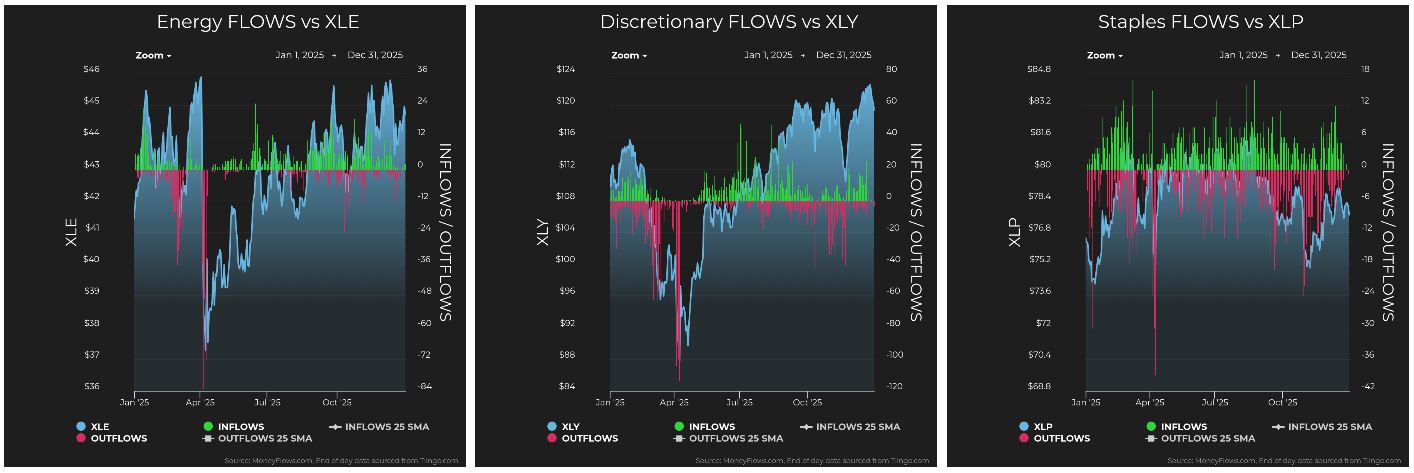
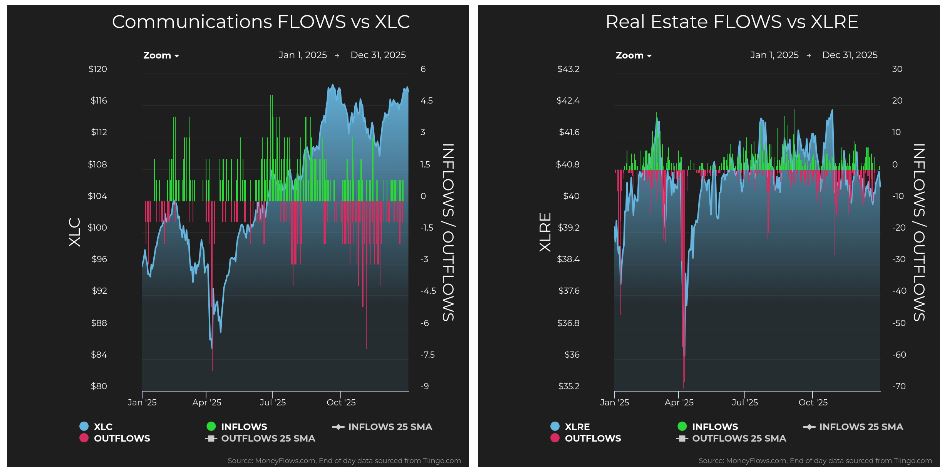
Graphs are for illustrative and discussion purposes only. Please read important disclosures at the end of this commentary.
Looking ahead to 2026, the balance of evidence still favors market tail-winds over head-winds. Interest rates are moving lower as the cutting cycle begins. Lower rates reduce the cost of financing growth and support higher valuations. Taxes are also lower, improving corporate margins even without revenue expansion. These forces alone provide a meaningful boost to bottom lines.
Importantly, margins are not improving in isolation. Revenues and earnings are expanding as well. The past year delivered one of the strongest earnings growth environments in recent memory:
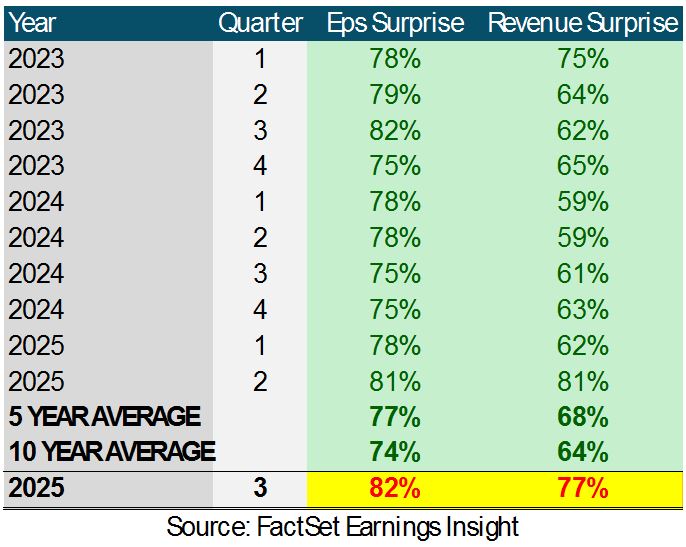
Graphs are for illustrative and discussion purposes only. Please read important disclosures at the end of this commentary.
That combination of improving fundamentals and supportive macro-conditions is difficult to ignore. The primary risks lie outside normal market mechanics. Geopolitical events remain unpredictable and uncontrollable. Conflicts in eastern Europe and the Middle East continue to evolve unevenly, yet markets have absorbed these shocks and moved forward. Another potential head-wind is the mid-term election cycle. Markets dislike uncertainty, and political rhetoric inevitably intensifies as campaigns heat up. If outcomes remain unclear heading into November, volatility is likely to rise. History shows, however, that the fourth-quarter of mid-term years is typically one of the strongest periods in the market cycle.
Calendars may be human inventions, but cycles of fear and confidence are part of human nature. Flow data reminds us that markets spend most of their time accumulating, interrupted occasionally by sharp but brief emotional resets. Understanding that difference is the key to navigating uncertainty with discipline.
As Epictetus observed, “It is not events that disturb people, but their judgments about them.”
All content above represents the opinion of Jason Bodner of Navellier & Associates, Inc.
Also In This Issue
A Look Ahead by Louis Navellier
Lower Threats of Prolonged Wars Will Be Bullish for the Stock Market
Income Mail by Bryan Perry
Identifying the “Pain Trade” for Early 2026
Growth Mail by Gary Alexander
The First Quarter of the 21st Century – in Review
Global Mail by Ivan Martchev
Talking Markets with ChatGPT
Sector Spotlight by Jason Bodner
When Should a New Year Start – and Does it Matter?
View Full Archive
Read Past Issues Here

Jason Bodner
MARKETMAIL EDITOR FOR SECTOR SPOTLIGHT
Jason Bodner writes Sector Spotlight in the weekly Marketmail publication and has authored several white papers for the company. He is also Co-Founder of Macro Analytics for Professionals which produces proprietary equity accumulation and distribution research for its clients. Previously, Mr. Bodner served as Director of European Equity Derivatives for Cantor Fitzgerald Europe in London, then moved to the role of Head of Equity Derivatives North America for the same company in New York. He also served as S.V.P. Equity Derivatives for Jefferies, LLC. He received a B.S. in business administration in 1996, with honors, from Skidmore College as a member of the Periclean Honors Society. All content of “Sector Spotlight” represents the opinion of Jason Bodner
Important Disclosures:
Jason Bodner is a co-founder and co-owner of Mapsignals. Mr. Bodner is an independent contractor who is occasionally hired by Navellier & Associates to write an article and or provide opinions for possible use in articles that appear in Navellier & Associates weekly Market Mail. Mr. Bodner is not employed or affiliated with Louis Navellier, Navellier & Associates, Inc., or any other Navellier owned entity. The opinions and statements made here are those of Mr. Bodner and not necessarily those of any other persons or entities. This is not an endorsement, or solicitation or testimonial or investment advice regarding the BMI Index or any statements or recommendations or analysis in the article or the BMI Index or Mapsignals or its products or strategies.
Although information in these reports has been obtained from and is based upon sources that Navellier believes to be reliable, Navellier does not guarantee its accuracy and it may be incomplete or condensed. All opinions and estimates constitute Navellier’s judgment as of the date the report was created and are subject to change without notice. These reports are for informational purposes only and are not a solicitation for the purchase or sale of a security. Any decision to purchase securities mentioned in these reports must take into account existing public information on such securities or any registered prospectus.To the extent permitted by law, neither Navellier & Associates, Inc., nor any of its affiliates, agents, or service providers assumes any liability or responsibility nor owes any duty of care for any consequences of any person acting or refraining to act in reliance on the information contained in this communication or for any decision based on it.
Past performance is no indication of future results. Investment in securities involves significant risk and has the potential for partial or complete loss of funds invested. It should not be assumed that any securities recommendations made by Navellier. in the future will be profitable or equal the performance of securities made in this report. Dividend payments are not guaranteed. The amount of a dividend payment, if any, can vary over time and issuers may reduce dividends paid on securities in the event of a recession or adverse event affecting a specific industry or issuer.
None of the stock information, data, and company information presented herein constitutes a recommendation by Navellier or a solicitation to buy or sell any securities. Any specific securities identified and described do not represent all of the securities purchased, sold, or recommended for advisory clients. The holdings identified do not represent all of the securities purchased, sold, or recommended for advisory clients and the reader should not assume that investments in the securities identified and discussed were or will be profitable.
Information presented is general information that does not take into account your individual circumstances, financial situation, or needs, nor does it present a personalized recommendation to you. Individual stocks presented may not be suitable for every investor. Investment in securities involves significant risk and has the potential for partial or complete loss of funds invested. Investment in fixed income securities has the potential for the investment return and principal value of an investment to fluctuate so that an investor’s holdings, when redeemed, may be worth less than their original cost.
One cannot invest directly in an index. Index is unmanaged and index performance does not reflect deduction of fees, expenses, or taxes. Presentation of Index data does not reflect a belief by Navellier that any stock index constitutes an investment alternative to any Navellier equity strategy or is necessarily comparable to such strategies. Among the most important differences between the Indices and Navellier strategies are that the Navellier equity strategies may (1) incur material management fees, (2) concentrate its investments in relatively few stocks, industries, or sectors, (3) have significantly greater trading activity and related costs, and (4) be significantly more or less volatile than the Indices.
ETF Risk: We may invest in exchange traded funds (“ETFs”) and some of our investment strategies are generally fully invested in ETFs. Like traditional mutual funds, ETFs charge asset-based fees, but they generally do not charge initial sales charges or redemption fees and investors typically pay only customary brokerage fees to buy and sell ETF shares. The fees and costs charged by ETFs held in client accounts will not be deducted from the compensation the client pays Navellier. ETF prices can fluctuate up or down, and a client account could lose money investing in an ETF if the prices of the securities owned by the ETF go down. ETFs are subject to additional risks:
- ETF shares may trade above or below their net asset value;
- An active trading market for an ETF’s shares may not develop or be maintained;
- The value of an ETF may be more volatile than the underlying portfolio of securities the ETF is designed to track;
- The cost of owning shares of the ETF may exceed those a client would incur by directly investing in the underlying securities and;
- Trading of an ETF’s shares may be halted if the listing exchange’s officials deem it appropriate, the shares are delisted from the exchange, or the activation of market-wide “circuit breakers” (which are tied to large decreases in stock prices) halts stock trading generally.
Grader Disclosures: Investment in equity strategies involves substantial risk and has the potential for partial or complete loss of funds invested. The sample portfolio and any accompanying charts are for informational purposes only and are not to be construed as a solicitation to buy or sell any financial instrument and should not be relied upon as the sole factor in an investment making decision. As a matter of normal and important disclosures to you, as a potential investor, please consider the following: The performance presented is not based on any actual securities trading, portfolio, or accounts, and the reported performance of the A, B, C, D, and F portfolios (collectively the “model portfolios”) should be considered mere “paper” or pro forma performance results based on Navellier’s research.
Investors evaluating any of Navellier & Associates, Inc.’s, (or its affiliates’) Investment Products must not use any information presented here, including the performance figures of the model portfolios, in their evaluation of any Navellier Investment Products. Navellier Investment Products include the firm’s mutual funds and managed accounts. The model portfolios, charts, and other information presented do not represent actual funded trades and are not actual funded portfolios. There are material differences between Navellier Investment Products’ portfolios and the model portfolios, research, and performance figures presented here. The model portfolios and the research results (1) may contain stocks or ETFs that are illiquid and difficult to trade; (2) may contain stock or ETF holdings materially different from actual funded Navellier Investment Product portfolios; (3) include the reinvestment of all dividends and other earnings, estimated trading costs, commissions, or management fees; and, (4) may not reflect prices obtained in an actual funded Navellier Investment Product portfolio. For these and other reasons, the reported performances of model portfolios do not reflect the performance results of Navellier’s actually funded and traded Investment Products. In most cases, Navellier’s Investment Products have materially lower performance results than the performances of the model portfolios presented.
This report contains statements that are, or may be considered to be, forward-looking statements. All statements that are not historical facts, including statements about our beliefs or expectations, are “forward-looking statements” within the meaning of The U.S. Private Securities Litigation Reform Act of 1995. These statements may be identified by such forward-looking terminology as “expect,” “estimate,” “plan,” “intend,” “believe,” “anticipate,” “may,” “will,” “should,” “could,” “continue,” “project,” or similar statements or variations of such terms. Our forward-looking statements are based on a series of expectations, assumptions, and projections, are not guarantees of future results or performance, and involve substantial risks and uncertainty as described in Form ADV Part 2A of our filing with the Securities and Exchange Commission (SEC), which is available at www.adviserinfo.sec.gov or by requesting a copy by emailing info@navellier.com. All of our forward-looking statements are as of the date of this report only. We can give no assurance that such expectations or forward-looking statements will prove to be correct. Actual results may differ materially. You are urged to carefully consider all such factors.
FEDERAL TAX ADVICE DISCLAIMER: As required by U.S. Treasury Regulations, you are informed that, to the extent this presentation includes any federal tax advice, the presentation is not written by Navellier to be used, and cannot be used, for the purpose of avoiding federal tax penalties. Navellier does not advise on any income tax requirements or issues. Use of any information presented by Navellier is for general information only and does not represent tax advice either express or implied. You are encouraged to seek professional tax advice for income tax questions and assistance.
IMPORTANT NEWSLETTER DISCLOSURE:The hypothetical performance results for investment newsletters that are authored or edited by Louis Navellier, including Louis Navellier’s Growth Investor, Louis Navellier’s Breakthrough Stocks, Louis Navellier’s Accelerated Profits, and Louis Navellier’s Platinum Club, are not based on any actual securities trading, portfolio, or accounts, and the newsletters’ reported hypothetical performances should be considered mere “paper” or proforma hypothetical performance results and are not actual performance of real world trades. Navellier & Associates, Inc. does not have any relation to or affiliation with the owner of these newsletters. There are material differences between Navellier Investment Products’ portfolios and the InvestorPlace Media, LLC newsletter portfolios authored by Louis Navellier. The InvestorPlace Media, LLC newsletters contain hypothetical performance that do not include transaction costs, advisory fees, or other fees a client might incur if actual investments and trades were being made by an investor. As a result, newsletter performance should not be used to evaluate Navellier Investment services which are separate and different from the newsletters. The owner of the newsletters is InvestorPlace Media, LLC and any questions concerning the newsletters, including any newsletter advertising or hypothetical Newsletter performance claims, (which are calculated solely by Investor Place Media and not Navellier) should be referred to InvestorPlace Media, LLC at (800) 718-8289.
Please note that Navellier & Associates and the Navellier Private Client Group are managed completely independent of the newsletters owned and published by InvestorPlace Media, LLC and written and edited by Louis Navellier, and investment performance of the newsletters should in no way be considered indicative of potential future investment performance for any Navellier & Associates separately managed account portfolio. Potential investors should consult with their financial advisor before investing in any Navellier Investment Product.
Navellier claims compliance with Global Investment Performance Standards (GIPS). To receive a complete list and descriptions of Navellier’s composites and/or a presentation that adheres to the GIPS standards, please contact Navellier or click here. It should not be assumed that any securities recommendations made by Navellier & Associates, Inc. in the future will be profitable or equal the performance of securities made in this report.
FactSet Disclosure: Navellier does not independently calculate the statistical information included in the attached report. The calculation and the information are provided by FactSet, a company not related to Navellier. Although information contained in the report has been obtained from FactSet and is based on sources Navellier believes to be reliable, Navellier does not guarantee its accuracy, and it may be incomplete or condensed. The report and the related FactSet sourced information are provided on an “as is” basis. The user assumes the entire risk of any use made of this information. Investors should consider the report as only a single factor in making their investment decision. The report is for informational purposes only and is not intended as an offer or solicitation for the purchase or sale of a security. FactSet sourced information is the exclusive property of FactSet. Without prior written permission of FactSet, this information may not be reproduced, disseminated or used to create any financial products. All indices are unmanaged and performance of the indices include reinvestment of dividends and interest income, unless otherwise noted, are not illustrative of any particular investment and an investment cannot be made in any index. Past performance is no guarantee of future results.