by Gary Alexander
January 27, 2026
During and just after 9/11, Nassim Taleb, a Lebanese-born former options trader and quantitative analyst wrote a book called “Fooled by Randomness,” and then he amended (and named) this tendency in a 2007 book, called “The Black Swan,” referring to the rare (except in Australia) dark coloring of these usually white avian beauties. Taleb, said a Black Swan: (1) is an outlier, often with nothing similar seen in the past, (2) delivers extreme and immediate impact, and then (3) becomes more explainable, but only after the fact.

Forty-years ago tomorrow, on Tuesday morning, January 28, 1986, as tens of millions of American were tuned into the dramatic take-off the Space Shuttle Challenger, the craft exploded just 73-seconds into the flight, killing all seven-crew members, including beloved teacher-astronaut, Christa McAuliffe.
This shocker fulfilled all of Taleb’s criteria of a Black Swan Event: (1) It had never happened before. It was the first fatal accident of an American space ship in flight; (2) It had immediate impact, as President Reagan postponed his State of the Union speech, set for Tuesday night, and (3) it was explained, after the fact in televised hearings, by physicist Richard Feynman, as a failure of the O-rings in icy conditions.
One reaction didn’t happen 40-years ago – and seldom happens after other Black Swan events – is any stock market reaction, other than yawning. The S&P 500 rose during the day of the Challenger explosion. It rose for the week and year: It rose 2.6% for the week and 16.8% for the remainder of 1986. The Dow Jones Industrials rose 1.2% on the day of the tragedy, +2.7% for the week and +22.6% for the year 1986.
A Black Swan also flew into Great Britain exactly 50-years previously, as stock markets around the world were closed to honor the funeral of King George V on January 28, 1936. He was succeeded by Edward VIII, who launched a year-long crisis over his relationship with an American divorcee, ending 1936 with abdication in favor of his younger brother, who became George VI and later passed the crown to daughter Elizabeth, the longest-running and likely most popular Monarch ever, so things worked out just fine there.
The year 1936 was also a bullish year in an otherwise dismal Depression decade, as the Dow rose 25%.
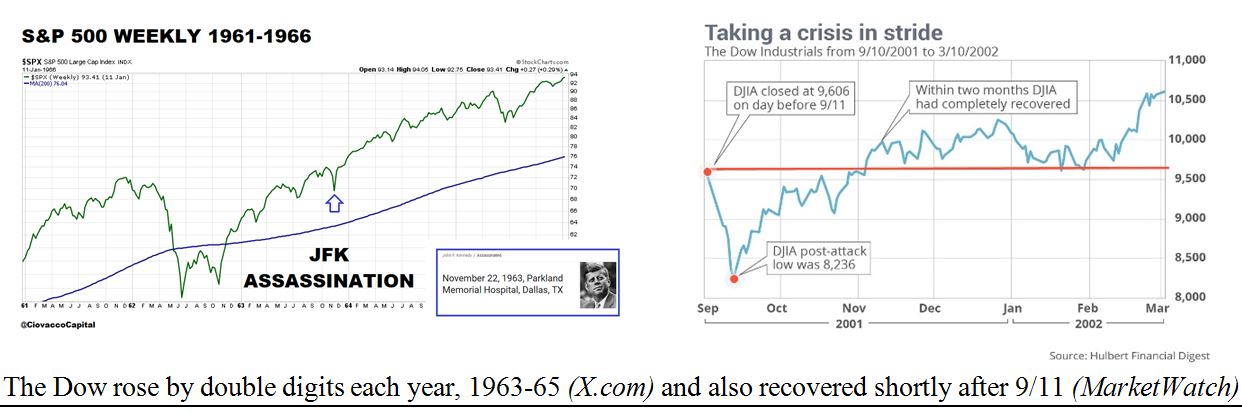
Over the last century, other notable Black Swan Events included the sudden start of World War I after a shocking assassination in the streets of Sarajevo on June 28, 1914, then Japan’s attack on Pearl Harbor on December 7, 1941, the assassination of President John F. Kennedy on November 22, 1963 and September 11, 2001 (9/11).

We also saw presidents die in office in seven-straight election years divided by 20 – i.e., William Henry Harrison (elected in 1840), then Abraham Lincoln (1860), James Garfield (1880), William McKinley (1900), Warren Harding (1920), Franklin Roosevelt (1940) and John Kennedy (1960), so you might say this trend was “predictable.” In fact, in high school in 1962, I shocked my class by using “numerology” to predict President Kennedy would die in office, continuing this trend. Two-decades later, Ronald Reagan ended this sad streak when John Hinckley’s bullet missed the Gipper’s heart by an inch in March 1981.
After Reagan (and Pope John Paul II, six-weeks later) survived assassins’ bullets in 1981, there were three-major Black Swan Events in the late 1980s: First, the 1986 Challenger explosion, then the Black Monday 1987 market crash, an event shocking investors more than the general public. Then came the 1989 fall of the Berlin Wall, a Swan-like Event, even though many had predicted the fall of Gorbachev’s USSR.
The Stock Market Ignores Most Black Swan Events
In past columns, I have reported the stock market’s surprising surge the week and year following the death of President Kennedy. The market also recovered quickly after 9/11 in 2001. These Black Swans don’t seem to impact Wall Street, as most traders react to other, mostly financial, news or trends.
Graphs are for illustrative and discussion purposes only. Please read important disclosures at the end of this commentary.
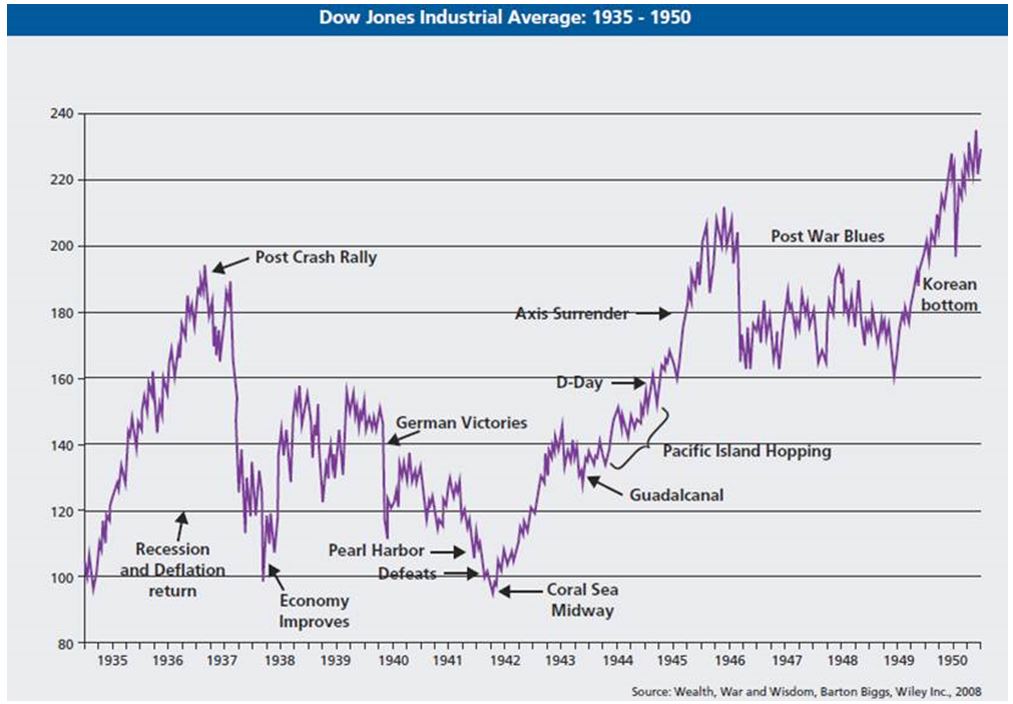
Markets also rose during most 20th century wars, most of which opened with surprise attacks. The sudden outbreaks of World Wars I and II, plus the shocking start of the Korean War and the August 1964 Gulf of Tonkin escalation of the Vietnam War, all resulted in initial declines followed by strong recoveries.
Here is a diagram of the detailed market reactions after Pearl Harbor in late 1941, and after the June 1950 Korean invasion. Those events were separated by a bit of Post-War (Swan-less) Blues in the late 1940s.
Graphs are for illustrative and discussion purposes only. Please read important disclosures at the end of this commentary.
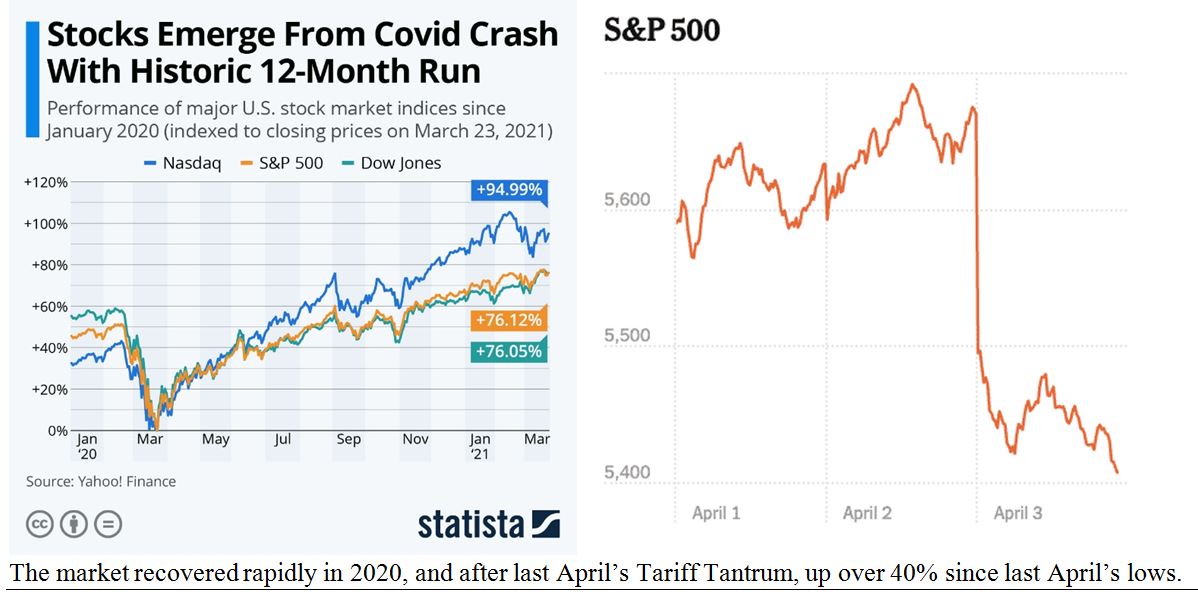
In the latest two Black Swan events, we saw: (1) the sudden escalation of the COVID-19 threat in March of 2020, causing a shocking 35% market decline in 35-days, followed by a record-strong recovery in late 2020. Then, we saw: (2) a major market decline after the shocking high-tariff charts unveiled by President Trump and Interior Secretary Lutnick on Liberation Day in April 2025, but the S&P is up 40% since then:
Graphs are for illustrative and discussion purposes only. Please read important disclosures at the end of this commentary.
Most of the Top 5 Years in the Dow’s 130-Year History came after major Black Swan events:
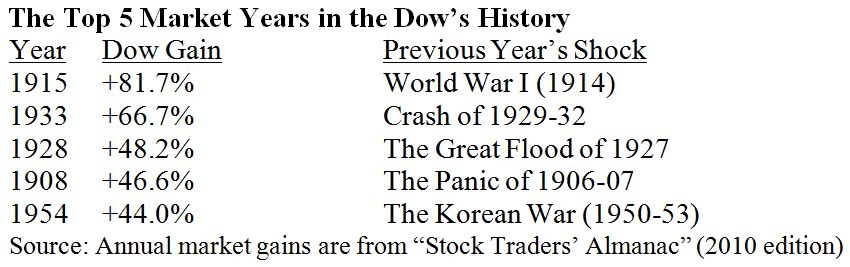
The next Black Swan Event remains unpredictable – by definition – but the market’s reaction may be predictable. With or without a quick correction, the market will most likely be much higher a year later.
All content above represents the opinion of Gary Alexander of Navellier & Associates, Inc.
Also In This Issue
A Look Ahead by Louis Navellier
President Trump Takes on Davos…and the World
Income Mail by Bryan Perry
An Opportunity to Own SpaceX Pre-IPO
Growth Mail by Gary Alexander
Black Swans May Shock Us, But the Market Ignores Them
Global Mail by Ivan Martchev
Unintended Consequences (and Fed Chair Announcement) Alert
Sector Spotlight by Jason Bodner
How to See Clearly While Flying Through Dense Market Fog
View Full Archive
Read Past Issues Here
About The Author

Gary Alexander
SENIOR EDITOR
Gary Alexander has been Senior Writer at Navellier since 2009. He edits Navellier’s weekly Marketmail and writes a weekly Growth Mail column, in which he uses market history to support the case for growth stocks. For the previous 20-years before joining Navellier, he was Senior Executive Editor at InvestorPlace Media (formerly Phillips Publishing), where he worked with several leading investment analysts, including Louis Navellier (since 1997), helping launch Louis Navellier’s Blue Chip Growth and Global Growth newsletters.
Prior to that, Gary edited Wealth Magazine and Gold Newsletter and wrote various investment research reports for Jefferson Financial in New Orleans in the 1980s. He began his financial newsletter career with KCI Communications in 1980, where he served as consulting editor for Personal Finance newsletter while serving as general manager of KCI’s Alexandria House book division. Before that, he covered the economics beat for news magazines. All content of “Growth Mail” represents the opinion of Gary Alexander
Important Disclosures:
Although information in these reports has been obtained from and is based upon sources that Navellier believes to be reliable, Navellier does not guarantee its accuracy and it may be incomplete or condensed. All opinions and estimates constitute Navellier’s judgment as of the date the report was created and are subject to change without notice. These reports are for informational purposes only and are not a solicitation for the purchase or sale of a security. Any decision to purchase securities mentioned in these reports must take into account existing public information on such securities or any registered prospectus.To the extent permitted by law, neither Navellier & Associates, Inc., nor any of its affiliates, agents, or service providers assumes any liability or responsibility nor owes any duty of care for any consequences of any person acting or refraining to act in reliance on the information contained in this communication or for any decision based on it.
Past performance is no indication of future results. Investment in securities involves significant risk and has the potential for partial or complete loss of funds invested. It should not be assumed that any securities recommendations made by Navellier. in the future will be profitable or equal the performance of securities made in this report. Dividend payments are not guaranteed. The amount of a dividend payment, if any, can vary over time and issuers may reduce dividends paid on securities in the event of a recession or adverse event affecting a specific industry or issuer.
None of the stock information, data, and company information presented herein constitutes a recommendation by Navellier or a solicitation to buy or sell any securities. Any specific securities identified and described do not represent all of the securities purchased, sold, or recommended for advisory clients. The holdings identified do not represent all of the securities purchased, sold, or recommended for advisory clients and the reader should not assume that investments in the securities identified and discussed were or will be profitable.
Information presented is general information that does not take into account your individual circumstances, financial situation, or needs, nor does it present a personalized recommendation to you. Individual stocks presented may not be suitable for every investor. Investment in securities involves significant risk and has the potential for partial or complete loss of funds invested. Investment in fixed income securities has the potential for the investment return and principal value of an investment to fluctuate so that an investor’s holdings, when redeemed, may be worth less than their original cost.
One cannot invest directly in an index. Index is unmanaged and index performance does not reflect deduction of fees, expenses, or taxes. Presentation of Index data does not reflect a belief by Navellier that any stock index constitutes an investment alternative to any Navellier equity strategy or is necessarily comparable to such strategies. Among the most important differences between the Indices and Navellier strategies are that the Navellier equity strategies may (1) incur material management fees, (2) concentrate its investments in relatively few stocks, industries, or sectors, (3) have significantly greater trading activity and related costs, and (4) be significantly more or less volatile than the Indices.
ETF Risk: We may invest in exchange traded funds (“ETFs”) and some of our investment strategies are generally fully invested in ETFs. Like traditional mutual funds, ETFs charge asset-based fees, but they generally do not charge initial sales charges or redemption fees and investors typically pay only customary brokerage fees to buy and sell ETF shares. The fees and costs charged by ETFs held in client accounts will not be deducted from the compensation the client pays Navellier. ETF prices can fluctuate up or down, and a client account could lose money investing in an ETF if the prices of the securities owned by the ETF go down. ETFs are subject to additional risks:
- ETF shares may trade above or below their net asset value;
- An active trading market for an ETF’s shares may not develop or be maintained;
- The value of an ETF may be more volatile than the underlying portfolio of securities the ETF is designed to track;
- The cost of owning shares of the ETF may exceed those a client would incur by directly investing in the underlying securities; and
- Trading of an ETF’s shares may be halted if the listing exchange’s officials deem it appropriate, the shares are delisted from the exchange, or the activation of market-wide “circuit breakers” (which are tied to large decreases in stock prices) halts stock trading generally.
Grader Disclosures: Investment in equity strategies involves substantial risk and has the potential for partial or complete loss of funds invested. The sample portfolio and any accompanying charts are for informational purposes only and are not to be construed as a solicitation to buy or sell any financial instrument and should not be relied upon as the sole factor in an investment making decision. As a matter of normal and important disclosures to you, as a potential investor, please consider the following: The performance presented is not based on any actual securities trading, portfolio, or accounts, and the reported performance of the A, B, C, D, and F portfolios (collectively the “model portfolios”) should be considered mere “paper” or pro forma performance results based on Navellier’s research.
Investors evaluating any of Navellier & Associates, Inc.’s, (or its affiliates’) Investment Products must not use any information presented here, including the performance figures of the model portfolios, in their evaluation of any Navellier Investment Products. Navellier Investment Products include the firm’s mutual funds and managed accounts. The model portfolios, charts, and other information presented do not represent actual funded trades and are not actual funded portfolios. There are material differences between Navellier Investment Products’ portfolios and the model portfolios, research, and performance figures presented here. The model portfolios and the research results (1) may contain stocks or ETFs that are illiquid and difficult to trade; (2) may contain stock or ETF holdings materially different from actual funded Navellier Investment Product portfolios; (3) include the reinvestment of all dividends and other earnings, estimated trading costs, commissions, or management fees; and, (4) may not reflect prices obtained in an actual funded Navellier Investment Product portfolio. For these and other reasons, the reported performances of model portfolios do not reflect the performance results of Navellier’s actually funded and traded Investment Products. In most cases, Navellier’s Investment Products have materially lower performance results than the performances of the model portfolios presented.
This report contains statements that are, or may be considered to be, forward-looking statements. All statements that are not historical facts, including statements about our beliefs or expectations, are “forward-looking statements” within the meaning of The U.S. Private Securities Litigation Reform Act of 1995. These statements may be identified by such forward-looking terminology as “expect,” “estimate,” “plan,” “intend,” “believe,” “anticipate,” “may,” “will,” “should,” “could,” “continue,” “project,” or similar statements or variations of such terms. Our forward-looking statements are based on a series of expectations, assumptions, and projections, are not guarantees of future results or performance, and involve substantial risks and uncertainty as described in Form ADV Part 2A of our filing with the Securities and Exchange Commission (SEC), which is available at www.adviserinfo.sec.gov or by requesting a copy by emailing info@navellier.com. All of our forward-looking statements are as of the date of this report only. We can give no assurance that such expectations or forward-looking statements will prove to be correct. Actual results may differ materially. You are urged to carefully consider all such factors.
FEDERAL TAX ADVICE DISCLAIMER: As required by U.S. Treasury Regulations, you are informed that, to the extent this presentation includes any federal tax advice, the presentation is not written by Navellier to be used, and cannot be used, for the purpose of avoiding federal tax penalties. Navellier does not advise on any income tax requirements or issues. Use of any information presented by Navellier is for general information only and does not represent tax advice either express or implied. You are encouraged to seek professional tax advice for income tax questions and assistance.
IMPORTANT NEWSLETTER DISCLOSURE:The hypothetical performance results for investment newsletters that are authored or edited by Louis Navellier, including Louis Navellier’s Growth Investor, Louis Navellier’s Breakthrough Stocks, Louis Navellier’s Accelerated Profits, and Louis Navellier’s Platinum Club, are not based on any actual securities trading, portfolio, or accounts, and the newsletters’ reported hypothetical performances should be considered mere “paper” or proforma hypothetical performance results and are not actual performance of real world trades. Navellier & Associates, Inc. does not have any relation to or affiliation with the owner of these newsletters. There are material differences between Navellier Investment Products’ portfolios and the InvestorPlace Media, LLC newsletter portfolios authored by Louis Navellier. The InvestorPlace Media, LLC newsletters contain hypothetical performance that do not include transaction costs, advisory fees, or other fees a client might incur if actual investments and trades were being made by an investor. As a result, newsletter performance should not be used to evaluate Navellier Investment services which are separate and different from the newsletters. The owner of the newsletters is InvestorPlace Media, LLC and any questions concerning the newsletters, including any newsletter advertising or hypothetical Newsletter performance claims, (which are calculated solely by Investor Place Media and not Navellier) should be referred to InvestorPlace Media, LLC at (800) 718-8289.
Please note that Navellier & Associates and the Navellier Private Client Group are managed completely independent of the newsletters owned and published by InvestorPlace Media, LLC and written and edited by Louis Navellier, and investment performance of the newsletters should in no way be considered indicative of potential future investment performance for any Navellier & Associates separately managed account portfolio. Potential investors should consult with their financial advisor before investing in any Navellier Investment Product.
Navellier claims compliance with Global Investment Performance Standards (GIPS). To receive a complete list and descriptions of Navellier’s composites and/or a presentation that adheres to the GIPS standards, please contact Navellier or click here. It should not be assumed that any securities recommendations made by Navellier & Associates, Inc. in the future will be profitable or equal the performance of securities made in this report.
FactSet Disclosure: Navellier does not independently calculate the statistical information included in the attached report. The calculation and the information are provided by FactSet, a company not related to Navellier. Although information contained in the report has been obtained from FactSet and is based on sources Navellier believes to be reliable, Navellier does not guarantee its accuracy, and it may be incomplete or condensed. The report and the related FactSet sourced information are provided on an “as is” basis. The user assumes the entire risk of any use made of this information. Investors should consider the report as only a single factor in making their investment decision. The report is for informational purposes only and is not intended as an offer or solicitation for the purchase or sale of a security. FactSet sourced information is the exclusive property of FactSet. Without prior written permission of FactSet, this information may not be reproduced, disseminated or used to create any financial products. All indices are unmanaged and performance of the indices include reinvestment of dividends and interest income, unless otherwise noted, are not illustrative of any particular investment and an investment cannot be made in any index. Past performance is no guarantee of future results.