by Jason Bodner
January 14, 2025
It’s time for the January Effect – a little overtime, in fact. The January Effect is the theory that stock prices rise more in January than in other months. That would be a lovely outcome, but so far 2025 is not working out as expected. Los Angeles is dealing with catastrophic fires, with thousands of families losing their homes, while both the North and the South are in deep freeze. There’s a beef between the U.S. and Canada – and maybe Greenland, Panama, Mexico and other nations, too – and Nvidia’s CEO Jensen Huang splashed cold water on quantum computing stocks, sending them off a cliff. As I write this, all four major stock indexes are in the red for the year-to-date, so what gives? Where’s that “January effect”?
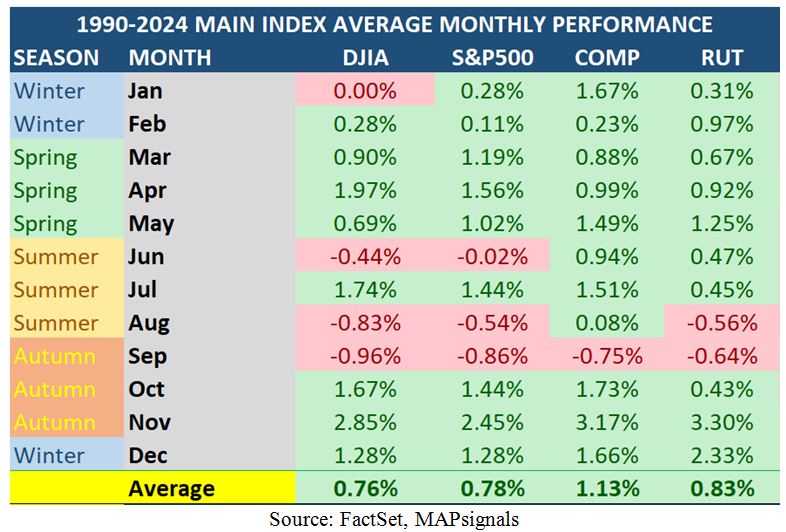
First things first. Let’s look at the major stock market indexes going back to 1990: Only 20 of 35 Januarys (57%) since then showed positive returns for the S&P 500 – just four out of seven. Compare that to November, which was positive 74% of the time. Perhaps the January effect isn’t really something to rely on. As we can see below, January is flat in the Dow, and only up 0.3% in the S&P and Russell 2000. The only sign of life among the four major indexes is in the NASDAQ Composite (averaging +1.67%):
Graphs are for illustrative and discussion purposes only. Please read important disclosures at the end of this commentary.
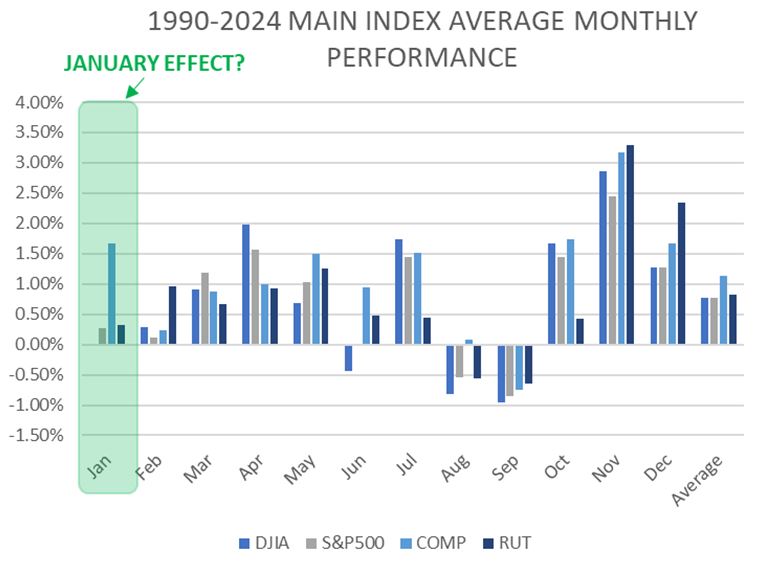
Next, let’s visualize these facts in another way. Here is a graph of average monthly returns since 1990, using the same data. We can see that maybe we shouldn’t expect all that much from Januarys after all…
Graphs are for illustrative and discussion purposes only. Please read important disclosures at the end of this commentary.
Now, with our expectations dutifully adjusted downward, we need to check in on our trusty Big Money Index (BMI), our 25-day moving average of all unusually large buying and selling by the biggest traders. When the amber line rises, money is moving into stocks, and when it falls, money is moving out.
The downtrend seems headed towards oversold territory:

Graphs are for illustrative and discussion purposes only. Please read important disclosures at the end of this commentary.
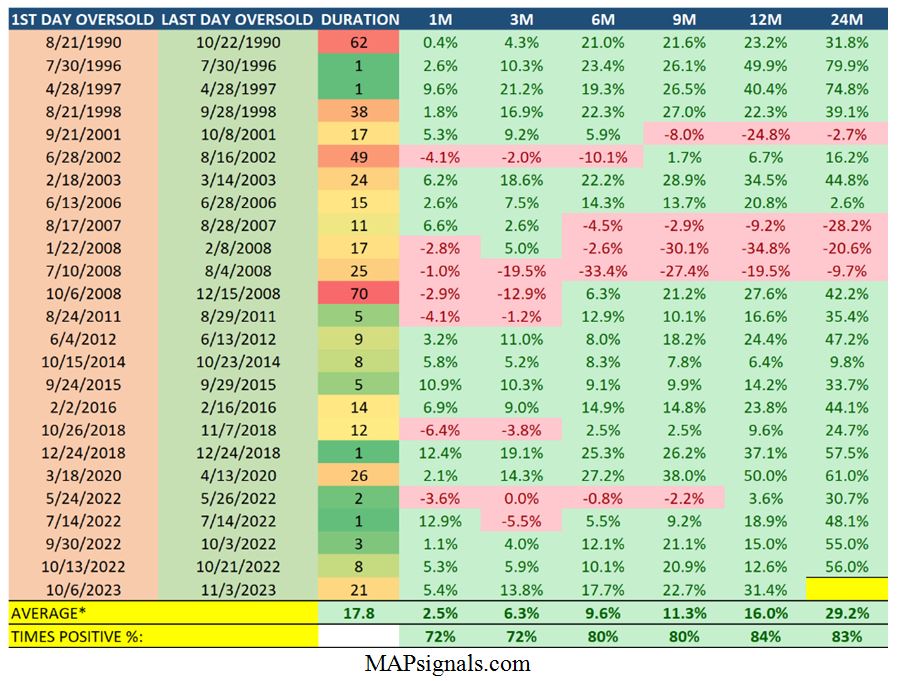
The good news about any oversold market is that the odds are excellent for a big rally coming out of oversold. Here is a summary of oversold periods and their forward returns in the S&P 500:
Graphs are for illustrative and discussion purposes only. Please read important disclosures at the end of this commentary.
Except for the 2000-02 and 2007-09 bear markets, long-term gains are exceptional. Even with those big drags, the odds are well above 80% for gains after six months. The bad news about being oversold, however, is that it nearly always reflects an ugly gut-wrenching market that can feel very uncomfortable.
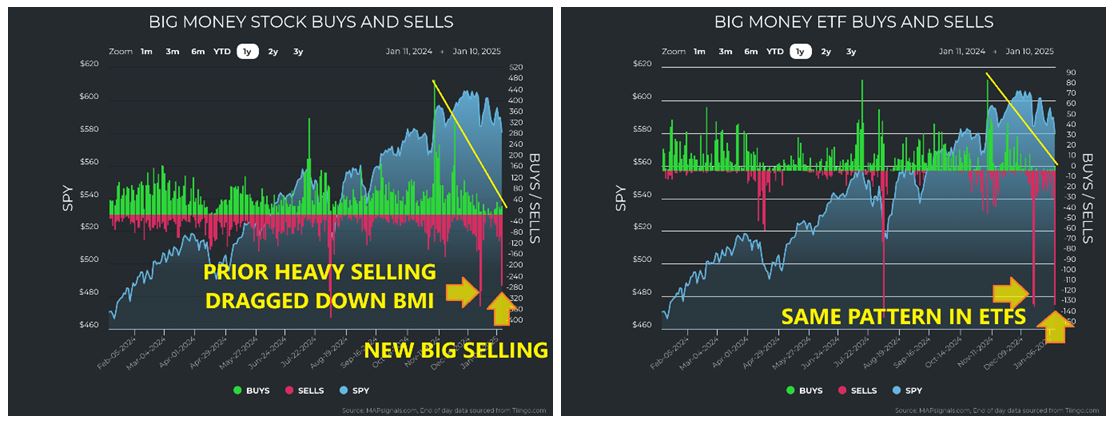
But before we get carried away fearing a big washout in the near future, let’s look at what’s driving that BMI lower. The first thing we notice is that, up to last Friday, the BMI wasn’t falling because of recent immense selling. The BMI was mainly down due to the lack of new buying. In the charts of both stocks and ETFs, we see heavy selling in December and low buying since then:
Graphs are for illustrative and discussion purposes only. Please read important disclosures at the end of this commentary.
This is a key point, because the way the BMI is calculated reflects the net unusual buying and selling over 25 trading days. And because late December’s selling was so intense, it continues to drag down the BMI. (If there were buying to balance it out, the BMI wouldn’t be falling so quickly).
It is also worth noting that the number of unusually large trading signals peaked during that bout of selling. Signal counts are just starting to approach the average, without heavy selling:

Graphs are for illustrative and discussion purposes only. Please read important disclosures at the end of this commentary.
On Friday, we saw a 259-sell day. For context, the daily average of sells since 1990 is 36. Even with the increased volume of the last 10 years, the average daily sells since 2015 is 54, so Friday saw nearly five-times the last decade’s average. For that reason, I went back to look at forward returns after all the days since 1990 that saw 259 sells or more. I found 164 instances out of 8,797 trading days – or just under 2% of the time – so selling like this is rare. The forward returns for stocks, however, are quite encouraging:

Graphs are for illustrative and discussion purposes only. Please read important disclosures at the end of this commentary.
All this is to say that I’m not ready to sound any alarm bells – yet. I‘m also not dismissing the possibility of going into oversold territory, perhaps soon. The odds are certainly higher after Friday’s ugly action.
Right now, it is most crucial to monitor selling. If Friday was a “capitulation day,” we will see signs in the data. We are entering earnings season this week, so I expect volatility, but with the trend of companies beating estimates, history suggests a higher likelihood of more up volatility than down. According to data collected from FactSet Earnings Insights, odds are near 75% that companies will beat earnings estimates:
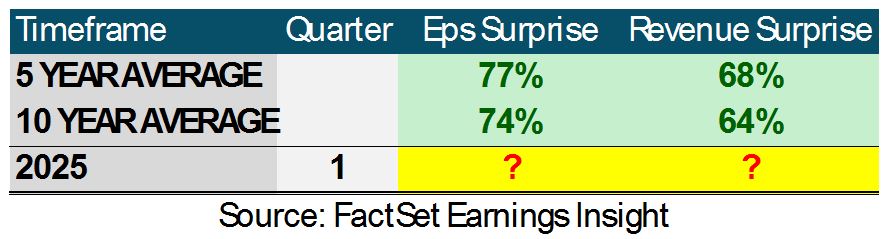
Graphs are for illustrative and discussion purposes only. Please read important disclosures at the end of this commentary.
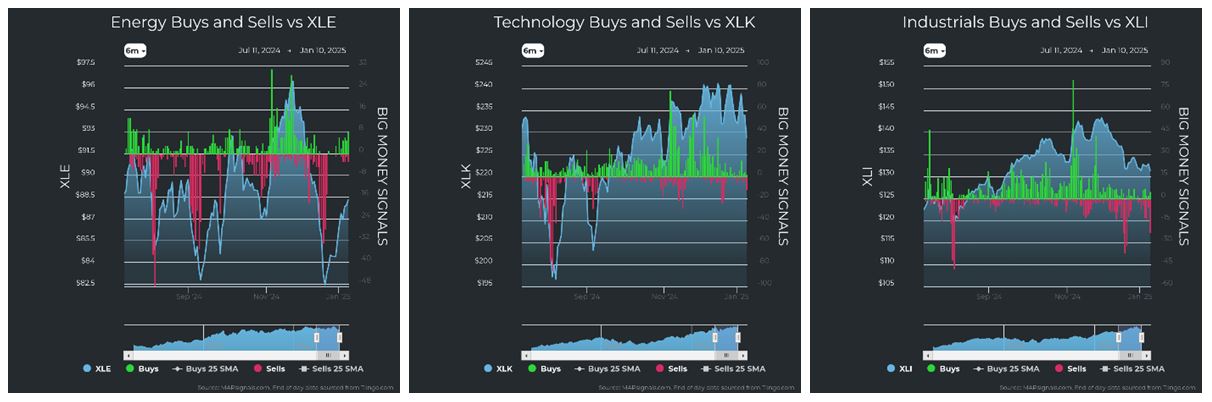
Next up, we should dig into the sector level data to see if anything jumps out:


Graphs are for illustrative and discussion purposes only. Please read important disclosures at the end of this commentary.
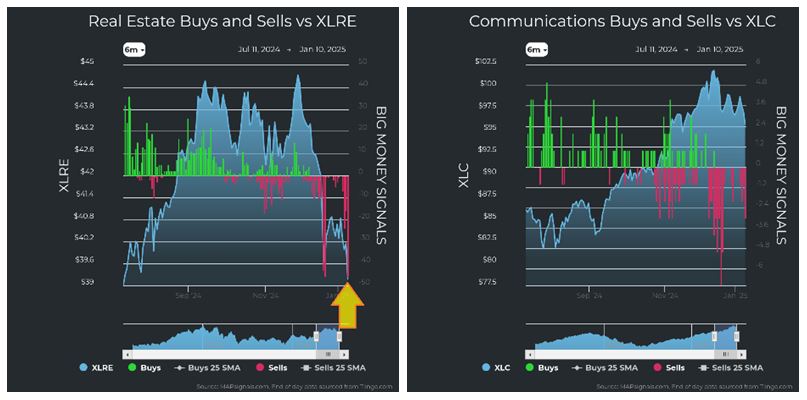
The main thing I see in this survey of the 11 S&P sectors is that the elevated selling is concentrated in the interest-rate-sensitive stocks, namely Utilities, Staples, and Real Estate: Each saw the brunt of the recent distribution. This is clearly another market freakout over rates, the prevailing thorn in the side of stocks.
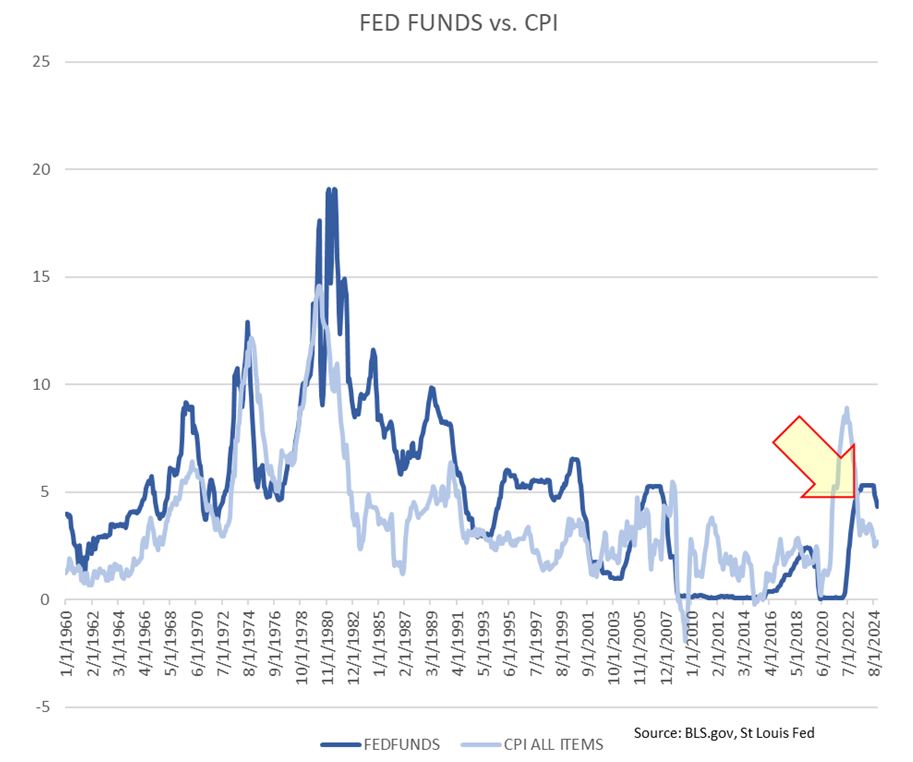
Let me assure you that rates will continue to fall as inflation falls. Our next CPI report is coming out tomorrow, January 15th, so we will get short-term clarity, but the long-term trend is still downward, despite the CPI’s recent uptick. Either way, the effective Fed funds rate is well above the CPI:
Graphs are for illustrative and discussion purposes only. Please read important disclosures at the end of this commentary.
The selling we’ve seen in Real Estate is echoed in year-to-date activity seen below… Real Estate is the #1 sold sector since January 1. Meanwhile, Technology is seeing the most buying, which is a positive:

Graphs are for illustrative and discussion purposes only. Please read important disclosures at the end of this commentary.
Here’s the game plan for now:
- If we see a continuation of intense selling, that just means we are getting closer to being oversold. If things stay how they have been, oversold is coming soon, as soon as Monday, January 20th.
- If earnings surprises continue their historical pattern of positive surprises (“beats”) and companies give rosy guidance, this weak start to the year could reverse quickly.
- Either way, this gives us a great opportunity to hone our buy lists as stocks are trading lower. Sale prices don’t come around very often, so look to identify great stocks going on sale! My plan is to comb through my lists of highest-ranked stocks in a recent decline in their technical scores.
Stick to the plan.
Concerning New Year’s resolutions, you may have broken some of them already, so take consolation from what Marcel Proust said: “It is always during a passing state of mind that we make lasting resolutions.”
Navellier & Associates owns Nvidia Corp (NVDA), in managed accounts. Jason Bodner owns Nvidia Corp (NVDA), in a personal account.
All content above represents the opinion of Jason Bodner of Navellier & Associates, Inc.
Also In This Issue
A Look Ahead by Louis Navellier
The U.S. is Still the Major Magnet for the World’s Wealth
Income Mail by Bryan Perry
The Latest “Hot” Jobs Number Will Likely Be Revised Lower
Growth Mail by Gary Alexander
Benchmarks for Gold, U.S. Stocks and China in Mid-January
Global Mail by Ivan Martchev
Treasuries are the Biggest Problem Facing Stocks Now
Sector Spotlight by Jason Bodner
It’s Almost Mid-January – So, Where’s That “January Effect?”
View Full Archive
Read Past Issues Here

Jason Bodner
MARKETMAIL EDITOR FOR SECTOR SPOTLIGHT
Jason Bodner writes Sector Spotlight in the weekly Marketmail publication and has authored several white papers for the company. He is also Co-Founder of Macro Analytics for Professionals which produces proprietary equity accumulation and distribution research for its clients. Previously, Mr. Bodner served as Director of European Equity Derivatives for Cantor Fitzgerald Europe in London, then moved to the role of Head of Equity Derivatives North America for the same company in New York. He also served as S.V.P. Equity Derivatives for Jefferies, LLC. He received a B.S. in business administration in 1996, with honors, from Skidmore College as a member of the Periclean Honors Society. All content of “Sector Spotlight” represents the opinion of Jason Bodner
Important Disclosures:
Jason Bodner is a co-founder and co-owner of Mapsignals. Mr. Bodner is an independent contractor who is occasionally hired by Navellier & Associates to write an article and or provide opinions for possible use in articles that appear in Navellier & Associates weekly Market Mail. Mr. Bodner is not employed or affiliated with Louis Navellier, Navellier & Associates, Inc., or any other Navellier owned entity. The opinions and statements made here are those of Mr. Bodner and not necessarily those of any other persons or entities. This is not an endorsement, or solicitation or testimonial or investment advice regarding the BMI Index or any statements or recommendations or analysis in the article or the BMI Index or Mapsignals or its products or strategies.
Although information in these reports has been obtained from and is based upon sources that Navellier believes to be reliable, Navellier does not guarantee its accuracy and it may be incomplete or condensed. All opinions and estimates constitute Navellier’s judgment as of the date the report was created and are subject to change without notice. These reports are for informational purposes only and are not a solicitation for the purchase or sale of a security. Any decision to purchase securities mentioned in these reports must take into account existing public information on such securities or any registered prospectus.To the extent permitted by law, neither Navellier & Associates, Inc., nor any of its affiliates, agents, or service providers assumes any liability or responsibility nor owes any duty of care for any consequences of any person acting or refraining to act in reliance on the information contained in this communication or for any decision based on it.
Past performance is no indication of future results. Investment in securities involves significant risk and has the potential for partial or complete loss of funds invested. It should not be assumed that any securities recommendations made by Navellier. in the future will be profitable or equal the performance of securities made in this report. Dividend payments are not guaranteed. The amount of a dividend payment, if any, can vary over time and issuers may reduce dividends paid on securities in the event of a recession or adverse event affecting a specific industry or issuer.
None of the stock information, data, and company information presented herein constitutes a recommendation by Navellier or a solicitation to buy or sell any securities. Any specific securities identified and described do not represent all of the securities purchased, sold, or recommended for advisory clients. The holdings identified do not represent all of the securities purchased, sold, or recommended for advisory clients and the reader should not assume that investments in the securities identified and discussed were or will be profitable.
Information presented is general information that does not take into account your individual circumstances, financial situation, or needs, nor does it present a personalized recommendation to you. Individual stocks presented may not be suitable for every investor. Investment in securities involves significant risk and has the potential for partial or complete loss of funds invested. Investment in fixed income securities has the potential for the investment return and principal value of an investment to fluctuate so that an investor’s holdings, when redeemed, may be worth less than their original cost.
One cannot invest directly in an index. Index is unmanaged and index performance does not reflect deduction of fees, expenses, or taxes. Presentation of Index data does not reflect a belief by Navellier that any stock index constitutes an investment alternative to any Navellier equity strategy or is necessarily comparable to such strategies. Among the most important differences between the Indices and Navellier strategies are that the Navellier equity strategies may (1) incur material management fees, (2) concentrate its investments in relatively few stocks, industries, or sectors, (3) have significantly greater trading activity and related costs, and (4) be significantly more or less volatile than the Indices.
ETF Risk: We may invest in exchange traded funds (“ETFs”) and some of our investment strategies are generally fully invested in ETFs. Like traditional mutual funds, ETFs charge asset-based fees, but they generally do not charge initial sales charges or redemption fees and investors typically pay only customary brokerage fees to buy and sell ETF shares. The fees and costs charged by ETFs held in client accounts will not be deducted from the compensation the client pays Navellier. ETF prices can fluctuate up or down, and a client account could lose money investing in an ETF if the prices of the securities owned by the ETF go down. ETFs are subject to additional risks:
- ETF shares may trade above or below their net asset value;
- An active trading market for an ETF’s shares may not develop or be maintained;
- The value of an ETF may be more volatile than the underlying portfolio of securities the ETF is designed to track;
- The cost of owning shares of the ETF may exceed those a client would incur by directly investing in the underlying securities and;
- Trading of an ETF’s shares may be halted if the listing exchange’s officials deem it appropriate, the shares are delisted from the exchange, or the activation of market-wide “circuit breakers” (which are tied to large decreases in stock prices) halts stock trading generally.
Grader Disclosures: Investment in equity strategies involves substantial risk and has the potential for partial or complete loss of funds invested. The sample portfolio and any accompanying charts are for informational purposes only and are not to be construed as a solicitation to buy or sell any financial instrument and should not be relied upon as the sole factor in an investment making decision. As a matter of normal and important disclosures to you, as a potential investor, please consider the following: The performance presented is not based on any actual securities trading, portfolio, or accounts, and the reported performance of the A, B, C, D, and F portfolios (collectively the “model portfolios”) should be considered mere “paper” or pro forma performance results based on Navellier’s research.
Investors evaluating any of Navellier & Associates, Inc.’s, (or its affiliates’) Investment Products must not use any information presented here, including the performance figures of the model portfolios, in their evaluation of any Navellier Investment Products. Navellier Investment Products include the firm’s mutual funds and managed accounts. The model portfolios, charts, and other information presented do not represent actual funded trades and are not actual funded portfolios. There are material differences between Navellier Investment Products’ portfolios and the model portfolios, research, and performance figures presented here. The model portfolios and the research results (1) may contain stocks or ETFs that are illiquid and difficult to trade; (2) may contain stock or ETF holdings materially different from actual funded Navellier Investment Product portfolios; (3) include the reinvestment of all dividends and other earnings, estimated trading costs, commissions, or management fees; and, (4) may not reflect prices obtained in an actual funded Navellier Investment Product portfolio. For these and other reasons, the reported performances of model portfolios do not reflect the performance results of Navellier’s actually funded and traded Investment Products. In most cases, Navellier’s Investment Products have materially lower performance results than the performances of the model portfolios presented.
This report contains statements that are, or may be considered to be, forward-looking statements. All statements that are not historical facts, including statements about our beliefs or expectations, are “forward-looking statements” within the meaning of The U.S. Private Securities Litigation Reform Act of 1995. These statements may be identified by such forward-looking terminology as “expect,” “estimate,” “plan,” “intend,” “believe,” “anticipate,” “may,” “will,” “should,” “could,” “continue,” “project,” or similar statements or variations of such terms. Our forward-looking statements are based on a series of expectations, assumptions, and projections, are not guarantees of future results or performance, and involve substantial risks and uncertainty as described in Form ADV Part 2A of our filing with the Securities and Exchange Commission (SEC), which is available at www.adviserinfo.sec.gov or by requesting a copy by emailing info@navellier.com. All of our forward-looking statements are as of the date of this report only. We can give no assurance that such expectations or forward-looking statements will prove to be correct. Actual results may differ materially. You are urged to carefully consider all such factors.
FEDERAL TAX ADVICE DISCLAIMER: As required by U.S. Treasury Regulations, you are informed that, to the extent this presentation includes any federal tax advice, the presentation is not written by Navellier to be used, and cannot be used, for the purpose of avoiding federal tax penalties. Navellier does not advise on any income tax requirements or issues. Use of any information presented by Navellier is for general information only and does not represent tax advice either express or implied. You are encouraged to seek professional tax advice for income tax questions and assistance.
IMPORTANT NEWSLETTER DISCLOSURE:The hypothetical performance results for investment newsletters that are authored or edited by Louis Navellier, including Louis Navellier’s Growth Investor, Louis Navellier’s Breakthrough Stocks, Louis Navellier’s Accelerated Profits, and Louis Navellier’s Platinum Club, are not based on any actual securities trading, portfolio, or accounts, and the newsletters’ reported hypothetical performances should be considered mere “paper” or proforma hypothetical performance results and are not actual performance of real world trades. Navellier & Associates, Inc. does not have any relation to or affiliation with the owner of these newsletters. There are material differences between Navellier Investment Products’ portfolios and the InvestorPlace Media, LLC newsletter portfolios authored by Louis Navellier. The InvestorPlace Media, LLC newsletters contain hypothetical performance that do not include transaction costs, advisory fees, or other fees a client might incur if actual investments and trades were being made by an investor. As a result, newsletter performance should not be used to evaluate Navellier Investment services which are separate and different from the newsletters. The owner of the newsletters is InvestorPlace Media, LLC and any questions concerning the newsletters, including any newsletter advertising or hypothetical Newsletter performance claims, (which are calculated solely by Investor Place Media and not Navellier) should be referred to InvestorPlace Media, LLC at (800) 718-8289.
Please note that Navellier & Associates and the Navellier Private Client Group are managed completely independent of the newsletters owned and published by InvestorPlace Media, LLC and written and edited by Louis Navellier, and investment performance of the newsletters should in no way be considered indicative of potential future investment performance for any Navellier & Associates separately managed account portfolio. Potential investors should consult with their financial advisor before investing in any Navellier Investment Product.
Navellier claims compliance with Global Investment Performance Standards (GIPS). To receive a complete list and descriptions of Navellier’s composites and/or a presentation that adheres to the GIPS standards, please contact Navellier or click here. It should not be assumed that any securities recommendations made by Navellier & Associates, Inc. in the future will be profitable or equal the performance of securities made in this report.
FactSet Disclosure: Navellier does not independently calculate the statistical information included in the attached report. The calculation and the information are provided by FactSet, a company not related to Navellier. Although information contained in the report has been obtained from FactSet and is based on sources Navellier believes to be reliable, Navellier does not guarantee its accuracy, and it may be incomplete or condensed. The report and the related FactSet sourced information are provided on an “as is” basis. The user assumes the entire risk of any use made of this information. Investors should consider the report as only a single factor in making their investment decision. The report is for informational purposes only and is not intended as an offer or solicitation for the purchase or sale of a security. FactSet sourced information is the exclusive property of FactSet. Without prior written permission of FactSet, this information may not be reproduced, disseminated or used to create any financial products. All indices are unmanaged and performance of the indices include reinvestment of dividends and interest income, unless otherwise noted, are not illustrative of any particular investment and an investment cannot be made in any index. Past performance is no guarantee of future results.