
Where We’ve Been &
Where We’re Headed:
My Second Half Outlook
Think back to January for a moment.
Investors were laying out their expectations for 2026. Wall Street strategists were publishing their forecasts. Economists were debating interest rates, inflation and economic growth. And just about everyone had an opinion about what the year ahead would bring.
Now imagine telling them this:
Oil prices will surge to nearly $120 per barrel.
Gold will tumble more than 20% from its record high.
And while much of the attention has been focused on when central banks would cut interest rates, several major central banks will actually raise them.
You probably would have gotten a few strange looks.
Yet, here we are.
The first half of 2026 delivered several developments that very few investors had on their bingo cards at the beginning of the year.
The biggest catalyst, of course, was the escalating tensions in the Middle East and subsequent closure of the Strait of Hormuz, one of the world’s most important shipping routes.
The effects quickly rippled through global markets.
- West Texas Intermediate (WTI) and Brent crude oil both surged to nearly $120 per barrel before moderating to around $80 per barrel and rising again to between $80 and $90 per barrel this summer.
- Gold prices tumbled more than 20% from the record high of $5,354 per ounce that was set in January before rebounding to around $4,400 per ounce.
- The European Central Bank (ECB), Bank of Japan and South Korea’s central bank all raised key interest rates this year due to inflationary concerns and slowing economic growth.
In other words, the 2026 investors were preparing for in January isn’t quite the 2026 we’ve gotten.
And I think that’s worth remembering as we turn our attention to the second half of the year.
Because the natural question is: What happens next?
As you know, I don’t have a crystal ball. No one does.
But we don’t have to guess blindly, either.
We have economic data. We have earnings. We have market history. And we have several important trends already taking shape that may give us some clues about what the months ahead could look like.
So, rather than simply making predictions, I want to walk you through what I’m watching, what I think it could mean for investors and where I believe some of the biggest opportunities and risks may emerge during the second half of 2026.
U.S. Emerges as an Economic Oasis
The U.S. recently held a massive birthday bash, celebrating 250 years of independence.
At picnics and parties across our great nation, millions of hot dogs were consumed and plenty of cold beer was poured. Flags were proudly flying. Fireworks were booming and lighting up skies from the East Coast to the West Coast.
Americans certainly know how to party.
But once the fireworks faded and everyone headed back to work, there were some less festive numbers waiting for us.
Gas prices remained elevated. Trips to the grocery store weren’t getting any cheaper. And the latest labor data revealed another interesting development: The labor force participation rate had fallen to its lowest level in nearly half a century, outside of the pandemic.
So, while America had plenty to celebrate on its 250th birthday, the economy was giving us plenty to think about, too.
You might expect all of that to put a serious dent in the American consumer’s outlook.
But here’s where things get interesting.
Despite those pressures, Americans aren’t nearly as pessimistic as you might think.
In fact, consumer sentiment jumped to a five-month high in July. The University of Michigan’s Consumer Sentiment Index came in at 54.4 in July, up from 49.5 in June—and the improvement was broad-based across age, income, wealth and political affiliation.
Source: Reuters 07/17/2026
Why the disconnect?
Well, Americans may be paying more at the pump and the grocery store, but the broader U.S. economy continues to show surprising resilience.
The U.S. economy grew at a 2.1% annual pace in the first quarter, with GDP increasing in 46 of the 50 states and Washington, D.C.
Source: Reuters 06/30/2026
And that growth looks even more impressive when you consider what’s happening elsewhere in the world.
The U.K. economy grew at just a 0.6% annual pace during the first quarter, while the European Union (EU) reported a 0.2% decline in economic growth.
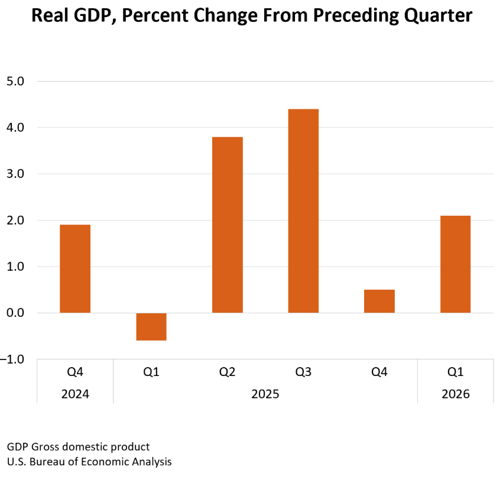
Clearly, the U.S. has emerged as an economic oasis in 2026.
Now, GDP growth cooled a bit in the second quarter. The U.S. economy grew at a 1.5% annual pace, and consumer spending increased at a 3.2% annual pace. The better-than-expected consumer spending is a very good sign that the U.S. economy is on solid ground. GDP growth should also re-accelerate in the second half of 2026.
Source: Bloomberg 07/30/2026
Personally, I expect U.S. GDP growth to reach at least a 5% annual pace in the third quarter.
First, there’s been a massive shift to bring manufacturing back to America’s shores. Semiconductor, automotive and pharmaceutical companies have all been bringing business back to the U.S., thanks in part to incentives like the CHIPS Act and Inflation Reduction Act.
As a result, the U.S. manufacturing sector has finally pulled itself out of a recession. In fact, the Institute of Supply Management (ISM) reports that its manufacturing index has had readings above 50, which signals expansion, for six-straight months.
Source: PR Newswire 06/06/2026
Second, the American consumer remains resilient. Retail sales increased 1% in May and 0.2% in June, which is a sign that consumer spending continues to improve. As you know, consumer spending accounts for about two-thirds of U.S. GDP growth. So, positive retail sales and a confident consumer bodes well for U.S. GDP growth going forward.
Source: CNN 07/16/2026
And third, U.S. exports of crude oil and natural gas are booming. The Energy Information Administration (EIA) reported that exports of crude oil and petroleum products surged to a record 13.6 million barrels per day in April. That’s up 15% from the previous record set in March. The U.S. also exported 807.5 billion cubic feet of natural gas in April.
Sources: EIA 7/8/2026 and U.S. Department of Energy 07/06/2026
Add that all together with anticipated AI productivity gains, and it’s easy to see why the U.S. economy could expand at a 5% annual pace in the third quarter—and continue to accelerate through yearend.
And I’m not the only one who thinks so: The Atlanta Fed currently expects the U.S. economy to grow at a 5.8% annual pace in the third quarter.
Source: Federal Reserve Bank of Atlanta July 2026
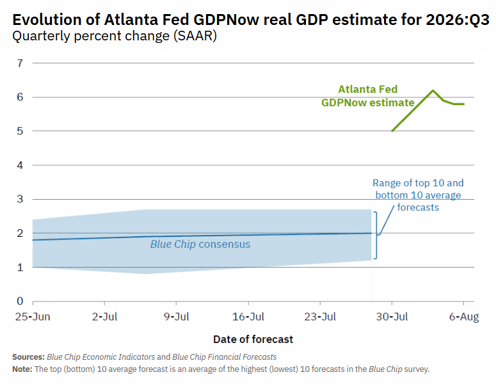
Now, before you get too excited, it’s important to note that the Atlanta Fed typically starts with a strong GDP forecast (initially 6.2%) and then revises it lower as the quarter progresses. But based on the aforementioned factors, 5% GDP growth in the third quarter is a very real possibility.
Central Banks’ Big Decision: To Raise or Cut Key Interest Rates
The Federal Reserve is officially under new leadership—and Fed Chairman Kevin Warsh started his term between a rock (President Trump pushing for key interest rate cuts) and a hard place (inflation rising due to the conflict in the Middle East).
It also doesn’t help that global central banks have increased key interest rates this year.
Most notably, the European Central Bank (ECB) upped its key interest rate by 25 basis points in June; it’s first hike in almost three years. The ECB cited elevated inflation due to rising energy prices as its reason for raising key interest rates.
While the ECB stood pat at its July policy meeting, it’s expected to raise rates again in September.
So, ahead of the Fed’s July policy meeting, there was a growing number of forecasts that our central bank could also raise rates. According to the CME Group FedWatch tool, there was one-in-three chance that the Fed could increase key interest rates.[1]
Source: CME Group July 2026
Thankfully, clearer heads prevailed.
It may have been a split decision, with three Fed officials dissenting, but the Fed voted to keep key interest rates steady at 3.5% to 3.75%. The three Fed officials who voted “no” to keeping rates steady were pushing for a key interest rate hike, as they expressed concerns about inflation.
Yes, inflation ticked up in the first half of 2026, especially energy inflation. But wholesale and consumer prices started to back off this summer.
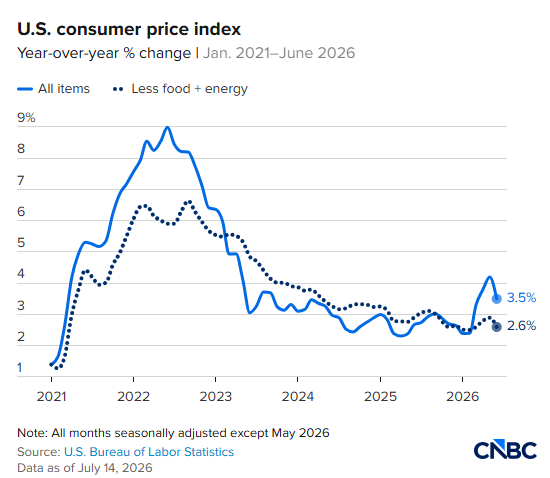
The Fed’s favorite inflation indicator, namely the Personal Consumption Expenditures (PCE) index also showed cooling inflation in June.
Headline PCE slipped 0.1% in June and was up 3.7% in the past 12 months. Core PCE, which excludes food and energy, rose 0.1% in June and is now running at a 3.3% annual rate. Economists expected a 0.2% month-to-month rise and a 3.3% annual pace.
Source: CNBC 07/30/2026
With inflation moderating, Fed Chairman Warsh arguing that productivity gains from AI are not inflationary, and U.S. economic growth set to accelerate, I don’t look for the Fed to raise key interest rates this year. One rate cut may be on the table but that all depends on market rates.
Fed Chairman Warsh has made it very clear that he will follow market rates.
If market rates decline and oil prices drop as they typically do in the fall based on seasonal demand, then there is a strong case for at least a quarter-point rate cut by the end of the year. Only time will tell.
Stock Market on Track to Set New Record Highs
Folks, we are in the midst of the best market environment since 1999.
The NASDAQ and the S&P 500 just experienced their strongest quarter in six years, with the NASDAQ jumping 21% and the S&P 500 rallying 15% in the second quarter. The Dow’s performance was also impressive, as it rose 13%.
But here’s what is really exciting: In my opinion, this run is far from over.
Industry analysts estimate that the S&P 500 will achieve 26.1% annual earnings growth in 2026 and 17.8% annual earnings growth in 2027. (More on the phenomenal earnings environment in a moment.) This is important because accelerating corporate earnings should continue to boost the stock market.
Source: Morningstar 07/18/2026
In fact, our friends at FactSet recently pointed out that the S&P 500 could achieve another 21% gain in the next 12 months.[3] Personally, I think FactSet’s projection may be conservative.
Source: Yahoo Finance 07/06/2026
Jason Bodner (who writes Sector Spotlight in the Navellier & Associates weekly Marketmail) recently commented on the stock market’s pullback in July, which is historically one of the strongest months of the year for stocks, and why it could be the pause that refreshes.
“July has traditionally been one of the strongest months of the year, averaging gains of about 1.5%, with positive returns roughly two-thirds of the time. August and September are a different story. Since 1990, August has been slightly negative on average, while September has been the weakest month of the year, averaging a loss of nearly 0.75%. During mid-term election years, that seasonal softness has often been more pronounced, with the majority of the year’s volatility typically arriving before October.
But here’s the part most investors miss: The fourth-quarter in mid-term years has been consistently strong, averaging 7% gains, with an 88% positive rate since 1926. And since 1950, the S&P 500 has averaged a 36% one-year forward return off its mid-term year lows, so the calendar has a way of rewarding patience.
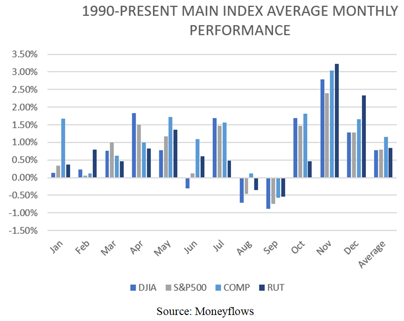
“That doesn’t mean history always repeats. But even healthy bull-markets pause. Pull-backs shake out the fast money, reset expectations, and create opportunities for investors willing to stay in their seat.
“I think we are there today.”
In the words of Mark Twain, “History doesn’t repeat itself, but it often rhymes.”
So, if the S&P 500 is to follow historical precedence, it will continue to meander higher in the second half of the year. Currently, the S&P 500 has rallied about 22% off its mid-term year lows (March 30). And if my math is correct and the S&P 500 achieves its historical 36% gain off mid-term election year lows, then the S&P 500 could rally another 12% from current levels.
And that’s giving off “party like it’s 1999” vibes.
Now, one of the main reasons why I believe the market will continue to set new all-time highs in the upcoming months is: accelerating earnings momentum.
Corporate Earnings Accelerate in Every Quarter of 2026
An interesting phenomenon occurred ahead of the second-quarter earnings announcement season.
The analyst community increased earnings estimates.
Historically, analysts lower their earnings estimates ahead of a quarterly earnings season. In fact, earnings estimates typically drop by 2% to 3%, and they are not revised higher until quarterly results start to pour in.
This year, analysts have been revising earnings estimates higher before earnings season commenced.
At the start of the second quarter, analysts only expected the S&P 500 to achieve 18.8% average earnings growth. But over the next three months, analysts upped earnings estimates by the largest amount in five years. Estimates were revised more than 3% higher.
Source: FACTSET 07/02/2026
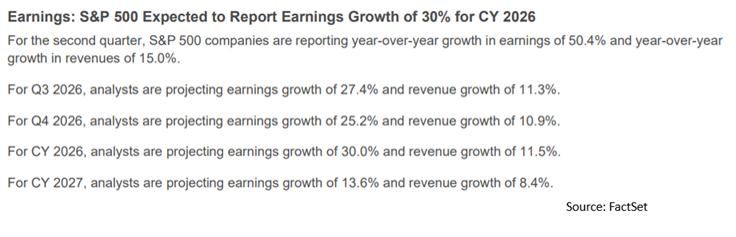
Now, it looks like the S&P 500 is on track to even better than that with FactSet’s latest Earnings Insight revealed the S&P 500’s average earnings growth rate is now 50.4%.
Source: FACTSET 08/07/2026
In other words, wave-after-wave of positive earnings surprises has driven the S&P 500’s average earnings growth rate higher—and in turn, that’s lit a fire under some of the biggest earnings winners.
If the S&P 500 does achieve second-quarter earnings growth of more than 50%, it would mark the second-straight quarter of more than 20% average earnings growth.
This could set the pace for the S&P 500 to be able to report more than 20% average earnings growth for every single quarter of 2026.
The current consensus estimate calls for 27.4% and 25.2% average earnings growth in the third and fourth quarters, respectively. The S&P 500 is also expected to achieve 30% average earnings growth in calendar year 2026.
Talk about a phenomenal earnings environment!
While the overall earnings environment and better-than-expected quarterly results could continue to serve as the “rising tide that lifts most boats,” there are a few sectors that have the opportunity to outperform in the upcoming months.
Top 3 Sectors for the Second Half
You may already be aware of this, but the biggest earnings winners in the second-quarter earnings season are clear: Artificial Intelligence (AI) and data center stocks.
ASML Holding NV (ASML) and Taiwan Semiconductor Manufacturing Company Limited (TSM) kicked off the first round of results from AI- and data center-related stocks—and they did not disappoint.
ASML, a top supplier of photolithography systems that are vital to the production of semiconductor microchips, reported total second-quarter revenue of 9.33 billion euros and earnings of 2.9 billion euros, topping estimates for revenue of 8.85 billion euros and earnings of 2.6 billion euros. The company also increased its guidance for the second time this year.
TSMC, the biggest semiconductor foundry in the world, revealed its sales increased 36% year-over-year to NT$1.27 trillion, and earnings jumped 77.4% year-over-year to NT$706.56 billion, or NT$27.25 per share. Earnings of $4.31 per ADR beat estimates for $3.89 per ADR by 10.8%.
Both of these reports set the stage for a spectacular earning season for AI and data center stocks.
Even at the start of the second-quarter earnings season, most analysts were expecting blowout quarterly results from the information technology and semiconductor stocks. FactSet estimates that the communication services and information technology sectors will achieve 117% and 70.4% average earnings growth, respectively, for the second quarter—versus the S&P 500’s forecasted 50.4%.
Source: FACTSET 08/07/206
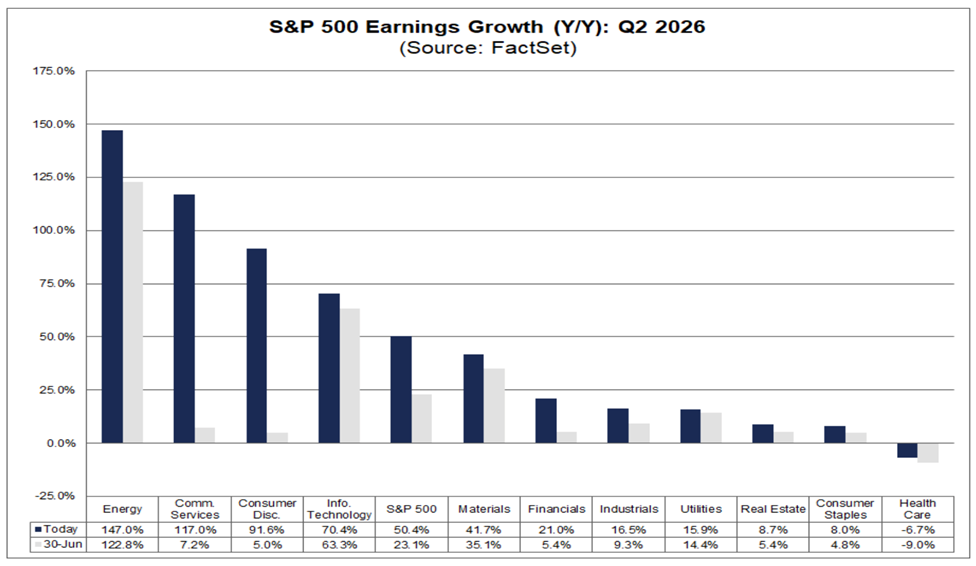
Energy (147%) and consumer discretionary (91.6%) were the only other two buckets of stocks forecasted to have better earnings growth than the S&P 500.
So, the Top 3 sectors that are currently best positioned for the second half are clear…
- AI- and data center-related stocks: Companies that are developing and manufacturing AI chips, focusing on data center infrastructure, providing liquid-cooling server technology for data centers, keeping data centers running with reliable power sources, and more.
- Energy-related stocks: Crude oil tankers that are hauling oil around the world and helping to resupply global stockpiles, as well as midstream energy companies boosting production to keep up with the world’s insatiable appetite for oil and natural gas.
- Consumer Discretionary stocks: Companies that provide non-essential goods or services (i.e., vehicles, luxury items, etc.).
It’s a relatively narrow market, for sure, but there is no denying that companies with accelerating earnings momentum are leading the overall stock market—and should continue to lead in the second half of this year.
If I had to put a number on it, I would say that I anticipate fundamentally superior stocks could tack on another 30% to 40% gain by yearend.
And if your personal portfolio is aligned accordingly, you could stand to prosper immensely in the upcoming months and years.
Prepare for the Second Half Today
We are in an incredible environment for stock appreciation.
The U.S. economy is starting to fire on all cylinders, and it is leading overall global economic growth. Our central bank should remain accommodative, especially if inflation continues to cool. Corporate earnings will increase by more than 20% on average in every quarter of 2026.
All of which should be strong reasons to drive the stock market to new record high after new record high.
While the rising tide often lifts all boats, there is one main bucket of stocks that I believe will lead the overall market higher in the upcoming months: fundamentally superior stocks.
I am convinced that 2026 will be the year of growth stocks.
You may already know this about me… I’m obsessed with fundamentally superior stocks.
My fascination with growth stocks started back in the late 1970s during my college years at Cal State Hayward. I wanted to uncover how to beat the market without taking on too much risk—and what I discovered was that a select group of stocks can consistently outperform the S&P 500: stocks with superior fundamentals.
In other words, stocks with strong sales and earnings growth, as well as positive analyst revisions.
Today, I’m a self-proclaimed “number guys” because the numbers do not lie—and right now, the numbers are telling me that stocks with accelerating earnings and sales momentum are the best way to prosper in 2026.
How to Start Building Your Portfolio Today
Navellier & Associates is a money management firm with a primary goal to help individuals like you develop a customized investment strategy.
Our team of professionals work closely with you to answer questions about your retirement goals, how long you have to reach these goals and what your risk tolerance is—to name a new!—and then we discuss a customized solution tailored specifically for you and your goals.
A no-obligation portfolio review is the first step to creating your custom investment solution.
The fact is everyone is different—and a portfolio review helps us better understand your specific financial needs and goals now and in the future. And in order to reach these goals, we cannot stress enough the importance of a well-balanced portfolio.
A well-balanced portfolio can literally neutralize the stock market’s uncertainty and take advantage of unique growth opportunities the market throws our way.
That’s why at Navellier & Associates, we encourage our clients to take a diversified approach to managing their investments—one that can include growth, income, and capital preservation strategies.
Growth Portfolios
These portfolios feature companies that are committed to growing their sales and earnings. Our growth portfolios are segmented by market capitalization, are actively managed, and seek inefficiently priced growth stocks with opportunities for long-term price appreciation. We screen for small- and large-cap companies that are consistently growing sales and earnings. Our team actively manages this portfolio to find undervalued growth stocks.
Income Portfolios
These offerings provide dividend growth and income opportunities with capital appreciation. At Navellier, our dividend and income portfolios strive for portfolio growth through securities with capital appreciation, strong dividend growth and income opportunities. We seek out companies that have a history of growing and paying dividends. Most importantly, these dividend-paying companies have free cash flow to cover each dividend payment. This can make it much easier to have reliable income in retirement.
Capital Preservation/Defensive Portfolios
These portfolios aim to outperform in up markets and limit losses in declining markets by moving to cash or bonds. This asset allocation plan allows investors to play defense in a declining market. Our capital preservation strategies can help you mitigate steep market losses with defensive ETFs and covered calls. Defensive ETFs can serve this need as they shift to cash or bonds when conditions permit.
Simply put, the power of a well-balanced portfolio cannot be overstated.
So, in your no-obligation portfolio review, we’ll dive deeper into the details of our exclusive portfolios and strategies. What you’ll discover is that many of them cross boundaries and can be combined to form an overall portfolio strategy. That portfolio can then be customized to your personal financial goals and risk tolerance.
But to help you better understand how we build a portfolio tailored to your specific needs, here’s a sneak peak at how we select stocks for each of our custom portfolio offerings…
Our Proprietary 3-Step Stock Selection Process
At Navellier & Associates, our system was built to find inefficiency in the market, uncover what we think are the market’s best growth stocks, and utilize a disciplined quantitative and fundamental analysis system to create a customized portfolio for individual investors.
Consider an example of the three-step proprietary stock-selection process that we utilize for most portfolios:
- Quantitative Analysis: Using our proprietary screening process, we measure reward (alpha) and risk (standard deviation) indicators to the appropriate market capitalization range for each portfolio. We rank stocks based on the reward/risk measure and reduce the initial investment universe to a select bucket of stocks that fall into the upper percentiles of the reward/risk measure.
- Fundamental Analysis: We then apply fundamental variable screens to the stocks with the highest reward/risk measures. This shines the spotlight on which companies have exceptional profit margins, excellent earnings growth (and positive earnings surprise potential!) and reasonable price/earnings ratios (based on expected future earnings).
- Securities Optimization: We use a proprietary optimization model to maximize alpha, while minimizing portfolio standard deviation. This can efficiently allocate the stocks and create portfolios that are well diversified across sectors and industries.
Primarily, our goal with the three-step stock selection process is to develop portfolios that have a low correlation to their benchmarks, increasing diversification, decreasing risk and maximizing profits for investors like you.
So, no matter what’s happening in the market—whether we’re in a raging bull market or a gut-wrenching bear market—all of us at Navellier & Associates believe in the importance of a custom investment strategy that focuses on your financial goals and risk tolerance, as well as diversification.
And we can help you build your own customized portfolio strategy.
Navellier & Associates relies on extensive research, trend analysis, customized strategies, and historic market knowledge to manage client-only portfolios and to help clients take advantage of opportunities that are presented by market corrections—short and long-term—as well as bull market situations.
Our proprietary models are built to work on U.S.-based portfolios with a minimum account value of $250,000. If your portfolio meets these criteria, please contact my Navellier & Associates team. They are standing by, ready to discuss your personal portfolio and investment strategy to help you make the most of 2026—and beyond!
Schedule Your Portfolio Review Today
Are you ready to prosper in 2026?
Then, now is the perfect time to contact Navellier & Associates to set up a no-obligation portfolio review.
A portfolio review gives us an opportunity to learn more about you. We want to know about your long- and short-term goals, your current and future income/expenses and your overall financial outlook, so that we can make the right suggestions for your personal situation.
And don’t worry… there is never a charge for this portfolio review.
If you decide you would like Navellier & Associates to manage your portfolio—or one aspect of your portfolio—we will discuss any management fees for that service.
If you decide you’d like to continue to manage things yourself, we hope that we have given you some important information to consider during your portfolio review.
We are not here to simply preach to you but rather to share information that we have gained from our extensive market research and analysis.
Click here now to schedule your no-obligation portfolio review.
I’m confident that Navellier & Associates can help guide you to build a portfolio to navigate the current environment and tailor your strategy to your individual risk tolerance.
All the best to you and yours,

Louis Navellier
Chief Investment Officer
Navellier & Associates, Inc. │ Private Client Group
Get Started
Sign me up for a portfolio review. I look forward to a conversation about my holdings, risk tolerance, and investment goals.
At Navellier & Associates, we help serious investors like you:
- Identify hidden risks in your portfolio
- Position for growth even in volatile markets
- Build a strategy that balances protection and opportunity
We have a limited number of spots for these sought-after portfolio reviews. We expect they could all be spoken for in the coming 48 hours.
This opportunity is for qualified investors with $250,000+ in investable assets. You must live and invest in the United States. And you must be able to share your holdings for a full risk assessment.
Act Now—Spots Are Limited!
For fastest service, call 1-800-887-8671.
Or, fill out our consultation form below.
About Louis Navellier
 My name is Louis Navellier and I’m most widely known as an investment adviser and market analyst. Since 1980, I’ve been publishing my quantitative analysis on growth stocks and I’ve made it my life’s work to continuously refine and develop my analysis for investors like you.
My research and analysis have led to regular appearances on CNBC and Fox Business News and I am frequently quoted by MarketWatch and Bloomberg.
I also manage money for private and institutional clients through my money management company, Navellier & Associates, Inc.
Wealthy individuals and institutional investors want access to my 30+ years of quantitative research experience.
Our work with these professionals requires tight controls on investment risk and an exhaustive due diligence process.
The overall goal for our clients focuses on how to achieve steady, long-term returns in up and down markets.
At Navellier & Associates, our proprietary quantitative models are designed to balance stocks, mutual funds, and income-producing investments to maximize returns while controlling risk.
And today, I’m thrilled to give you the opportunity to put this same rigorous screening criteria and quantitative and fundamental analysis to work for your portfolio. For U.S.-based portfolios from $250,000 to $100+ million — my firm is here to help.
Important Disclosures
Investment in stocks involves substantial risk and has the potential for partial or complete loss of funds invested. The accompanying charts are for informational purposes only and are not to be construed as an offer to buy or sell any financial instrument or investment strategy and should not be relied upon in an investment making decision. This is not an offer of investment advice and is not an investment strategy. It is simply a disclosure of the results of Navellier’s proprietary analysis. The performance presented is not based on any actual securities trading, portfolio, or accounts, and the reported hypothetical performance of the A, B, C, D, and F stock groups graded should not be considered investment advice or an investment strategy.
The charts and other information presented here do not represent actual funded trades and are not actual funded portfolios. There are material differences between hypothetical and the research, and hypothetical performance figures presented here. The research results (1) may contain stocks that are illiquid and difficult to trade; (2) may contain stock holdings materially different from actual funded investments; (3) include the reinvestment of all dividends and other earnings, estimated trading costs, commissions, or management fees; and, (4) may not reflect prices obtained in an actual funded investment. For these and other reasons, the reported performances do not reflect the performance results of actually funded and traded Investment Products.
As a matter of important disclosure regarding the hypothetical results presented for Stock Grader and Dividend Grader, the following factors must be considered when evaluating the long- and short-term performance figures presented:
(1) Historical or illustrated results presented herein do not indicate future performance; Investment in securities involves significant risk and has the potential for partial or complete loss of funds invested.
(2) The results presented were generated during a period of mixed (improving and deteriorating) economic conditions in the U.S. and positive and negative market performance. There can be no assurance that these same market conditions will occur again in the future. Navellier has no data regarding actual performance in different economic or market cycles or conditions.
(3) The back-tested historical look back performance was derived from the hypothetical application of a particular Navellier analysis applying investment criteria with the benefit of hindsight.
(4) The hypothetical results portrayed reflect the hypothetical reinvestment of dividends and other income.
(5) The hypothetical net performance results portrayed include the hypothetical reinvestment of all dividends and other earnings. Hypothetical net results also include our estimation of investment advisory fees, administrative fees, transaction expenses, or other expenses that an investor might have paid. A 1.75% annualized advisory fee is built into the net return calculations although that fee is higher than actual advisory fees investors normally pay for investment advisory services.
(6) LIMITATIONS INHERENT IN HYPOTHETICAL RESULTS: The hypothetical performance results presented are not from actually funded investments, and may not reflect the impact that material economic and market factors might have had on adviser’s or investors decision making if an adviser were actually managing a clients’ money, and thus present returns which are greater than what an actual investor would have experienced for the time period. The results are presented for informational purposes only. No real money has been invested in this analysis of hypothetical performance. The hypothetical performance results should not be considered and are not actual performance.
Copyright © 2026 Navellier. All rights reserved.
Terms of Use | Privacy Policy | Voting Proxy Policy
1 East Liberty, Suite 504 Reno, Nevada 89501 | (800)-887-8671