by Jason Bodner
April 4, 2023
Question: If, five years ago, I had asked you to choose which of two options would more likely cause a long-term market meltdown – which would it be?
- Persistent inflation and uncertainty over interest rates? Or-
- A come-from-nowhere deadly virus that threatened to wipe out half of humanity?
Call me crazy, but I would have said “2,” but here we are: The investment and economic landscape looks worse in 2022-23 than in the month-long market crash of March 2020, after which we saw stocks soar.
Life is stranger than fiction. Things never cease to amaze me. For instance, caffeine doesn’t actually give you energy. Caffeine interacts with adenosine in your brain and tricks you into thinking you’re not tired.
With that in mind, grab a cup and perk up, because I’m about to talk about economic headwinds and why investor grumpiness may be compounding a fixable issue. More importantly, we’ll discuss the actual data.
Markets have been bipolar for over a year now, due to a host of unforeseen events. A short recap:
- Things got ugly for tech stocks in November of 2021.
- Stocks in general began to sag in the beginning of 2022.
- Things intensified in the spring with a margin unwind (leveraged bets), forcing prices even lower.
- Crypto got clocked with the de-pegging of Terra Luna, causing a crisis of confidence.
- That crisis intensified when FTX collapsed and was exposed as possibly the largest fraud yet.
- All the while, the Fed aggressively hiked rates at the fastest pace in history.
Major indexes fell as much as 25% (S&P 500) to 35% (NASDAQ). Despite this, we hoped for either a soft-landing or the avoidance of recession. Unlikely as it may seem, Fed chair Jerome Powell still sees a path to a soft-landing “difficult.” Just to remind you, all these “difficulties” we feel in terms of inflation, less disposable income, and sagging investments are happening well after COVID-19 threatened to kill us.
Recent price fluctuations are due to a push-and-pull outlook between Powell and Yellen. Last week, the FOMC decision to raise the target rate 0.25% caused stocks to cheer. Powell reiterated the strength and soundness of the U.S. banking system. However, Treasury Secretary Janet Yellen said that there is no specific consideration to guarantee all deposits at this time, so stocks then reversed and sagged.
This typifies the landscape we face today… a volatile, unpredictable, and skittish one. In that light, I think it’s important to discuss market mechanics quickly, to put these volatile swings in further context:
In normal (good) times, there is an inherent underlying bid for stocks. Bull markets rise over a long period of time because of one simple reason: Buying pressure outweighs selling. Sure, markets pull back and even feel scary at times, but invariably they will recover, and the bull market remains intact. That’s because there are many investors who have medium- and long-term confidence in the strength of stocks.
But when the bear claws come out, things feel different. Investors clamor for cash. They prefer to sit out the risk of the market and wait. That clears the road of what I call baseline liquidity – the inherent bid in most markets. When buyers pause – for however long – markets get more volatile. That’s where we are today, in a headline driven whipsaw atmosphere where it’s hard to determine what tomorrow brings.
In fact, according to this chart, cash is at its highest levels since COVID (thank you Alec Young!):
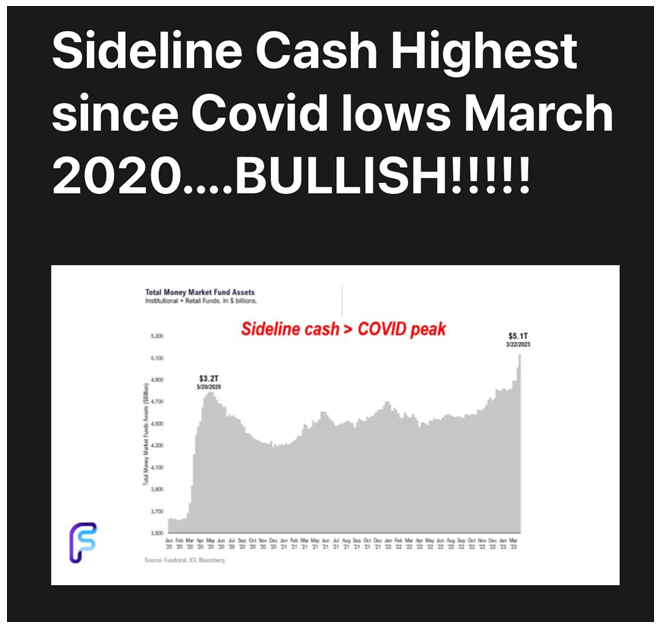
Graphs are for illustrative and discussion purposes only. Please read important disclosures at the end of this commentary.
That’s very bullish! And we also see that echoed in some of the unique data that I look at. The Big Money Index (BMI) measures all unusual buying and selling over a 25-day moving average. When the BMI is rising, buyers have control. If it is falling, sellers took the wheel. If it rises above 80%, it is overbought, and we can expect near-term weakness when it falls from overbought. If it falls below 25%, it is oversold, and we can expect a near-term reversion higher for stocks. The BMI fell from overbought in February. Markets fell, and now the BMI hovers just over oversold. (It hit 29% only to bounce to 33%).
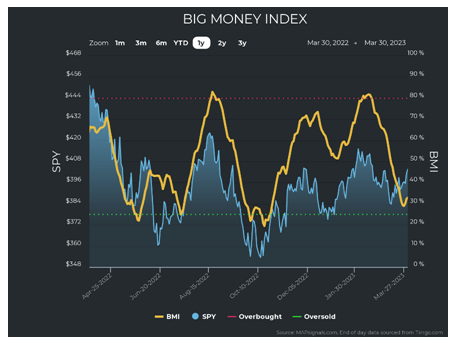
Graphs are for illustrative and discussion purposes only. Please read important disclosures at the end of this commentary.
The reason? Selling suddenly vanished as you can see here with the red bars diminishing lately:
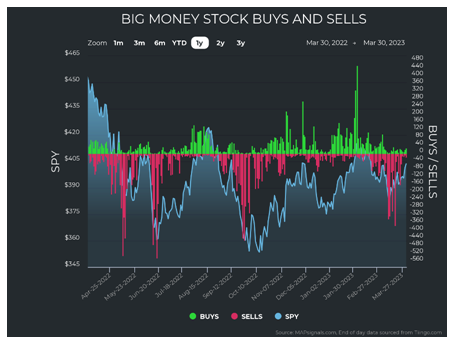
Graphs are for illustrative and discussion purposes only. Please read important disclosures at the end of this commentary.
We have proactive action guaranteeing deposits of failed tech and crypto-friendly banks to thank for that. We also have further clarity on interest rates and a lower than originally expected rate-hike.
Is this a pause before we drop? Or the beginning of another leg higher?
I am inclined to say the latter. The data indicates a slowing in selling and potential for buying if Q1 earnings start out surprisingly pleasant (which has been the trend). Also, the market has been in a new uptrend since October. The SPY (S&P 500 tracking ETF) has made higher highs, and higher lows.
As this chart shows, we are currently in the lower part of an up-trending channel:
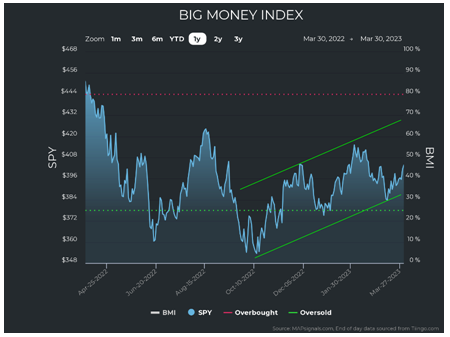
Graphs are for illustrative and discussion purposes only. Please read important disclosures at the end of this commentary.
I believe there will be just one more 0.25% hike – if that. Then we should enter a coasting period. That likely means the back half of the year will see material market improvement and lower volatility.
Naturally, I could be wrong.
Here’s Why The “News” Doesn’t Matter
I use a statistical quantitative approach to analyzing stocks. I don’t use “my gut” … meaning emotions, mood swings, euphoria, fear, anxiety, sadness, guilt, or how much I love to pick stocks. I look for big institutional support of the stocks with the best quality fundamentals and technicals. When those get scooped, odds are they will rise higher, regardless of what Russia, the Fed, COVID, or inflation does.
There are always stocks that go up, and the big money usually illuminates which ones. Right now, Tech, Discretionary, and Industrials lead while Communications, Financials, and Real Estate lag:
![]()
Graphs are for illustrative and discussion purposes only. Please read important disclosures at the end of this commentary.
It may not be popular, but I’m feeling positive and optimistic. Regardless, I learned long ago that what I feel has nothing to do with it. As the engineer and management consultant W. Edwards Deming put it, “Without data you’re just another person with an opinion.”
All content above represents the opinion of Jason Bodner of Navellier & Associates, Inc.
Also In This Issue
A Look Ahead by Louis Navellier
The “Wall of Worry” is Crumbling, Brick by Brick
Income Mail by Bryan Perry
The Stock Market Loves Liquidity Injections
Growth Mail by Gary Alexander
The NASDAQ 100 Rose 20% in Q1: Danger or Opportunity
Global Mail by Ivan Martchev
Temporary Good News on the Banking Front
Sector Spotlight by Jason Bodner
Are We on The Edge of a Market Precipice?
View Full Archive
Read Past Issues Here

Jason Bodner
MARKETMAIL EDITOR FOR SECTOR SPOTLIGHT
Jason Bodner writes Sector Spotlight in the weekly Marketmail publication and has authored several white papers for the company. He is also Co-Founder of Macro Analytics for Professionals which produces proprietary equity accumulation/distribution research for its clients. Previously, Mr. Bodner served as Director of European Equity Derivatives for Cantor Fitzgerald Europe in London, then moved to the role of Head of Equity Derivatives North America for the same company in New York. He also served as S.V.P. Equity Derivatives for Jefferies, LLC. He received a B.S. in business administration in 1996, with honors, from Skidmore College as a member of the Periclean Honors Society. All content of “Sector Spotlight” represents the opinion of Jason Bodner
Important Disclosures:
Jason Bodner is a co-founder and co-owner of Mapsignals. Mr. Bodner is an independent contractor who is occasionally hired by Navellier & Associates to write an article and or provide opinions for possible use in articles that appear in Navellier & Associates weekly Market Mail. Mr. Bodner is not employed or affiliated with Louis Navellier, Navellier & Associates, Inc., or any other Navellier owned entity. The opinions and statements made here are those of Mr. Bodner and not necessarily those of any other persons or entities. This is not an endorsement, or solicitation or testimonial or investment advice regarding the BMI Index or any statements or recommendations or analysis in the article or the BMI Index or Mapsignals or its products or strategies.
Although information in these reports has been obtained from and is based upon sources that Navellier believes to be reliable, Navellier does not guarantee its accuracy and it may be incomplete or condensed. All opinions and estimates constitute Navellier’s judgment as of the date the report was created and are subject to change without notice. These reports are for informational purposes only and are not a solicitation for the purchase or sale of a security. Any decision to purchase securities mentioned in these reports must take into account existing public information on such securities or any registered prospectus.To the extent permitted by law, neither Navellier & Associates, Inc., nor any of its affiliates, agents, or service providers assumes any liability or responsibility nor owes any duty of care for any consequences of any person acting or refraining to act in reliance on the information contained in this communication or for any decision based on it.
Past performance is no indication of future results. Investment in securities involves significant risk and has the potential for partial or complete loss of funds invested. It should not be assumed that any securities recommendations made by Navellier. in the future will be profitable or equal the performance of securities made in this report. Dividend payments are not guaranteed. The amount of a dividend payment, if any, can vary over time and issuers may reduce dividends paid on securities in the event of a recession or adverse event affecting a specific industry or issuer.
None of the stock information, data, and company information presented herein constitutes a recommendation by Navellier or a solicitation to buy or sell any securities. Any specific securities identified and described do not represent all of the securities purchased, sold, or recommended for advisory clients. The holdings identified do not represent all of the securities purchased, sold, or recommended for advisory clients and the reader should not assume that investments in the securities identified and discussed were or will be profitable.
Information presented is general information that does not take into account your individual circumstances, financial situation, or needs, nor does it present a personalized recommendation to you. Individual stocks presented may not be suitable for every investor. Investment in securities involves significant risk and has the potential for partial or complete loss of funds invested. Investment in fixed income securities has the potential for the investment return and principal value of an investment to fluctuate so that an investor’s holdings, when redeemed, may be worth less than their original cost.
One cannot invest directly in an index. Index is unmanaged and index performance does not reflect deduction of fees, expenses, or taxes. Presentation of Index data does not reflect a belief by Navellier that any stock index constitutes an investment alternative to any Navellier equity strategy or is necessarily comparable to such strategies. Among the most important differences between the Indices and Navellier strategies are that the Navellier equity strategies may (1) incur material management fees, (2) concentrate its investments in relatively few stocks, industries, or sectors, (3) have significantly greater trading activity and related costs, and (4) be significantly more or less volatile than the Indices.
ETF Risk: We may invest in exchange traded funds (“ETFs”) and some of our investment strategies are generally fully invested in ETFs. Like traditional mutual funds, ETFs charge asset-based fees, but they generally do not charge initial sales charges or redemption fees and investors typically pay only customary brokerage fees to buy and sell ETF shares. The fees and costs charged by ETFs held in client accounts will not be deducted from the compensation the client pays Navellier. ETF prices can fluctuate up or down, and a client account could lose money investing in an ETF if the prices of the securities owned by the ETF go down. ETFs are subject to additional risks:
- ETF shares may trade above or below their net asset value;
- An active trading market for an ETF’s shares may not develop or be maintained;
- The value of an ETF may be more volatile than the underlying portfolio of securities the ETF is designed to track;
- The cost of owning shares of the ETF may exceed those a client would incur by directly investing in the underlying securities; and
- Trading of an ETF’s shares may be halted if the listing exchange’s officials deem it appropriate, the shares are delisted from the exchange, or the activation of market-wide “circuit breakers” (which are tied to large decreases in stock prices) halts stock trading generally.
Grader Disclosures: Investment in equity strategies involves substantial risk and has the potential for partial or complete loss of funds invested. The sample portfolio and any accompanying charts are for informational purposes only and are not to be construed as a solicitation to buy or sell any financial instrument and should not be relied upon as the sole factor in an investment making decision. As a matter of normal and important disclosures to you, as a potential investor, please consider the following: The performance presented is not based on any actual securities trading, portfolio, or accounts, and the reported performance of the A, B, C, D, and F portfolios (collectively the “model portfolios”) should be considered mere “paper” or pro forma performance results based on Navellier’s research.
Investors evaluating any of Navellier & Associates, Inc.’s, (or its affiliates’) Investment Products must not use any information presented here, including the performance figures of the model portfolios, in their evaluation of any Navellier Investment Products. Navellier Investment Products include the firm’s mutual funds and managed accounts. The model portfolios, charts, and other information presented do not represent actual funded trades and are not actual funded portfolios. There are material differences between Navellier Investment Products’ portfolios and the model portfolios, research, and performance figures presented here. The model portfolios and the research results (1) may contain stocks or ETFs that are illiquid and difficult to trade; (2) may contain stock or ETF holdings materially different from actual funded Navellier Investment Product portfolios; (3) include the reinvestment of all dividends and other earnings, estimated trading costs, commissions, or management fees; and, (4) may not reflect prices obtained in an actual funded Navellier Investment Product portfolio. For these and other reasons, the reported performances of model portfolios do not reflect the performance results of Navellier’s actually funded and traded Investment Products. In most cases, Navellier’s Investment Products have materially lower performance results than the performances of the model portfolios presented.
This report contains statements that are, or may be considered to be, forward-looking statements. All statements that are not historical facts, including statements about our beliefs or expectations, are “forward-looking statements” within the meaning of The U.S. Private Securities Litigation Reform Act of 1995. These statements may be identified by such forward-looking terminology as “expect,” “estimate,” “plan,” “intend,” “believe,” “anticipate,” “may,” “will,” “should,” “could,” “continue,” “project,” or similar statements or variations of such terms. Our forward-looking statements are based on a series of expectations, assumptions, and projections, are not guarantees of future results or performance, and involve substantial risks and uncertainty as described in Form ADV Part 2A of our filing with the Securities and Exchange Commission (SEC), which is available at www.adviserinfo.sec.gov or by requesting a copy by emailing info@navellier.com. All of our forward-looking statements are as of the date of this report only. We can give no assurance that such expectations or forward-looking statements will prove to be correct. Actual results may differ materially. You are urged to carefully consider all such factors.
FEDERAL TAX ADVICE DISCLAIMER: As required by U.S. Treasury Regulations, you are informed that, to the extent this presentation includes any federal tax advice, the presentation is not written by Navellier to be used, and cannot be used, for the purpose of avoiding federal tax penalties. Navellier does not advise on any income tax requirements or issues. Use of any information presented by Navellier is for general information only and does not represent tax advice either express or implied. You are encouraged to seek professional tax advice for income tax questions and assistance.
IMPORTANT NEWSLETTER DISCLOSURE:The hypothetical performance results for investment newsletters that are authored or edited by Louis Navellier, including Louis Navellier’s Growth Investor, Louis Navellier’s Breakthrough Stocks, Louis Navellier’s Accelerated Profits, and Louis Navellier’s Platinum Club, are not based on any actual securities trading, portfolio, or accounts, and the newsletters’ reported hypothetical performances should be considered mere “paper” or proforma hypothetical performance results and are not actual performance of real world trades. Navellier & Associates, Inc. does not have any relation to or affiliation with the owner of these newsletters. There are material differences between Navellier Investment Products’ portfolios and the InvestorPlace Media, LLC newsletter portfolios authored by Louis Navellier. The InvestorPlace Media, LLC newsletters contain hypothetical performance that do not include transaction costs, advisory fees, or other fees a client might incur if actual investments and trades were being made by an investor. As a result, newsletter performance should not be used to evaluate Navellier Investment services which are separate and different from the newsletters. The owner of the newsletters is InvestorPlace Media, LLC and any questions concerning the newsletters, including any newsletter advertising or hypothetical Newsletter performance claims, (which are calculated solely by Investor Place Media and not Navellier) should be referred to InvestorPlace Media, LLC at (800) 718-8289.
Please note that Navellier & Associates and the Navellier Private Client Group are managed completely independent of the newsletters owned and published by InvestorPlace Media, LLC and written and edited by Louis Navellier, and investment performance of the newsletters should in no way be considered indicative of potential future investment performance for any Navellier & Associates separately managed account portfolio. Potential investors should consult with their financial advisor before investing in any Navellier Investment Product.
Navellier claims compliance with Global Investment Performance Standards (GIPS). To receive a complete list and descriptions of Navellier’s composites and/or a presentation that adheres to the GIPS standards, please contact Navellier or click here. It should not be assumed that any securities recommendations made by Navellier & Associates, Inc. in the future will be profitable or equal the performance of securities made in this report.
FactSet Disclosure: Navellier does not independently calculate the statistical information included in the attached report. The calculation and the information are provided by FactSet, a company not related to Navellier. Although information contained in the report has been obtained from FactSet and is based on sources Navellier believes to be reliable, Navellier does not guarantee its accuracy, and it may be incomplete or condensed. The report and the related FactSet sourced information are provided on an “as is” basis. The user assumes the entire risk of any use made of this information. Investors should consider the report as only a single factor in making their investment decision. The report is for informational purposes only and is not intended as an offer or solicitation for the purchase or sale of a security. FactSet sourced information is the exclusive property of FactSet. Without prior written permission of FactSet, this information may not be reproduced, disseminated or used to create any financial products. All indices are unmanaged and performance of the indices include reinvestment of dividends and interest income, unless otherwise noted, are not illustrative of any particular investment and an investment cannot be made in any index. Past performance is no guarantee of future results.